HAL Id: hal-02316194
https://hal.umontpellier.fr/hal-02316194
Submitted on 15 Oct 2019
HAL is a multi-disciplinary open access
archive for the deposit and dissemination of
sci-entific research documents, whether they are
pub-lished or not. The documents may come from
teaching and research institutions in France or
abroad, or from public or private research centers.
L’archive ouverte pluridisciplinaire HAL, est
destinée au dépôt et à la diffusion de documents
scientifiques de niveau recherche, publiés ou non,
émanant des établissements d’enseignement et de
recherche français ou étrangers, des laboratoires
publics ou privés.
reference dataset for remote sensing of forest biomass
Dmitry Schepaschenko, Jérôme Chave, Oliver Phillips, Simon Lewis, Stuart
Davies, Maxime Réjou-Méchain, Plinio Sist, Klaus Scipal, Christoph Perger,
Bruno Hérault, et al.
To cite this version:
Dmitry Schepaschenko, Jérôme Chave, Oliver Phillips, Simon Lewis, Stuart Davies, et al.. The Forest
Observation System, building a global reference dataset for remote sensing of forest biomass. Scientific
Data , Nature Publishing Group, 2019, 6 (1), �10.1038/s41597-019-0196-1�. �hal-02316194�
the Forest Observation System,
building a global reference dataset
for remote sensing of forest
biomass
Dmitry Schepaschenko et al.
#Forest biomass is an essential indicator for monitoring the Earth’s ecosystems and climate.
It is a critical input to greenhouse gas accounting, estimation of carbon losses and forest
degradation, assessment of renewable energy potential, and for developing climate change
mitigation policies such as REDD+, among others. Wall-to-wall mapping of aboveground
biomass (aGB) is now possible with satellite remote sensing (RS). However, RS methods
require extant, up-to-date, reliable, representative and comparable in situ data for
calibration and validation. Here, we present the Forest Observation System (FOS) initiative,
an international cooperation to establish and maintain a global in situ forest biomass
database. aGB and canopy height estimates with their associated uncertainties are derived at
a 0.25 ha scale from field measurements made in permanent research plots across the world’s
forests. all plot estimates are geolocated and have a size that allows for direct comparison
with many RS measurements. The FOS offers the potential to improve the accuracy of
RS-based biomass products while developing new synergies between the RS and ground-RS-based
ecosystem research communities.
Background & Summary
Global estimates of forest height, aboveground biomass (AGB) and changes over space and time are needed as both essential climate variables1 and essential biodiversity variables2, and to support international policy ini-tiatives such as REDD+ 3. Several space-borne missions to assess forest structure and functioning, including BIOMASS (ESA), ALOS PALSAR (JAXA), GEDI (NASA) and NISAR (NASA-ISRO), will be operational in the coming years. These missions require ground-based estimates for algorithm calibration and product validation. For instance, high-quality, standardized measurements of forest biomass and height are critical for improving the accuracy of products derived from space-borne instruments. Furthermore, ensuring that different missions have access to the same set of high-quality standardized measurements for calibration and validation should vastly help improve comparability and confidence in future remote sensing (RS) products.
Remote Sensing users typically have different product requirements compared to those of the ecological and forestry communities. Namely, RS users often (1) need access to AGB estimates at the pixel level, while ecologists and foresters produce area-based estimates derived from individual trees measurements. RS users typically (2) need products at a consistent spatial resolution, while a variety of plot sizes and shapes have been adopted by ecologists and foresters. Finally, RS users (3) require AGB to be computed via globally and regionally consistent routines, while various approaches have been developed to derive AGB estimates from tree measurements. These communities also operate differently from a funding perspective. Most notably, recurrent investments are needed to maintain permanent forest plots – including censuses that temporally match RS data collection – and to ensure field and botanical staff are paid and trained, without whom the data would not be collected. In contrast, RS users typically access data provided by space-borne missions that have already been funded. Despite these differences, there is a clear need to share existing data sets for the benefit of both communities.
#A full list of authors and their affiliations appears at the end of the paper. Correspondence and requests for materials
should be addressed to D.S. (email: [email protected]) Received: 24 January 2019
Accepted: 19 August 2019 Published: xx xx xxxx
Data DEScRIptOR
The Forest Observation System – FOS (http://forest-observation-system.net/) – is an international, collab-orative initiative that aims to establish a global in situ forest AGB database to support Earth Observation (EO) and to encourage investment in relevant field-based measurements and research4. The FOS enables access to high-quality field data by partnering with some of the most well-established teams and networks responsible for managing permanent forest plots globally. In doing so, FOS is benefiting both the RS and ecological/forestry communities while facilitating positive interactions between them.
To this end, the FOS project has established a data sharing policy and framework that seeks to overcome existing barriers between data providers and users. For example, data made available on the FOS website are plot-aggregated (i.e., stand AGB, canopy height, etc.), while the underlying original tree-by-tree data are managed by participating ecological networks. To ensure that estimates added to the FOS are robust and consistent, a freely downloadable BIOMASS R-package5 has been upgraded, which makes the procedure for computing plot AGB estimates from tropical forest inventories transparent, standardized and reproducible. There are developments underway to make the package usable for any forest type, including boreal and temperate ecosystems. This work has been complemented by the definition of a set of technical requirements and standards aimed at ensuring data comparability4.
The FOS currently hosts aggregate data from plots contributed by several existing networks, including: the network of the Center for Tropical Forest Science – Forest Global Earth Observatory (CTFS-ForestGEO)6, the RAINFOR7, AfriTRON8 and T-FORCES9 (curated on the ForestPlots.net platform)10, the IIASA network11,12, the Tropical Managed Forests Observatory (TmFO)13 and AusCover14. These international collaborations have already (i) invested in establishing permanent sampling plots; (ii) proposed robust protocols for accurate tree mapping and measurement, which are largely standardized across networks; (iii) monitored existing plots repeatedly; and (iv) established databases with particular emphasis on data quality control10,15. As the FOS is an open initiative, additional networks (e.g., GFBI16) and teams that comply with the aforementioned criteria are welcome to join in the future.
The data presented here have been partly published before17–21, but never in such a unified and comprehen-sive manner. Results based on some of the plots presented here have impacted a wide range of scientific fields, including tropical forest ecology22–26, drought sensitivity of forests19,27–29, tree allometry30–33, carbon cycles21,34–36, remote sensing18,37–39, climate change8,40–43, biodiversity44–47, diversity-carbon relationships48,49 and historical for-est use50,51, among others.
The online database (http://forest-observation-system.net/) provides open access to the canopy height and biomass estimates as well as information about the plot PIs who have granted access to the data (see Fig. 1 below).
Methods
Within the sample plots, every stem above a defined threshold in diameter at breast height (DBH, usually 1, 5, 7 or 10 cm) was taxonomically identified and the DBH measured, avoiding any buttresses or deformities. In most plots, tree height was measured for a subset of trees that are representative of different diameter classes and tree species in order to develop site-specific height-diameter regression equations. Based on an analysis using the Fig. 1 The Forest-Observation-System.net web portal.
tropical forest plot data, as few as 40 tree height observations are sufficient for characterizing this relationship if stratified by diameter22.
All the data presented here were collected from permanent forest sample plots with known locations; accu-rate coordinates (with an error of less than 30 meters) have been either delivered to the FOS or will be recorded during the next census. Plot sizes are typically 1 ha in area (i.e., the median), but they can vary from 0.25 ha to 50 ha. Large plots are subdivided into 0.25 ha, i.e., 50 × 50 m sub-plots. The FOS consortium made the decision to consider only relatively large and permanent plots in order to reduce errors in georeferencing and to decrease the variability in the measured parameters. Recent research has quantified the effect of spatial resolution on the uncertainties in the AGB estimates, with sampling error dropping from 46.3% for 0.1 ha plots, to 26% and 16.5% for 0.25 ha and 1 ha plots, respectively52. Scaling up from the plot to the landscape level using lidar-derived met-rics, studies have shown decreases in the RMSE for the AGB-lidar models, from 70–90 to 36–51 Mg AGB per ha, when increasing the plot size from 0.25 ha to 1 ha17,53. Clearly there are always size-effort tradeoffs, e.g., smaller plots would permit greater replication, but by focusing on larger plots that are also permanent, FOS has chosen to focus its efforts on a smaller but high-quality set of plots. Our approach, therefore, excludes the possibility of using databases of smaller plots such as those found in national forest inventories.
AGB and associated uncertainties were obtained using a standardized procedure implemented in the BIOMASS R-package5. For the sake of standardization, we systematically considered only trees having a diameter ≥10 cm (or a 5 cm threshold in the case where these trees contribute substantially (>5%) to the total AGB, e.g., in savannas). Taxonomy was first checked using the Taxonomic Name Resolution Service, which in turn served to assign a wood density value to each tree using the Global Wood Density Database (GWDD) as a reference54,55. Species- or genus-level averages were assigned when possible and, if not, the plot-level mean wood density was assigned to each tree species with no known wood density. Tree height was estimated in three different ways. First, when available, subsets of tree height measurements were used to build plot-specific height-diameter rela-tionships, assuming a three-parameter Weibull model5 or a two-parameter Michaelis-Menten model, whichever provided the lowest prediction error. Secondly, the regional height-diameter models proposed by Feldpausch et
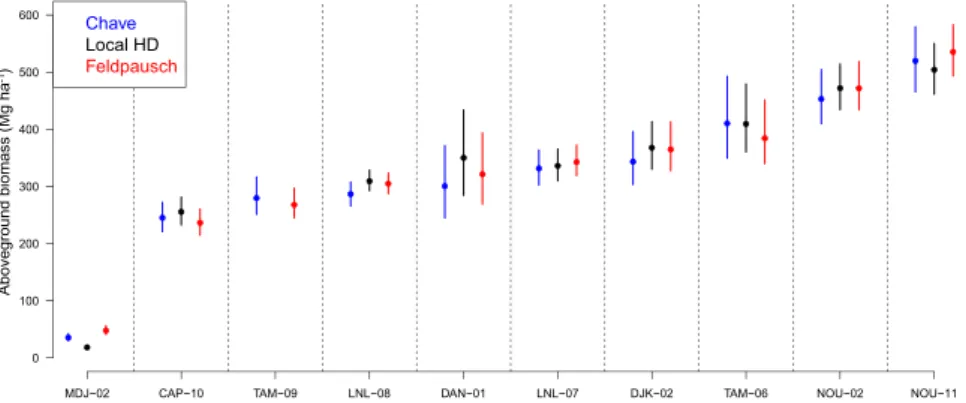
al.31 were used to infer tree height. Finally, height was implicitly taken into consideration in the AGB calculation through the use of the bioclimatic predictor E proposed by Chave et al.30. Equation 7 of Chave et al.30 was used in this case while the generalized allometric model equation 4 was used otherwise (where heights were derived from local or Feldpausch height-diameter relationships). Among the three approaches, the use of a local HD model is the most accurate. However, local height measurements are not systematically available for all plots. The Chave
et al. (2014) and Feldpausch et al. (2012) approaches are both an alternative to the use of a local HD model but
independent validation (e.g., Fig. 2) has shown that their relative performance varies among locations. Thus, the most conservative approach is to provide the three estimates so that the uncertainty associated with the HD relationship can be assessed.
Errors associated with each of these steps (i.e., DBH measurement, wood density, tree height) were propagated through a Monte Carlo scheme to provide mean AGB estimates with associated credibility intervals (Fig. 2).
Boreal and temperate plots (representing 11% of the total number of sub-plots) were processed manually using similar steps. Species-specific allometric equations56 allowed the stem volume to be estimated based on the height and DBH measurements. Biomass conversion and expansion factors57 were used to estimate AGB from the stem volume taking the tree age, site index and stocking into account. The next version of the BIOMASS R-package will be capable of processing boreal and temperate data in addition to tropical.
Data Records
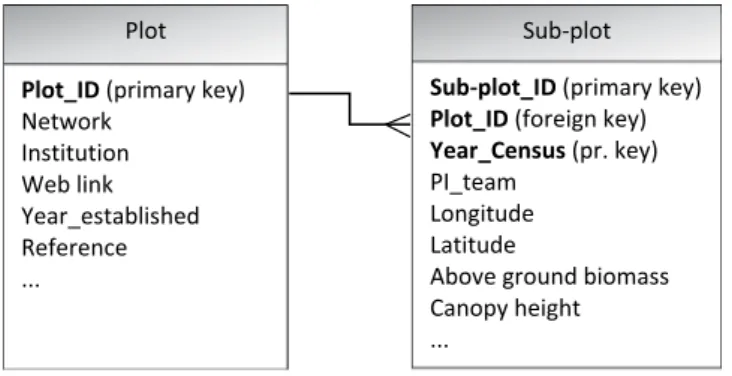
The data in FOS58 are organized in a hierarchical structure (Fig. 3). The Plot description includes a link to the institution and network. The central part of the database is the Sub-plot table, where geolocation, the date of the census, the people who manage the specific plots, the AGB and the canopy height are stored.
The FOS does not store individual tree-level information, only plot-level aggregates. Users interested in tree-level information can contact the contributing networks or the plot PIs using the links provided in the Plot table. Fig. 2 An example of the AGB estimation with the BIOMASS R-package. MDJ-02, CAP-10 and other indexes on the horizontal axis are Plot IDs. The vertical axis is AGB in Mg ha−1 and the error bar represents the
The details of the fields found in the two linked tables of Fig. 3 are provided below. Plot description
• Plot_ID – unique plot ID
• Country_Name – Name of the country
• Network – the name of the network (e.g., RAINFOR) • Institution – the institution that carried out the measurements • Link – web link to the data provider
• Year_established – the year when the plot was established • Reference – a reference to the publications
• Other_measurements – list of parameters measured on the plot
• Biomass_processing_protocol – file name of the biomass processing protocol (available at Data Package 1), which contains the R code, the variables assigned and the intermediate results.
Sub-plot description
• Sub-plot_ID – unique sub-plot ID • Plot_ID – link to the Plot description table • Year_census – year of the census
• PI_team – List of Principal Investigator(s) • Lat_cnt – Latitude of the center of the plot • Long_cnt – Longitude of the center of the plot • Altitude (m a.s.l.)
• Slope (degree) • Plot_area (ha)
• Plot_shape (e.g., rectangle, circle, plus dimensions)
• Forest_status – forest description, including age, successional stage, disturbances, etc. • Min_DBH – Minimum diameter of trees at breast height included in the census (cm) • H_Lorey – Lorey’s height, DBH-weighted mean tree height (m)
• Hlor local – mean height estimated from local H = f(DBH) curve (m)
• Hlor Chave – mean height estimated from the curve by Chave30 (m)
• Hlor Feldpausch – mean height estimated from the curve by Feldpausch31 (m)
• H_max – height of the tallest tree (m)
• Hmax local – tallest tree measured or estimated from local H = f(DBH) curve (m)
• Hmax Chave – maximum height estimated from the curve by Chave (m)
• Hmax Feldpausch – maximum height estimated from the curve by Feldpausch (m)
• AGB – Above ground biomass (Mg ha−1)
• AGB_local – aboveground biomass (Mg ha−1) estimated using local equations or equation 4 in Chave30 with wood density, DBH and H derived from local height-diameter relationships.
• Cred_2.5 – lower bound of 95% credibility interval (Mg ha−1)
• Cred_97.5– upper bound of 95% credibility interval (Mg ha−1)
• AGB_Feldpausch – AGB (Mg ha−1) using equation 4 in Chave30 with wood density, DBH and H derived from Feldpausch31 height-diameter relationship.
• Cred_2.5 – lower bound of 95% credibility interval (Mg ha−1)
• Cred_97.5 – upper bound of 95% credibility interval (Mg ha−1)
• AGB_Chave – aboveground biomass (in Mg ha−1) estimated using equation 7 in Chave30 with wood density, DBH and H implicitly taken into consideration through the use of the bioclimatic predictor E
• Cred_2.5 – lower bound of 95% credibility interval (Mg ha−1)
• Cred_97.5 – upper bound of 95% credibility interval (Mg ha−1)
• Wood_density - mean wood density of the trees (g cm−3)
• GSV – growing stock volume (m3 ha−1)
• BA – basal area (m2 ha−1)
• Ndens – number of trees per hectare
Note that we have merged the Plot and Sub-plot tables in the data package associated with this paper58 for the user’s convenience.
technical Validation
The key predictive variables of AGB are tree dimensions (primarily diameter and height) and taxonomic identity, which is responsible for explaining most tree-to-tree variations through interspecific wood density variations59. The procedures for ensuring the quality of the data collected are as follows:
(1) On-site measurement accuracy. To ensure diameter accuracy and consistency among and within censuses, field teams follow standard forest inventory protocols for the correct choice of the Point of measurement (POM). For example, the RAINFOR protocol for tropical forests60 records each POM by painting the location on each tree to ensure that subsequent measurements can be performed at the same point. For tree height, the consistency of the height measurement is ensured by having a designated, trained operator who works at multiple sites using the same instrument. At some sites, double measurements of height (from different positions) have been carried out, and mean values have been used as the height of the individual trees. For species identification, the reliability in highly diverse tropical plots is important; hence, the tree and plot AGB is estimated by taking the species-level variability in wood density into account61. This is supported by collecting botanical vouchers from every taxon (or potential taxon) in the field. In many cases, these vouchers have been deposited in recognized regional herbaria, identified by botanical experts, and where possible, made available electronically (e.g., via ForestPlots.net). However, voucher collection is not currently a standard protocol for every plot in the FOS.
(2) Multiple censusing. By working primarily with re-censused permanent plots rather than single census plots, we have ensured that the uncertainties are reduced because almost every tree has been measured at least twice by the time of the focal census, thus providing the opportunity to correct any errors that may have been made previously, through the identification of spurious values. Repeat censuses also provide more opportunities to improve species identification by increasing the chance of encountering fertile material (see the next step).
(3) Post fieldwork data processing, e.g., by identifying trees to species level. Species identification can be extremely challenging in tropical forests due to their diversity and the fact that most trees lack flowers or fruits when inventoried. Botanical identity is a key control on the AGB through its effect on wood density. To explore the reliability of identification in some of the most diverse RAINFOR sites in western Amazo-nia, PIs have separated the tree species assemblages into several larger taxonomic groups. As reported by Baker et al.62, taxonomic specialists for each group have then assessed the accuracy of the species identi-fications of the herbarium collections using 18 different botanists across 60 plots during the past 30 years. Overall, even in taxonomically difficult groups where species are often very rare, 75% of tree species were correctly identified.
(4) Common protocols for potential error detection. These protocols have been developed by contributing net-works, e.g., by flagging trees for attention that have declined by more than 5 mm in diameter. This allows trees to be detected that have shrunk between two censuses, and whether that individual is dead/rotten. Potential issues are flagged in order to be checked against existing field notes, and during the following census. Thus, as mentioned previously, repeat censuses provide more opportunities to improve data quality as compared to single-census plots.
(5) Within-network collaboration. Data quality is further enhanced through the exchange of ideas between experts at different sites and between nations, through the use of common data analysis protocols (i.e., allometric equations, R packages, etc.), and by promoting shared publications.
(6) Cross-network collaboration. In the FOS, by applying a uniform R script for data aggregation and AGB estimation, potential biases from using different height-diameter, wood density and allometric relations are strongly reduced.
The distribution of FOS plots by continent is presented in Table 1. Africa, Europe and South America are rep-resented by similar numbers of locations (i.e., 62–80 plots) and contribute more than 80% of the plots at the time of publication, but in terms of coverage, South America alone comprises 49% of the forest area covered.
The IIASA network provides the highest number of plot locations to FOS (Table 2), while the TmFO network contributes the most in terms of areal coverage.
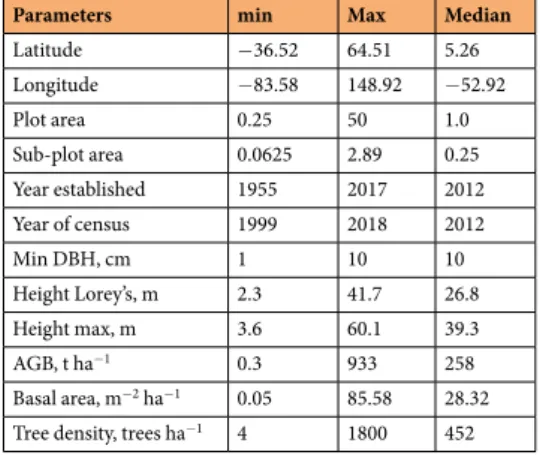
The range of values of major forest parameters represented in the FOS database is shown in Table 3. The max-imum AGB value (918 Mg ha−1) and canopy height (41.7 m) at a 0.25 ha sub-plot were recorded in Lopé, Gabon.
Some savannah sub-plots (e.g., in Gabon) have a few or no trees >5 cm dbh, which leads to low or no biomass estimation. The tallest trees (60.1 m) was found in Costa Rica and the maximum basal area (85.6 m2 ha−1) was
found in the Caucasus, Russia.
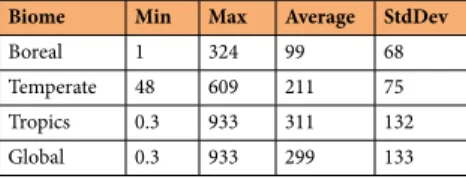
Table 4 contains information about the AGB for different biomes and globally. As expected, the average AGB increases from boreal to temperate and then from temperate to tropical forests.
Usage Notes
This data set will be essential for validating and calibrating satellite observations and forest biometric models. The focus is to provide ground support for current and planned space-borne missions, such as NASA GEDI (https:// gedi.umd.edu/), NASA-ISRO NISAR (https://nisar.jpl.nasa.gov/), JAXA ALOS PALSAR (http://global.jaxa.jp/ projects/sat/alos/) and ESA BIOMASS (https://earth.esa.int/web/guest/missions/esa-future-missions/biomass), which are aimed at retrieving forest structure parameters such as forest height and biomass.
Continent/regions Number of plots Number of sub-plots Area (ha)
Africa 62 338 85 Asia 29 46 20 Australia 4 4 3 Central America 21 278 69 Europe 80 146 42 South America 78 833 209 Total 274 1645 428
Table 1. Distribution of records by continents (as of December 2018).
Network Number of plots Number of sub-plots Area, ha
AfriTRON 46 178 45 AusCover 4 4 3 CTFS-ForestGEO 2 300 75 IIASA 126 258 78 RAINFOR 52 288 72 T-Forces 3 12 3 TmFO 17 500 125 Unaffiliated to network 24 105 27 Total 274 1645 428
Table 2. The distribution of records by participating networks (as of December 2018).
Parameters min Max Median
Latitude −36.52 64.51 5.26 Longitude −83.58 148.92 −52.92 Plot area 0.25 50 1.0 Sub-plot area 0.0625 2.89 0.25 Year established 1955 2017 2012 Year of census 1999 2018 2012 Min DBH, cm 1 10 10 Height Lorey’s, m 2.3 41.7 26.8 Height max, m 3.6 60.1 39.3 AGB, t ha−1 0.3 933 258 Basal area, m−2 ha−1 0.05 85.58 28.32
Tree density, trees ha−1 4 1800 452
At this stage, we are making no claims regarding the statistical robustness of the FOS data set for global or regional biomass estimations. Instead our aim is to present uniformly processed data on forest biomass from available locations (see Table 1). One of the main goals of the FOS is to highlight gaps in the observations.
Using sub-plot data for validation of RS data might lead to spatial autocorrelation problems so possi-ble solutions would be to use a plot average, use only values from the plot or test for the presence of spatial autocorrelation.
This data package contains geographical coordinates rounded to 2 digits after decimal point (up to 1 km at equator). The most up-to-date extended data set with accurate geolocation is available in the FOS portal: https:// forest-observation-system.net/
The FOS initiative depends on the contributions of high-quality forest plot data from participating networks. The fair use of the data presented here requires respecting the efforts and rights of the partners and supporting the long-term future of these observational efforts. The data set will be licensed under a Creative Commons Attribution 4.0 International License (CC-BY 4.0), which means that it will be fully open even for commercial use but requires acknowledgment of the PIs and plot owners. We would also appreciate that all users of the FOS data either share their own data via the FOS, and/or commit to collaboratively funding new censuses and the expansion of existing plot networks.
code availability
The BIOMASS R-package is an open source library available from the CRAN R repository. The development version is publicly available and can be found on the GitHub platform at: https://github.com/AMAP-dev/ BIOMASS. Furthermore, the BIOMASS R-package is accompanied by an open access paper describing the functionality in more detail5.
References
1. Bojinski, S. et al. The Concept of Essential Climate Variables in Support of Climate Research, Applications, and Policy. Bull. Am.
Meteorol. Soc. 95, 1431–1443 (2014).
2. Pereira, H. M. et al. Essential Biodiversity Variables. Science 339, 277–278 (2013).
3. Schepaschenko, D. et al. Global biomass information: from data generation to application. In Handbook of Clean Energy Systems 1, 11–33 (Wiley, 2015).
4. Chave, J. et al. Ground data are essential for biomass remote sensing missions. Surv. Geophys. https://doi.org/10.1007/s10712-019-09528-w (2019).
5. Réjou-Méchain, M., Tanguy, A., Piponiot, C., Chave, J. & Hérault, B. biomass: an r package for estimating above-ground biomass and its uncertainty in tropical forests. Methods Ecol. Evol, https://doi.org/10.1111/2041-210X.12753 (2017).
6. Anderson‐Teixeira, K. J. et al. CTFS-ForestGEO: a worldwide network monitoring forests in an era of global change. Glob. Change
Biol. 21, 528–549 (2015).
7. Malhi, Y. et al. An international network to monitor the structure, composition and dynamics of Amazonian forests (RAINFOR). J.
Veg. Sci. 13, 439–450 (2002).
8. Lewis, S. L. et al. Increasing carbon storage in intact African tropical forests. Nature 457, 1003–1006 (2009).
9. Qie, L. et al. Long-term carbon sink in Borneo’s forests halted by drought and vulnerable to edge effects. Nat. Commun. 8, 1966 (2017).
10. Lopez‐Gonzalez, G., Lewis, S. L., Burkitt, M. & Phillips, O. L. ForestPlots.net: a web application and research tool to manage and analyse tropical forest plot data. J. Veg. Sci 22, 610–613 (2011).
11. Schepaschenko, D. et al. A dataset of forest biomass structure for Eurasia. Sci. Data 4, 201770 (2017).
12. Pietsch, S. A. Modelling ecosystem pools and fluxes. Implementation and application of biogeochemical ecosystem models. (BOKU, 2014).
13. Sist, P. et al. The Tropical managed Forests Observatory: a research network addressing the future of tropical logged forests. Appl.
Veg. Sci. 18, 171–174 (2015).
14. TERN Auscover. Biomass Plot Library - National collation of tree and shrub inventory data, allometric model predictions of above and
below-ground biomass, Australia. Made available by the AusCover facility of the Terrestrial Ecosystem Research Network (TERN)
(2016).
15. Condit, R. S. et al. Tropical forest dynamics across a rainfall gradient and the impact of an El Niño dry season. J. Trop. Ecol. 20, 51–72 (2004).
16. Liang, J. et al. Positive biodiversity-productivity relationship predominant in global forests. Science 354, 196 (2016).
17. Labrière, N. et al. In situ reference datasets from the TropiSAR and AfriSAR campaigns in support of upcoming spaceborne biomass missions. IEEE J. Sel. Top. Appl. Earth Obs. Remote Sens. 11, 3617–3627 (2018).
18. Taylor, P. et al. Landscape-scale controls on aboveground forest carbon stocks on the Osa peninsula, Costa Rica. PLOS ONE 10, e0126748 (2015).
19. Hofhansl, F. et al. Sensitivity of tropical forest aboveground productivity to climate anomalies in SW Costa Rica. Glob. Biogeochem.
Cycles 28, 1437–1454 (2014).
20. Piponiot, C. et al. Carbon recovery dynamics following disturbance by selective logging in Amazonian forests. eLife 5, e21394 (2016).
Biome Min Max Average StdDev
Boreal 1 324 99 68
Temperate 48 609 211 75 Tropics 0.3 933 311 132
Global 0.3 933 299 133
Table 4. The distribution of aboveground biomass data (t ha−1) by biome in the FOS database (as of December
21. Lewis Simon, L. et al. Above-ground biomass and structure of 260 African tropical forests. Philos. Trans. R. Soc. B Biol. Sci. 368, 20120295 (2013).
22. Sullivan, M. J. P. et al. Field methods for sampling tree height for tropical forest biomass estimation. Methods Ecol. Evol. 9, 1179–1189 (2018).
23. ter Steege, H. et al. Hyperdominance in the Amazonian tree flora. Science 342, 1243092 (2013).
24. Baker, T. R. et al. Fast demographic traits promote high diversification rates of Amazonian trees. Ecol. Lett. 17, 527–536 (2014). 25. Johnson, M. O. et al. Variation in stem mortality rates determines patterns of above-ground biomass in Amazonian forests:
implications for dynamic global vegetation models. Glob. Change Biol. 22, 3996–4013 (2016).
26. Aguirre‐Gutiérrez, J. et al. Drier tropical forests are susceptible to functional changes in response to a long-term drought. Ecol. Lett. 22, 855–865 (2019).
27. Phillips, O. L. et al. Drought Sensitivity of the Amazon Rainforest. Science 323, 1344–1347 (2009).
28. Esquivel‐Muelbert, A. et al. Seasonal drought limits tree species across the Neotropics. Ecography 40, 618–629 (2017). 29. Feldpausch, T. R. et al. Amazon forest response to repeated droughts. Glob. Biogeochem. Cycles 30, 964–982 (2016).
30. Chave, J. et al. Improved allometric models to estimate the aboveground biomass of tropical trees. Glob. Change Biol. 20, 3177–3190 (2014).
31. Feldpausch, T. R. et al. Tree height integrated into pantropical forest biomass estimates. Biogeosciences 9, 3381–3403 (2012). 32. Bastin, J.-F. et al. Pan-tropical prediction of forest structure from the largest trees. Glob. Ecol. Biogeogr. 27, 1366–1383 (2018). 33. Feldpausch, T. R. et al. Height-diameter allometry of tropical forest trees. Biogeosciences 8, 1081–1106 (2011).
34. Phillips, O. L. Changes in the Carbon Balance of Tropical Forests: Evidence from Long-Term Plots. Science 282, 439–442 (1998). 35. Slik, J. W. F. et al. Large trees drive forest aboveground biomass variation in moist lowland forests across the tropics. Glob. Ecol.
Biogeogr. 22, 1261–1271 (2013).
36. Hubau, W. et al. The persistence of carbon in the African forest understory. Nat. Plants 5, 133 (2019).
37. Mitchard, E. T. A. et al. Markedly divergent estimates of Amazon forest carbon density from ground plots and satellites. Glob. Ecol.
Biogeogr. 23, 935–946 (2014).
38. Santoro, M. et al. Forest growing stock volume of the northern hemisphere: Spatially explicit estimates for 2010 derived from Envisat ASAR. Remote Sens. Environ. 168, 316–334 (2015).
39. Valbuena, R. et al. Enhancing of accuracy assessment for forest above-ground biomass estimates obtained from remote sensing via hypothesis testing and overfitting evaluation. Ecol. Model. 366, 15–26 (2017).
40. Thomas, C. D. et al. Extinction risk fromclimate change. Nature 427, 145–148 (2004).
41. Esquivel‐Muelbert, A. et al. Compositional response of Amazon forests to climate change. Glob. Change Biol. 25, 39–56 (2019). 42. Brienen, R. J. W. et al. Long-term decline of the Amazon carbon sink. Nature 519, 344–348 (2015).
43. Pan, Y. et al. A large and persistent carbon sink in the world’s forests. Science 333, 988–993 (2011).
44. Phillips, O. L., Hall, P., Gentry, A. H., Sawyer, S. A. & Vásquez, R. Dynamics and species richness of tropical rain forests. Proc. Natl.
Acad. Sci. 91, 2805–2809 (1994).
45. de Souza, F. C. et al. Evolutionary heritage influences Amazon tree ecology. Proc R Soc B 283, 20161587 (2016). 46. Coronado, E. N. H. et al. Phylogenetic diversity of Amazonian tree communities. Divers. Distrib. 21, 1295–1307 (2015).
47. ter Steege, H. et al. Estimating the global conservation status of more than 15,000 Amazonian tree species. Sci. Adv. 1, e1500936 (2015).
48. Sullivan, M. J. P. et al. Diversity and carbon storage across the tropical forest biome. Sci. Rep. 7, 39102 (2017). 49. Fauset, S. et al. Hyperdominance in Amazonian forest carbon cycling. Nat. Commun. 6, 6857 (2015).
50. Levis, C. et al. Persistent effects of pre-Columbian plant domestication on Amazonian forest composition. Science 355, 925–931 (2017).
51. Willcock, S. et al. Land cover change and carbon emissions over 100 years in an African biodiversity hotspot. Glob. Change Biol. 22, 2787–2800 (2016).
52. Réjou-Méchain, M. et al. Local spatial structure of forest biomass and its consequences for remote sensing of carbon stocks.
Biogeosciences 11, 6827–6840 (2014).
53. Knapp, N., Fischer, R. & Huth, A. Linking lidar and forest modeling to assess biomass estimation across scales and disturbance states. Remote Sens. Environ. 205, 199–209 (2018).
54. Chave, J. et al. Towards a worldwide wood economics spectrum. Ecol. Lett. 12, 351–366 (2009).
55. Zanne, A. E. et al. Global Wood Density Database. Dryad Digital Repository, https://doi.org/10.5061/dryad.234/1 (2009). 56. Zagreev, V. V. et al. All-Union regulations for forest mensuration. (Kolos, 1992).
57. Schepaschenko, D. et al. Improved estimates of biomass expansion factors for Russian forests. Forests 9, 312 (2018).
58. Schepaschenko, D. et al. A global reference dataset for remote sensing of forest biomass. The Forest Observation System approach.
IIASA, https://doi.org/10.22022/ESM/03-2019.38 (2019).
59. Baker, T. R. et al. Variation in wood density determines spatial patterns in Amazonian forest biomass. Glob. Change Biol. 10, 545–562 (2004).
60. Marthews, T. R. et al. Measuring tropical forest carbon allocation and cycling: A RAINFOR-GEM field manual for intensive census plots
(v 3.0). Manual. (Global Ecosystems Monitoring network, 2014).
61. Phillips, O. L. et al. Species matter: wood density influences tropical forest biomass at multiple scales. Surv. Geophys. https://doi. org/10.1007/s10712-019-09540-0 (2019).
62. Baker, T. R. et al. Maximising synergy among tropical plant systematists, ecologists, and evolutionary biologists. Trends Ecol. Evol. 32, 258–267 (2017).
acknowledgements
This study has been partly supported by the IFBN (4000114425/15/NL/FF/gp) and CCI Biomass (4000123662/18/I-NB) projects funded by ESA; the Austrian Federal Ministry of Science and Research (BMWF-4.409/30-II/4/2009); the Austrian Academy of Sciences (ÖAW2007-11); the Research Project AGL2009-08562, Ministry of Science’s Research and Development, Spain; the Project LIFE+ “ForBioSensing PL Comprehensive monitoring of stand dynamics in Białowieża Forest supported with remote sensing techniques” cofounded by Life+ UE program (contract number LIFE13 ENV/PL/000048) and The National Fund for Environmental Protection and Water Management in Poland (contract number 485/2014/WN10/OP-NM-LF/D); the Brazilian National Council of Science and Technology (PVE project #401279/2014-6 and PELD (LTER) project #441244/2016-5); USAID (1993–2006); Brazilian National Council of Science and Technology-CNPq (Processes 481097/2008-2, 201138/2012-3); Foundation for Research Support of the State of Sao Paulo-FAPESP (Processes 2013/16262-4, 2013/50718-5). European Research Council Advanced Grant T-FORCES (291585); the Russian State Assignment of the CEPF RAS no. АААА-А18-118052400130-7. The Russian Science Foundation supported data processing of the plot data from Russia (project no. 19-77-30015). We would like to thank Shell Gabon and the Smithsonian Conservation Biology Institute for funding the collection of the RABI data (contribution
No 172 of the Gabon Biodiversity Program). We would also like to thank Alexander Parada Gutierrez, Javier Eduardo Silva-Espejo, Jon Lloyd, and Olaf Banki for sharing their plot data. JC is funded by Agence Nationale de la Recherche (CEBA, ref. ANR-10-LABX-25-01; TULIP: ANR-10-LABX-0041).
author contributions
The co-authors have contributed with their own data and are indicated as principal investigators in the plot table58. Stuart Davies, Simon Lewis, Oliver Phillips, Plinio Sist and Dmitry Schepaschenko are coordinating
contributing networks and have managed the process of providing specific plot data to the FOS. Maxime Méchain, Jérôme Chave and Bruno Hérault have developed the R BIOMASS package. Maxime Réjou-Méchain and Nicolas Labrière have processed the initial tree-level data to the plot-level, as presented in the paper. Christoph Perger and Christopher Dresel developed the database structure and the web interface for the FOS. Dmitry Schepaschenko, Jérôme Chave, Oliver Phillips, Simon Lewis, Maxime Réjou-Méchain have written the paper. Edits and suggestions for improvements were provided by Nicolas Labrière, Bruno Herault, Florian Hofhansl, Klaus Scipal, Steffen Fritz, Linda See, Sylvie Gourlet-Fleury, Géraldine Derroire, Ted R. Feldpausch, Ruben Valbuena, Krzysztof Stereńczak, Plinio Sist and Wolfgang Wanek. All remaining authors have contributed data to the FOS.
additional Information
Competing Interests: The authors declare no competing interests.
Publisher’s note Springer Nature remains neutral with regard to jurisdictional claims in published maps and
institutional affiliations.
Open Access This article is licensed under a Creative Commons Attribution 4.0 International
License, which permits use, sharing, adaptation, distribution and reproduction in any medium or format, as long as you give appropriate credit to the original author(s) and the source, provide a link to the Cre-ative Commons license, and indicate if changes were made. The images or other third party material in this article are included in the article’s Creative Commons license, unless indicated otherwise in a credit line to the material. If material is not included in the article’s Creative Commons license and your intended use is not per-mitted by statutory regulation or exceeds the perper-mitted use, you will need to obtain permission directly from the copyright holder. To view a copy of this license, visit http://creativecommons.org/licenses/by/4.0/.
The Creative Commons Public Domain Dedication waiver http://creativecommons.org/publicdomain/zero/1.0/
applies to the metadata files associated with this article. © The Author(s) 2019
Dmitry Schepaschenko
1,2, Jérôme chave
3, Oliver L. phillips
4, Simon L. Lewis
4,5,
Stuart J. Davies
6, Maxime Réjou-Méchain
7, plinio Sist
8,9, Klaus Scipal
10, christoph perger
1,11,
Bruno Herault
8,9,83, Nicolas Labrière
3, Florian Hofhansl
1, Kofi Affum-Baffoe
12,
alexei aleinikov
13, alfonso alonso
14, christian amani
15, alejandro araujo-Murakami
16,
John armston
17,18, Luzmila arroyo
19, Nataly ascarrunz
20, celso azevedo
21, timothy Baker
4,
Radomir Bałazy
22, caroline Bedeau
24, Nicholas Berry
25, andrii M. Bilous
26,
Svitlana Yu. Bilous
26, pulchérie Bissiengou
27, Lilian Blanc
8,9, Kapitolina S. Bobkova
28,
tatyana Braslavskaya
13, Roel Brienen
4, David F. R. p. Burslem
29, Richard condit
38,
aida cuni-Sanchez
31, Dilshad Danilina
32, Dennis del castillo torres
33, Géraldine Derroire
35,
Laurent Descroix
24, Eleneide Doff Sotta
36, Marcus V. N. d’Oliveira
37, christopher Dresel
1,11,
terry Erwin
39, Mikhail D. Evdokimenko
32, Jan Falck
40, ted R. Feldpausch
41, Ernest G. Foli
42, Robin Foster
43, Steffen Fritz
1, antonio Damian Garcia-abril
44, aleksey Gornov
13,
Maria Gornova
13, Ernest Gothard-Bassébé
45, Sylvie Gourlet-Fleury
8,9, Marcelino Guedes
36,
Keith c. Hamer
46, Farida Herry Susanty
47, Niro Higuchi
48, Eurídice N. Honorio coronado
33,
Wannes Hubau
4,34, Stephen Hubbell
49, Ulrik Ilstedt
40, Viktor V. Ivanov
32,
Milton Kanashiro
50, anders Karlsson
40, Viktor N. Karminov
13, timothy Killeen
51, Jean-claude
Konan Koffi
52, Maria Konovalova
32, Florian Kraxner
1, Jan Krejza
53, Haruni Krisnawati
47,
Leonid V. Krivobokov
32, Mikhail a. Kuznetsov
28, Ivan Lakyda
26, petro I. Lakyda
26,
Juan carlos Licona
20, Richard M. Lucas
54, Natalia Lukina
13, Daniel Lussetti
40, Yadvinder Malhi
55, José antonio Manzanera
44, Beatriz Marimon
56, Ben Hur Marimon Junior
56,
Rodolfo Vasquez Martinez
57, Olga V. Martynenko
58, Maksym Matsala
26, Raisa K. Matyashuk
59,
Lucas Mazzei
50, Hervé Memiaghe
60, casimiro Mendoza
61, abel Monteagudo Mendoza
57,
Olga V. Moroziuk
26, Liudmila Mukhortova
32, Samsudin Musa
62, Dina I. Nazimova
32,
toshinori Okuda
63, Luis claudio Oliveira
37, petr V. Ontikov
2, andrey F. Osipov
28,
Kenneth Rodney
66, andes H. Rozak
67, ademir Ruschel
50, Ervan Rutishauser
30,
Linda See
1, Maria Shchepashchenko
58, Nikolay Shevchenko
13, anatoly Shvidenko
1,32,
Marcos Silveira
68, James Singh
69, Bonaventure Sonké
70, cintia Souza
21, Krzysztof Stereńczak
22, Leonid Stonozhenko
58, Martin J p Sullivan
4, Justyna Szatniewska
53,
Hermann taedoumg
70,71, Hans ter Steege
23, Elena tikhonova
13, Marisol toledo
19,
Olga V. Trefilova
32, Ruben Valbuena
72, Luis Valenzuela Gamarra
57, Sergey Vasiliev
2,
Estella F. Vedrova
32, Sergey V. Verhovets
73,84, Edson Vidal
74, Nadezhda a. Vladimirova
75,
Jason Vleminckx
76, Vincent a. Vos
77, Foma K. Vozmitel
2, Wolfgang Wanek
78, thales a. p. West
79, Hannsjorg Woell
80, John t. Woods
81, Verginia Wortel
64,
toshihiro Yamada
63, Zamah Shari Nur Hajar
82& Irié casimir Zo-Bi
831Ecosystems Services and Management Program, International Institute for Applied Systems Analysis, Laxenburg,
A-2361, Austria. 2Forestry faculty, Bauman Moscow State Technical University, Mytischi, 141005, Russia. 3Laboratoire Evolution et Diversité Biologique CNRS/Université Paul Sabatier, Toulouse, France. 4School of
Geography, University of Leeds, Leeds, LS2 9JT, UK. 5University College London, 30 Guilford Street, London, WC1N
1EH, UK. 6Forest Global Earth Observatory, Smithsonian Tropical Research Institute, P.O. Box 37012, Washington
20013, USA. 7AMAP, IRD, CNRS, CIRAD, INRA, University Montpellier, Montpellier, France. 8CIRAD, Forêts et
Sociétés, Campus International de Baillarguet, Montpellier, F-34398, France. 9Forêts et Sociétés, Univ Montpellier,
CIRAD, Montpellier, F-34398, France. 10European Space Agency, ESTEC, Noordwijk, The Netherlands. 11Spatial
Focus GmbH, Vienna, Austria. 12Mensuration Unit, Forestry Commission of Ghana, 4 Third Avenue Ridge, Kumasi,
POB M434, Ghana. 13Center of Forest Ecology and Productivity of the Russian Academy of Sciences, Profsoyuznaya
84/32/14, Moscow, 117997, Russia. 14Smithsonian Conservation Biology Institute, 1100 Jefferson Dr SW, Suite 3123,
Washington, DC, 20560-0705, USA. 15Centre for International Forestry Research, CIFOR, Jalan CIFOR, Situ Gede,
Bogor, 16115, Indonesia. 16Universidad Autonoma Gabriel Rene Moreno, Santa Cruz, Bolivia. 17Department of
Geographical Sciences, University of Maryland, 2181 Lefrak Hall, College Park, MD, 20742, USA. 18Joint Remote
Sensing Research Program, School of Earth and Environmental Sciences, University of Queensland, Chamberlain Building (35), Campbell Road, St Lucia Campus, Brisbane, 4072, Australia. 19Museo de Historia Natural Noel Kempff
Mercado, Universidad Autónoma Gabriel Rene Moreno Av. Irala 565 - casilla, 2489, Santa Cruz, Bolivia. 20IBIF,
Instituto Boliviano de Investigacion Forestal, Av. 6 de agosto # 28, Km 14 doble via La Guardia, Santa Cruz, Casilla, 6204, Bolivia. 21Embrapa, Rodovia AM 10, km 29, Manaus, AM, 69010-970, Brazil. 22Forest Research Institute,
Department of Geomatics, Braci Leśnej 3, Sękocin Stary, Raszyn, 05-090, Poland. 23Naturalis Biodiversity Center,
Leiden, The Netherlands. 24ONF, ONF-Réserve de Montabo Cayenne Cedex, Cayenne, BP 7002; 97307, French
Guiana. 25The Landscapes and Livelihoods Group, 20 Chambers St, Edinburgh, EH1 1JZ, UK. 26National University of
Life and Environmental Sciences of Ukraine, General Rodimtsev 19, Kyiv, 3041, Ukraine. 27Herbier National du Gabon
(IPHAMETRA), B.P 1165, Libreville, Gabon. 28Institute of Biology, Komi Scientific Center, Ural Branch of Russian
Academy of Sciences, Kommunisticheskaya 28, Syktyvkar, 167982, Russia. 29School of Biological Sciences,
University of Aberdeen, Cruickshank Building, St Machar Drive, Aberdeen, AB24 3UU, UK. 30Smithsonian Tropical
Research Institute, Balboa, Ancon, Panama 3092, Panama. 31Department of Environment and Geography, University
of York, Heslington, York, YO10 5NG, UK. 32V.N. Sukachev Institute of Forest, Siberian Branch of the Russian Academy
of Science, Academgorodok 50(28), Krasnoyarsk, 660036, Russia. 33Instituto de Investigaciones de la Amazonía
Peruana, Av. Abelardo Quiñones km 2.5, Iquitos, Apartado Postal 784, Peru. 34U Gent-Woodlab, Laboratory of Wood
Technology, Department of Environment, Ghent University, Ghent, 9000, Belgium. 35CIRAD, UMR EcoFoG, Campus
Agronomique - BP 701, Kourou, 97387, France, French Guiana. 36Embrapa, Rodovia Juscelino Kubitscheck, Km 5, no
2.600, Macapa, Caixa Postal 10, CEP: 68903-419, Brazil. 37Embrapa, BR 364, Caixa postal 321, Rio Branco, CEP
69.900-970, Brazil. 38Morton Arboretum, 4100 Illinois Rte. 53, Lisle, 60532, IL, USA. 39SI Entomology, Smithsonian
Institution, PO Box 37012, MRC 187, Washington, DC, DC 20013-7012, USA. 40Department Forest Ecology and
Management, The Swedish University of Agricultural Sciences, SLU, Umeå, SE-901 83, Sweden. 41Geography,
College of Life and Environmental Sciences, University of Exeter,Laver Building, North Park Road, Exeter, EX4 4QE, UK. 42Forestry Research Institute of Ghana, UP Box 63, KNUST, Kumasi, Ghana. 43The Field Musium, 1400S Lake
Shore Dr, Chicago, IL, 60605, USA. 44Universidad Politecnica de Madrid, Calle Ramiro de Maeztu, 7, Madrid, 28040,
Spain. 45Institut Centrafricain de Recherche Agronomique, ICRA, BP 122, Bangui, Central African Republic. 46School
of Biology, University of Leeds, Leeds, LS2 9JT, UK. 47FOERDIA, Forestry and Environment Research Development
and Innovation Agency, Jalan Gunung Batu No 5, Bogor, 16610, Indonesia. 48Instituto Nacional de Pesquisas da
Amazônia - Coordenação de Pesquisas em Silvicultura Tropical, Manaus, 69060-001, Brazil. 49Department of Ecology
and Evolutionary Biology, University of California, 621 Charles E. Young Dr. South, Los Angeles, CA, 90095-1606, USA. 50Embrapa Amazonia Oriental, Travessa Doutor Enéas Pinheiro, Belém, PA, 66095-903, Brazil. 51World Wildlife
Fund, Calle Diego de Mendoza 299, Santa Cruz de la Sierra, Bolivia. 52Sodefor, boulevard François Mitterrand,
Cocody, Abidjan, 01BP 3770, Côte d’Ivoire. 53Global Change Research Institute CAS, Bělidla 986/4a, Brno, 603 00,
Czech Republic. 54Department of Geography and Earth Sciences, Aberystwyth University, Aberystwyth, SY23 3DB,
UK. 55School of Geography and the Environment, University of Oxford, Oxford, OX1 3QY, UK. 56Laboratório de
Ecologia Vegetal, Universidade do Estado de Mato Grosso, UNEMAT, Campus de Nova Xavantina, Nova Xavantina, Mato Grosso, 78.690-000, Brazil. 57Jardín Botánico de Missouri; Universidad Nacional de San Antonio Abad del
Cusco, Oxapampa, Peru. 58Russian Institute of Continuous Education in Forestry, Institutskaya 17, Pushkino, 141200,
Russia. 59Institute for Evolutionary Ecology of the National Academy of Sciences of Ukraine, Lebedev 37, Kyiv, 03143,
Bolivia. 62FRIM Forest Reserach Institute of Malaysia, 52109 Kepong, Selangor, Kuala Lumpur, Malaysia. 63Hiroshima
University, 1-7-1 Kagamiyama, Higashi-Hiroshima, Hiroshima, 739-8521, Japan. 64Center for Agricultural research in
Suriname, CELOS, 1914, Paramaribo, Suriname. 65Nicholas School of the Environment, Duke University, P.O. Box
90328, Durham, NC, 27708, USA. 66IIC, The Iwokrama International Centre for Rain Forest Conservation and
Development, 77 High Street, Georgetown, Guyana. 67Cibodas Botanic Gardens - Indonesian Institute of Sciences
(LIPI), Jl. Kebun Raya Cibodas, Cipanas, Cianjur, 43253, Indonesia. 68Museu Universitário, Universidade Federal do
Acre, BR 364, Km 04 - Distrito Industrial, Rio Branco, 69915-559, Brazil. 69Guyana Forestry Commission, 1 Water
Street, Kingston Georgetown, Guyana. 70Plant Systematic and Ecology Laboratory, University of Yaoundé I, P.O. Box
047, Yaounde, Cameroon. 71Bioversity international, P.O. Box 2008, Messa, Yaoundé, Cameroun. 72School of Natural
Sciences, Bangor University, Thoday Building. Deiniol Rd, Bangor, LL57 2UW, United Kingdom. 73Siberian federal
University, Svobodnyy Ave, 79, Krasnoyarsk, 660041, Russia. 74Department of Forest Sciences, Luiz de Queiroz
College of Agriculture, University of Sao Paolo, PO Box 9, Av. Pádua Dias, 11, Piracicaba, São Paulo, 13418-900, Brazil. 75State Nature Reserve Denezhkin Kamen, Lenina, 6, Sverdlovsk reg, Severouralsk, 624480, Russia. 76International Center for Tropical Botany, Department of Biological Sciences, Florida International University, 11200
S.W. 8th Street, Miami, 33199, FL, USA. 77Universidad Autónoma del Beni, Riberalta, Bolivia. 78Department of
Microbiology and Ecosystem Science, Division of Terrestrial Ecosystem research, University of Vienna, Althanstrasse 14, Vienna, A-1090, Austria. 79New Zealand Forest Research Institute (Scion) Te Papa Tipu Innovation Park, 49 Sala
Street, Rotorua, 3046, New Zealand. 80Unaffiliated (retired), Sommersbergseestrasse 291, Bad Aussee, 8990,
Austria. 81W.R.T College of Agriculture and Forestry, University of Liberia, Capitol Hill, Monrovia, 9020, Liberia. 82FRIM Forest Research Institute of Malaysia, 52109 Kepong, Selangor, Kuala Lumpur, Malaysia. 83Department
Foresterie et Environnement (DFR FOREN), Institut National Polytechnique Félix Houphouët-Boigny, INP-HB, Yamoussoukro, BP 2661, Côte d’Ivoire. 84Reshetnev Siberian state university of science and technology, pr. Mira 82,