HAL Id: hal-00298759
https://hal.archives-ouvertes.fr/hal-00298759
Submitted on 30 Aug 2006HAL is a multi-disciplinary open access
archive for the deposit and dissemination of sci-entific research documents, whether they are pub-lished or not. The documents may come from teaching and research institutions in France or abroad, or from public or private research centers.
L’archive ouverte pluridisciplinaire HAL, est destinée au dépôt et à la diffusion de documents scientifiques de niveau recherche, publiés ou non, émanant des établissements d’enseignement et de recherche français ou étrangers, des laboratoires publics ou privés.
Formation of runoff at the hillslope scale during intense
precipitation
S. Scherrer, F. Naef, A. O. Faeh, I. Cordery
To cite this version:
S. Scherrer, F. Naef, A. O. Faeh, I. Cordery. Formation of runoff at the hillslope scale during intense precipitation. Hydrology and Earth System Sciences Discussions, European Geosciences Union, 2006, 3 (4), pp.2523-2558. �hal-00298759�
HESSD
3, 2523–2558, 2006 Runoff formation at hilsslope S. Scherrer et al. Title Page Abstract Introduction Conclusions References Tables Figures J I J I Back Close Full Screen / EscPrinter-friendly Version Interactive Discussion
EGU Hydrol. Earth Syst. Sci. Discuss., 3, 2523–2558, 2006
www.hydrol-earth-syst-sci-discuss.net/3/2523/2006/ © Author(s) 2006. This work is licensed
under a Creative Commons License.
Hydrology and Earth System Sciences Discussions
Papers published in Hydrology and Earth System Sciences Discussions are under open-access review for the journal Hydrology and Earth System Sciences
Formation of runo
ff at the hillslope scale
during intense precipitation
S. Scherrer1, F. Naef2, A. O. Faeh3, and I. Cordery3 1
Scherrer AG, Basel, Switzerland
2
Institute of Envirnonmental Engineering, Swiss Federal Institute of Technology, ETH, Zurich, Switzerland
3
Heierli Consulting Engineers, Zurich, Switzerland
3
School of Civil and Environmental Engineering, University of New South Wales, Sydney, Australia
Received: 21 August 2006 – Accepted: 25 August 2006 – Published: 30 August 2006 Correspondence to: S. Scherrer ([email protected])
HESSD
3, 2523–2558, 2006 Runoff formation at hilsslope S. Scherrer et al. Title Page Abstract Introduction Conclusions References Tables Figures J I J I Back Close Full Screen / EscPrinter-friendly Version Interactive Discussion
EGU
Abstract
On 60 m2 hillslope plots at 18 mainly grassland locations in Switzerland rain was ap-plied at rates of 50–100 mm/h for between 3 and 6 h. The generated flows were mea-sured, overland flow near surface and subsurface flow in 0.5–1.3 m below surface. At some locations less than 2% of the rain flowed down the slope either on or below the
5
surface, whereas at some others more than 90% of the rain ran off. At the majority of sites most runoff was overland flow, though at a few sites subsurface flow, usually via macropores was dominant. Data collected during each of 48 high intensity sprinkling experiments were used to distinguish which processes were dominant in each exper-iment. Which dominant and subsidiary processes occurred depended on interactions
10
between infiltration rate, change in soil water storage and drainage of the soil water. These attributes were often not directly linked to parameters usually considered im-portant like vegetation, slope, soil clay content and antecedent soil moisture. In many cases, process determination was fairly straightforward, indicating the possibility to re-liably predict runoff processes at a site. However, at some sites, effects occurred that
15
were not easily recognizable and led to surprising results.
1 Introduction
Reliable simulation of runoff formation requires an adequate representation of the rele-vant processes by the model used. However, runoff formation on the catchment scale during extreme events is not well understood and the adequacy of model concepts for
20
estimation of such events remains uncertain. One reason for this is that the processes occurring during extreme events are not well represented in the available data. This is because time series of rainfall and discharge measurements seldom cover more than a few decades and therefore mostly contain only small or medium flood events. Another reason is the large heterogeneity of natural soils and there appear to be many ways in
25
pro-HESSD
3, 2523–2558, 2006 Runoff formation at hilsslope S. Scherrer et al. Title Page Abstract Introduction Conclusions References Tables Figures J I J I Back Close Full Screen / EscPrinter-friendly Version Interactive Discussion
EGU cesses are not well understood. It is therefore difficult to develop model concepts that
reflect a wide variety of physical processes without becoming totally unmanageable in their data and computational requirements. In the present study, an attempt is made to observe and understand the processes of runoff formation and to develop ideas on how to use this understanding to further improve flood modelling. The approach used
5
was:
– to collect data on the reaction of hillslopes to extreme artificial rainfall events, – to study in detail runoff formation during such events,
– to classify the processes that were observed to occur during the extreme events.
Since Horton (1933) developed his infiltration theory, numerous studies have
investi-10
gated the nature of runoff formation, summarised for example by Chorley (1978); Beven (1989); Anderson and Burt (1990). Some researchers focused on small and therefore largely homogeneous areas like subcatchments and hillslopes or plots (Betson, 1964; Whipkey, 1965; Dunne and Black, 1970; Chamberlain, 1972). These studies revealed great variability in the mechanisms contributing to flow (Pilgrim et al., 1978) and the
cru-15
cial role of the soil and its subsurface characteristics on discharge formation. “Hillslope hydrology”, established in the 60 s and 70 s showed that fast subsurface flow can be a significant source of streamflow (Kirkby, 1978). Subsequently, different processes have been observed and described by a number of researchers to explain runoff formation in a catchment. These processes are typically:
20
Hortonian Overland Flow (HOF), which occurs when rainfall intensity exceeds the
infiltration capacity of the soil. Here runoff formation depends mainly on the intensity of the rainfall and the characteristics of the top few centimetres of the soil (Horton, 1933).
Saturation overland flow (SOF) occurs when the storage capacity of the soil is
ex-ceeded. Runoff therefore is dependent on the volume of the rainfall. The concept of
25
contributing areas (Dunne and Black, 1970) that expand with increasing rainfall volume is based on this idea.
HESSD
3, 2523–2558, 2006 Runoff formation at hilsslope S. Scherrer et al. Title Page Abstract Introduction Conclusions References Tables Figures J I J I Back Close Full Screen / EscPrinter-friendly Version Interactive Discussion
EGU
Fast Subsurface Flow (SSF) is important if the infiltrating water flows quickly enough
beneath the surface along preferential lateral paths in the soil or subsoil and thereby contributes to stormflow.
Deep Percolation (DP) occurs when the infiltrating water passes to the groundwater
or to storage layers.
5
Studies by Mosley (1979, 1982) and Beven and Germann (1982) pointed to the sub-stantial role of macropores in draining hillslopes. Investigations focusing the infiltration process confirmed the relevance of the matrix being bypassed via macropores (Bron-stert, 1999; Jones and Connelly, 2002). Tracer experiments performed by Bouma (1991); Ghodrati and Jury (1990), Flury et al. (1994), and Weiler and Naef (2003)
10
showed that rapid flow can occur along macropores.
The studies mentioned here cover a wide range of different investigation methods, soil and hillslope conditions, rainfall characteristics and consequently of soil water movement processes observed. However little work has been done to predict which processes are likely to occur at a given location and the identification of the reasons
15
for their occurrence. In addition, these studies were mainly performed at single se-lected sites. For the evaluation of the factors influencing the dominant runoff processes, data from experiments at sites with widely different soils and geology conducted under standardized conditions are required. Understanding these factors would allow inves-tigations into the distribution of these processes within catchments and how different
20
distributions might influence the reaction of a river to severe storms (see also McGlynn et al., 2004).
2 Methodology and experimental sites
With the aim to produce a data set reflecting a wide range of possible runoff processes, closely monitored plots were sprinkled in different regions in Switzerland with artificial
25
rainfall of more than 50 mm/h for several hours. Such rainfall intensities correspond to at least 100 year events, if they endure for one hour. If they occur for several hours, they
HESSD
3, 2523–2558, 2006 Runoff formation at hilsslope S. Scherrer et al. Title Page Abstract Introduction Conclusions References Tables Figures J I J I Back Close Full Screen / EscPrinter-friendly Version Interactive Discussion
EGU would have return periods of several hundreds to thousands of years in Switzerland.
Sites were selected to cover a broad range of conditions with respect to geology, soil characteristics, slope angle and micro-topography. Altogether, 18 sites were se-lected. Careful attention was given to identifying the details of the soil structure, such as the soil matrix properties, the size and number of macropores (e.g. soil cracks, worm
5
holes, root channels, etc.), and the soil profile. At each site, several experiments were performed under different conditions, resulting in a total of 48 sprinkling experiments. During each experiment, interest was focussed on monitoring the timing of changes in flows recorded and of soil water contents.
To facilitate the process identification, only fairly homogeneous sites were selected.
10
If possible, the underlying layer was desired to be impervious to minimise unaccounted water losses. As 3000 to 6000 l of water per hour was needed for sprinkling, the plots had to be near a hydrant or a river.
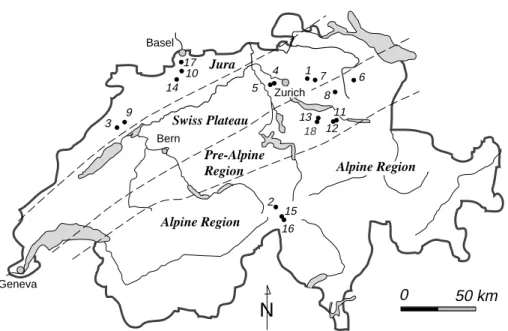
The 60 m2 plots were 4 m wide (across the slope) by 15 m long. The plots inves-tigated are listed in Table 1 and their locations are shown in Fig. 1. Four sites were
15
in the Jura (limestone and moraine), five sites on the Swiss Plateau (freshwater mo-lasse: sandstone, conglomerate, moraine), six sites in the Prealpine Region (fresh-water molasse: conglomerate and sandstone) and three sites in the Alpine Region (granite and gneiss). The pedology comprised one rendzina, three gleysols, two pod-sols, and twelve cambisols. As the study focused on meadow and pasture sites only
20
three sites were located in forests. All the grassland and pasture sites were visually similar. Visual inspection of plot surfaces and vegetation cover gave no hint of the large differences in hydrology, which became apparent during the experiments.
The artificial rainfall equipment used (shown schematically in Fig. 2) enabled the pro-duction of rainfall intensities of between 50 and 100 mm/h on a study area of 60 m2. The
25
spectrum of drop sizes was not analysed, because all sites had vegetation cover that mostly protected the soil surface and aggregates from the impact of raindrops. The in-fluence of wind on rainfall distribution was minimized by the installed wind break fence, therefore the rainfall intensity varied gradually within the experimental field. Plastic
HESSD
3, 2523–2558, 2006 Runoff formation at hilsslope S. Scherrer et al. Title Page Abstract Introduction Conclusions References Tables Figures J I J I Back Close Full Screen / EscPrinter-friendly Version Interactive Discussion
EGU covers served to delineate the plot. The equipment was installed on slopes with slope
angles between 20 and 55%. At the bottom of the experimental plot, a trench was excavated down to the rock surface or to a less permeable layer (depth: 0.5–1.3 m).
Overland flow was collected with an aluminium tray, which was driven into the A-layer as close as possible to the surface. Depending on the flow rate, overland flow
5
was measured either by a tipping-bucket or a V-notch weir. Water emerging from the trench face was also collected and recorded.
Soil moisture changes were observed by TDR-probes (Time Domain Reflectometry) and tensiometers; the water levels in the soil were measured with piezometers. These instruments were concentrated in clusters at different depths to provide data over the
10
whole soil profile. To observe possible water losses from the plot, some piezometers were located outside the sprinkled area.
At least five days with no natural rain were required before the first experiment at each site to ensure that relatively dry antecedent soil moisture conditions would be encountered. By repeating the experiment on the day following the initial experiment,
15
the influence of wet antecedent soil moisture conditions could be studied.
The first step to identify flow processes was visual observation of the soil surface and trench face during the experiments. The instrumental measurements yielded con-tinuous information on the main flow sources and soil moisture changes and allowed the overall water balance for each experiment to be determined. At many sites, this
20
provided sufficient information for reliable process identification. However, some sites reacted unexpectedly due to processes not being directly identifiable with the above methods. At these sites, different process hypotheses were tested with the dual-porosity finite element model QSOIL. This numerical model, as well as the procedures to adapt it to a site and to find the representative process is described in more detail in
25
Faeh et al. (1997).
In QSOIL, matrix flow is modelled with the 2 dimensional Richard’s equations, macro-pore flow with a kinematic wave. The water exchange between the two domains is con-sidered for each time step. The observed variability of the soil in the hillslope transect
HESSD
3, 2523–2558, 2006 Runoff formation at hilsslope S. Scherrer et al. Title Page Abstract Introduction Conclusions References Tables Figures J I J I Back Close Full Screen / EscPrinter-friendly Version Interactive Discussion
EGU can be built into the model. Its modular structure can be set up to consider mainly
ma-trix flow, or give more emphasis to macropore flow. The interaction between the mama-trix and macropores and the way that macropore flow is initiated can be varied. Layers with increased lateral conductivity can also be introduced. For a given site, various com-binations of the different flow modules were usually developed, reflecting the different
5
flow processes, which seemed possible on the basis of the site characteristics and the measured and visual observations made during the sprinkling experiments. Usually the measured surface and subsurface flows as well as the observed water changes in the hillslope could be reproduced with one of the model setups. This setup was then considered to provide an adequate representation of the processes of this hillslope.
10
3 Specific results
Before the overall results from the 18 sites are discussed, three experiments are de-scribed in some detail to provide insight into the procedure used to identify the flow processes. These detailed results are given for the experiments at (1) Willerzell Hang, where moderate runoff started 20 min after sprinkling began, with over 60% eventually
15
running off; (2) Hospental, where immediate runoff was followed by more than an hour of no runoff, after which a small proportion of the applied rain was measured as runoff; and (3) Gotthard, where runoff began within minutes of the initiation of rain and where a single controlling factor caused 90% of the applied rainfall to run off.
3.1 Willerzell Hang (site 18): dominance of subsurface flow processes
20
3.1.1 Site characteristics
Willerzell, located in the Swiss pre-Alps 40 km SSE of Zurich, was the steepest of the sites examined (slope of 55%). The study area is underlain by greyish sandstone of the upper sub-alpine freshwater molasse. The fall of the geological strata is approximately parallel to that of the hillslope. As a consequence of its steepness, only a shallow,
HESSD
3, 2523–2558, 2006 Runoff formation at hilsslope S. Scherrer et al. Title Page Abstract Introduction Conclusions References Tables Figures J I J I Back Close Full Screen / EscPrinter-friendly Version Interactive Discussion
EGU sandy cambisol (A-B-C-R-layer) of varying depth has been developed. Vertical
earth-worm burrows existed in the A-, B-, C-layer. Grey hydromorphic and red oxidised spots were visible at isolated locations in the subsoil (horizon). At the bottom of the C-layer, some water emanated from a sandy horizon when the pit was excavated in dry conditions. This lens consisted of weathered rock material, lying between bands of
5
hard, intact bedrock. Two experiments were conducted 5 and 6 days before the exper-iment reported here. Thus, the antecedent soil moisture conditions for the described experiment were not as dry as for most of the initial experiments at the other plots. 3.1.2 Experimental observations
At site 18, where five experiments were performed, runoff showed only a weak
sensi-10
tivity to different antecedent soil moisture conditions. The rainfall intensity applied in the first two hours was about 50 mm/h and 65 mm/h in the third hour (Fig. 3). The varia-tion was introduced to analyse the influence of rainfall rate on overland and subsurface discharges. Only 9 min after the beginning of rain, a first small subsurface flow began to emerge from the pit profile. 25 min after rain started, the subsurface flow increased
15
substantially. This flow increased and reached a steady state of about 28 mm/h one hour after experiment begin. Water was observed to flow both from the sandy weath-ered bedrock lens and under pressure from macropores. Forty minutes after the start of rain, a small rate of overland flow was generated which soon reached a constant flow rate of 5 mm/h. When the rainfall intensity was increased, subsurface flow was
20
hardly affected. Overland flow increased to 16 mm/h, a considerable part of which was from return flow exiting from three mouse burrows near the collector tray.
3.1.3 Identification of the flow processes
Many tensiometers reacted rapidly, indicating soil saturation within 30 min of the start of the rain. Most of the piezometers reacted like P4 (Fig. 3, position indicated in Fig. 4)
25
How-HESSD
3, 2523–2558, 2006 Runoff formation at hilsslope S. Scherrer et al. Title Page Abstract Introduction Conclusions References Tables Figures J I J I Back Close Full Screen / EscPrinter-friendly Version Interactive Discussion
EGU ever, 50 mm of water, sprinkled within the first hour, was by far not sufficient to saturate
the soil completely. Therefore, overland flow did not increase substantially, despite the instruments apparently indicating soil saturation. The rapid decrease of the soil suction measured by the instruments has to be considered as the result of the short-circuiting of infiltration water along macropores. The rapid increase of most of the piezometers
5
therefore seemed to represent pressure conditions in the highly permeable layers only (macropore system). The slow rising piezometric levels recorded by P3 (Fig. 3) are thought to represent the water pressure in the matrix. Such partial saturation of the soil has also been described by Weiler and Naef (2003b).
Figure 4 schematically shows the flow processes identified at Willerzell Hang. A
10
part of the subsurface flow into the pit originated from the macropores, in which flow under pressure took place. Considerable subsurface flow eminated from the sandy and highly permeable weathered rock above the unweathered sandstone (1 in Fig. 4). The subsurface flow (up to 52% of the rainfall rate) reached the pit with small delay. The rapid response of tensiometers and the short delay before the start of subsurface
15
flow suggest that the soil matrix was predominantly bypassed by flow in preferential pathways.
The minor contribution of overland flow on such a steep slope was surprising. The efficient draining of the soil prevented saturation of the plot. Therefore return flow (2 in Fig. 4) and overland flow (3 in Fig. 4) contributed less than a quarter to total runoff
20
measured.
The rapid and intense flow response observed at the trench was only possible by the activation of efficient preferential flow paths soon after sprinkling started. Numerous macropores and the permeable layers above the sandstone bedrock were recognized visually before the experiment and some SSF was expected. The observed rapid and
25
dominant response surprised. Another puzzling aspect was observed at the surface. A video recording showed raindrops disappearing immediately upon impact with the soil and the development of a surface water film could only be seen towards the end of the experiment. Obviously, water did not enter the macropores at the surface. When water
HESSD
3, 2523–2558, 2006 Runoff formation at hilsslope S. Scherrer et al. Title Page Abstract Introduction Conclusions References Tables Figures J I J I Back Close Full Screen / EscPrinter-friendly Version Interactive Discussion
EGU infiltrates, the soil has to become saturated, before water can flow into the macropores.
Weiler and Naef (2003) observed similar mechanism of macropore flow initiation on and below the surface. Rapid subsurface macropore flow initiation was found to be possible when shallow layers in the A-horizon are quickly saturated.
Different process hypothesis were tested for this site with the QSOIL model to enable
5
to flow processes to be identified. Reasonable agreement between both the measured flows and the observed pressures in the preferential flow system layers and the soil matrix (Fig. 3) was found on the basis of two assumptions: A layer of low conductivity in the A-horizon, and reduced interaction between the preferential pathways and the matrix subsequent to the entry of water into the preferential flow system. Although
10
these factors influence the resulting process in Willerzell Hang substantially, they are difficult to detect in the field. The identified mechanism implies that the rain enters the matrix near the soil surface (see also Fig. 8i). After a quick saturation of the shallow uppermost soil layer, macropore flow is initiated, effectively bypassing the soil matrix and supplying water immediately to the lateral pipes and highly permeable layers at the
15
bottom of the profile, where it flows rapidly downhill. The significant subsurface flow delays saturation of the soil profile considerably.
3.2 Hospental (site 2): overland flow controlled by hydrophobicity and soil matrix stor-age
3.2.1 Site characteristics
20
Site 2 is located near the Reuss River in a valley in the central Alps at an altitude of 1400 m. The area was glaciated in the most recent Ice Age. The sandy cambisol grass-land site is located on a 100 m long hillslope with a gradient of 29–33%. The soil profile has a 10 cm deep A-horizon, a 70 cm thick sandy B-horizon and weathered bedrock of sandy and stony material of 20 cm thickness (C-layer) overlying the impervious gneiss
25
bedrock (R). The A-horizon comprises nearly 10% organic material, 46% sand and 31% silt, and is acidic (pH 4–5). Despite the acidity, several wormholes were observed
HESSD
3, 2523–2558, 2006 Runoff formation at hilsslope S. Scherrer et al. Title Page Abstract Introduction Conclusions References Tables Figures J I J I Back Close Full Screen / EscPrinter-friendly Version Interactive Discussion
EGU which extended down to the weathered bedrock. A dense superficial network of grass
roots dominated the upper part of the A-layer and made the excavation of the ditch and installation of instruments difficult.
3.2.2 Experimental observations
Two experiments (2/2 and 2/3) with different antecedent conditions are discussed here.
5
In experiment 2/2 an average rainfall intensity of 61 mm/h was applied for 2 h to the plot on the initially dry soil with high soil suctions. Figure 5a shows the hydrographs and typical piezometer and tensiometer observations of experiment 2/2. Within minutes of the beginning of rain, overland flow peak was observed, which ceased after about 20 min. For another hour, water infiltrated without forming any significant runoff. When
10
the initial overland flow vanished, some tensiometers showed a rapid decrease of soil suctions, while other instruments only reacted later and apparently independently of their depth within the soil. After about two hours soil saturation was indicated by the piezometers.
The experiment was repeated with wetter initial conditions with rather low soil
suc-15
tions after a rainy and cold period of 12 days (Fig. 5b). When rainfall intensities of 70 mm/h were applied, soil suctions decreased rapidly after the start of the experiment and the overland flow increased simultaneously. The water level in the piezometers almost reached the surface within 1 h. In the meantime subsurface flow appeared at the profile in the trench and attained a steady state after a short time. Then the sum of
20
overland and subsurface flow almost equalled the applied rainfall rate. 3.2.3 Identification of the flow processes
High soil suctions in combination with the dense and excessively dry, fur like root layer in the topsoil initially prevented infiltration. These initial hydrophobic conditions pro-duced temporary Hortonian overland flow and some macropore flow. Similar
hydropho-25
Black-HESSD
3, 2523–2558, 2006 Runoff formation at hilsslope S. Scherrer et al. Title Page Abstract Introduction Conclusions References Tables Figures J I J I Back Close Full Screen / EscPrinter-friendly Version Interactive Discussion
EGU well, 2000; Ellerbrock et al., 2005; and Burch et al., 1989).
Most tensiometers in the topsoil reacted slower than the deeper instruments, indicat-ing that the matrix of the A-horizon was partly bypassed by the infiltratindicat-ing water. After the initial hydrophobic phase, infiltration must have been occurring primarily through wormhole macropores or equivalent soil structures. In other parts of the plot, the slow
5
reaction of the tensiometers indicated some matrix flow. Macropore flow in combination with matrix flow enabled the saturation of this sandy soil.
In the second experiment with wetter initial conditions, saturation overland flow oc-curred early in the event and continued until rain ended. On this site, the antecedent conditions had a crucial influence on process dominance.
10
3.3 Gotthard Pass (site 16): dominance of overland flow due to infiltration hindrance 3.3.1 Site characteristics and observations
At site 16, located at an altitude of 2100 m in the central Swiss Alps, the alpine climate is characterised by a high annual precipitation of 2400 mm, low average temperatures and harsh winters with much snow. These climatic conditions result in a short growing
15
period and seriously impair soil development. A humic podsol with a 30 cm thick A-layer of partly decomposed organic material has developed (organic content 11%). The B-layer of this acidic soil (pH 4) is sandy (69% sand, pH 4) and has no visible edaphic life (earthworms, etc.) and no significant macropores. The bottom of the 1 m soil profile is a sandy oxidised and porous alluvial-horizon (68% sand), which forms the transition to
20
the weathered granitic bedrock. The slope of the stone and boulder-strewn site is 38% and the vegetation cover is alpine grass.
When the experiments were performed in mid-summer, immediate overland flow was observed. The relatively dry soil surface was observed not to be wetted during the first minutes of high intensity rain application. However, overland flow did not cease and
25
continued to increase, even after the soil surface was obviously wetted. Flow rate rapidly reached about 90% of the applied rainfall (see hydrograph 16 in Fig. 6). This
HESSD
3, 2523–2558, 2006 Runoff formation at hilsslope S. Scherrer et al. Title Page Abstract Introduction Conclusions References Tables Figures J I J I Back Close Full Screen / EscPrinter-friendly Version Interactive Discussion
EGU high runoff rate continued until the end of the experiment.
3.3.2 Process identification
At the beginning of the experiment, the soil profile was clearly not saturated. The initial overland flow resulted from infiltration hindrance resulting from the hydrophobic nature of the dry, organic-rich topsoil. As described previously, such initial, transient
5
hydrophobicity was also observed at site 2. In contrast to site 2, the initially observed infiltration hindrance was not transient. Inspection of the vegetation cover and the topsoil provided explanations for this strong overland flow. The experimental area was dominated by the matt-grass nardus stricta, which prefers dry, acid soils. In the alpine region, decaying mat-grass accumulates the necromass of topsoils and results in a kind
10
of thatch roof effect, causing intense Hortonian overland flow (Markart et al., 1999). Without an effective macropore network (e.g. roots of shrubs, animal borrows, etc.) such impeding layers cannot be bypassed and consequently the storage volume of the subsoil is not be used.
3.4 Summary
15
The experiments performed at these three sites demonstrate that the runoff processes and the flow rates are determined by different factors and interaction. In particular, the structure of the soil, the number and orientation of preferential flow paths in the soil and effects of infiltration hindrances play a crucial role in the mechanisms of runoff formation.
HESSD
3, 2523–2558, 2006 Runoff formation at hilsslope S. Scherrer et al. Title Page Abstract Introduction Conclusions References Tables Figures J I J I Back Close Full Screen / EscPrinter-friendly Version Interactive Discussion
EGU
4 General results
4.1 Runoff response
Figure 6 provides an overview of the runoff response observed during the experiments performed with initial dry soil conditions at the 18 sites. The complete results can be found in Scherrer (1996). Shown are the volumetric runoff coefficients (cumulative
5
discharge of overland and subsurface flow divided by the cumulative rainfall) as they developed during each experiment. Both the time taken until runoff began and the total discharge volume varied widely from site to site. Site 5 displays a response as suggested by conventional thinking. That is, after a period in which the surface soil absorbs most of the water, runoff begins and as time progresses, the rate of runoff
10
approaches the rainfall rate. However, at other sites, the runoff characteristics were very different, ranging from almost all applied rain running off at sites 12, 13 and 16 to practically no runoff at all at sites 6 and 14, even after application of more than 250 mm of rain in four hours. Others sites had their own specific responses to rainfall, such as site 2 at Hospental as discussed above.
15
At the majority of sites, overland flow was dominant. Specific conditions, however, led to significant subsurface flow. After two hours of rain application, more than 60% of the measured discharges were subsurface flow at sites 4, 8 and 18. Rapid, subsurface flow was also recorded at sites 5 and 13 however the subsurface flow volume were small.
20
Traditionally parameters such as antecedent soil moisture, surface slope, soil clay content, vegetation cover, etc. have been used to develop relationships or rules for predicting hydrological responses. Figure 7 shows some of these variables as deter-mined at the experimental sites, plotted against the runoff coefficients recorded after one hour. From this diagram tt is obvious that these parameters are not sufficient to
25
HESSD
3, 2523–2558, 2006 Runoff formation at hilsslope S. Scherrer et al. Title Page Abstract Introduction Conclusions References Tables Figures J I J I Back Close Full Screen / EscPrinter-friendly Version Interactive Discussion
EGU 4.2 Determination of runoff processes
In this section, an overview of the processes found in all experiments is given. Usu-ally, several flow processes were observed simultaneously during the sprinkling tests. These have been classified into dominant and subordinate flows on the basis of water volumes, and ranked as fast (e.g. SSF1), delayed (SSF2) and very delayed processes
5
(SSF3). Table 2 shows the dominant and subordinate flow processes for all sites and the variation of process dominance from site to site. At some plots, the dominant pro-cess was different when the experiment was repeated under wet conditions, as will be discussed below.
At sites 3, 5, 11, 12, 13, 15 and 16 Hortonian overland flow (HOF) was identified
10
as the dominant process. The small delay of the appearance of overland flow and the absence of significant soil moisture changes in the subsoil was the key to this identification. “Surface sealing effects” were detected at sites 15 and 16 in the alpine region, where weakly decomposed vegetation litter formed an infiltration barrier. At site 3, a silt cambisol has developed on a moraine of the Riss-Ice-Age. Aggregate
15
instability (dispersion) combined with surface sealing and compacting effects produced by grazing cattle appeared to be the cause of low infiltration. The immediate surface runoff originated from such compacted areas in the experimental field. At site 5 on similar geology a cambisol developed with a rather compact top-layer, which prevented infiltration.
20
Sites 11, 12 and 13 were located in areas with rather wet soils (gleysol). At site 13 the water table was only 0.4–0.8 m below the surface, with few macropores and only one sizeable soil pipe entering the pit. Before experimentation, the authors believed that the soil would rapidly become saturated and saturation overland flow would occur. However, infiltration into the soil was limited due to the low permeability and the water
25
table only rose slowly. Soil saturation occurred only at a few minor locations in the plot area and the rapid and intense overland flow was therefore Hortonian overland flow (HOF). However, this example shows that the distinction between SOF1 and HOF
HESSD
3, 2523–2558, 2006 Runoff formation at hilsslope S. Scherrer et al. Title Page Abstract Introduction Conclusions References Tables Figures J I J I Back Close Full Screen / EscPrinter-friendly Version Interactive Discussion
EGU processes is somewhat arbitrary as the conditions for their occurrence and their
out-comes are quite similar. Very delayed saturation overland flow (SOF3) was dominant at sites 2, 8, and 17. Here high infiltration capacity delayed the initiation of overland flow by between 30 min and an hour or more. At sites 2 and 17 permeable soil ma-trices with extended macropore networks were identified as the main factors delaying
5
overland flow. The macropore structure, consisting of soil cracks and earthworm bur-rows, enabled efficient flow into the soil. Saturation of the matrix occurred mainly with water flowing out of macropores. This was also found by Christiansen et al. (2004). At the same time, this macropore structure enabled surprisingly fast drainage of the soil after the experiment. Therefore, when the experiments were repeated the next
10
day, the water table had fallen considerably and it took quite some time to saturate the soil again. Occurrence of fast drainage might explain the weak relation between antecedent precipitation and runoff coefficient that is often encountered.
At site 8, the soil matrix consisted of 40% clay and the observed infiltration rate might surprise. The seasonal susceptibility of this soil to shrinking created a distinct
15
and efficient system of soil cracks, which delayed the runoff formation substantially. This macropore network enabled the infiltrated water to partially bypass the matrix. However, the steadily increasing subsurface flow (SSF3) did not reach volumetric dom-inance.
Subsurface flow was dominant at sites 4, 6 and 18, where the water drained laterally
20
into the trench along macropores, pipes and highly permeable layers. At both sites 4 and 6, the trench was bypassed by deeper subsurface flow which exfiltrated to a stream bank or in the bed of the nearby river. Drainage through these efficient vertical and lateral flow pathways prevented the saturation of the entire soil within the duration of these experiments. Matrix flow did not significantly contribute to subsurface flow at any
25
of these sites. The bypassing flows from sites 4 and 6 can probably make a significant contribution to catchment storm flow during widespread rain events.
Rapid infiltration characteristics governed the hydrology at sites 9 and 14. In addition, permeable bedrock enabled significant deep percolation at site 14. This hydrological
HESSD
3, 2523–2558, 2006 Runoff formation at hilsslope S. Scherrer et al. Title Page Abstract Introduction Conclusions References Tables Figures J I J I Back Close Full Screen / EscPrinter-friendly Version Interactive Discussion
EGU behaviour at site 14 persisted when the experiment was repeated the following day and
neither subsurface flow nor overland flow occurred for both of these experiments.
5 Discussion
The detailed measurement and analysis performed for many high intensity sprinkling experiments on different soils revealed a wide range of phenomena influencing runoff
5
formation. Can these results be used to predict the behaviour of plots during intense precipitation or are the natural variations too large to be captured in generalized rules? 5.1 Is a generalized process definition possible?
To decide which process will occur on a plot during intense precipitation, the following questions have to be answered:
10
– Can all the rain infiltrate into the soil? – How much water can be stored in the soil? – How and how fast is the soil drained?
Sometimes, some general knowledge of the soils is sufficient to answer one or all of the above questions. In other cases profound knowledge or even sprinkling experiments
15
are required. Even here the answers still may be ambiguous. In the following, the processes observed at the different sites and the reasons for their occurrence are discussed based on the above questions (Fig. 8).
First question: Can all the rain infiltrate into the soil?
If water cannot infiltrate into the soil, although it is not yet saturated, HOF occurs
20
HESSD
3, 2523–2558, 2006 Runoff formation at hilsslope S. Scherrer et al. Title Page Abstract Introduction Conclusions References Tables Figures J I J I Back Close Full Screen / EscPrinter-friendly Version Interactive Discussion
EGU sealing, permanently hydrophobic humus in combination with poor macropore
devel-opment, were found at sites 3, 15 and 16. At these sites, process prediction was straightforward if the infiltration hindrances were detectable.
A different kind of HOF occurred at site 5, where an extended macropore network capable of transferring water rapidly into the soil was found. It was expected that after
5
saturation of the soil, SOF2 would occur. However HOF was observed. At this site, some not easily recognizable effects altered the runoff process. Although the macro-pore network bypassed the compacted topsoil, reduced flow from the macromacro-pores to the surrounding matrix prevented the water flowing out of the macropores. Therefore, after the macropores had quickly filled up to the surface, HOF was initiated (Fig. 8b).
10
On the shallow, nearly saturated soil of site 13, SOF1 was expected, but HOF found (Fig. 8c). In soils with both low infiltration and low storage capacity, it is difficult to judge which of the two factors is decisive. However, as the two processes do not differ much in their reaction, these uncertainties in the process definition are without major consequence.
15
Second question: How much water can be stored in the soil?
If the processes at the surface allow all the rain to enter the soil, the next question is how much water is needed to saturate the soil. Shallow, wet soils are usually easy to recognize and lead to SOF1 (Fig. 8d, sites 11 and 12). For deeper soils, an estimate of the depth to the impervious layer or water table and of the potential storage volume
20
is required. The shallow and permeable soils at sites 1 and 7 lead to SOF2 (Fig. 8e), while the soils at sites 2, 8, 10 and 17 with a depth of 1 m or more lead to SOF3 (Fig. 8f). Third question: Mechanism and velocity of soil drainage?
Efficient drainage of the soil prevents saturation such that SOF will not become the dominant flow process. Therefore drainage rate can substantially influence the
result-25
HESSD
3, 2523–2558, 2006 Runoff formation at hilsslope S. Scherrer et al. Title Page Abstract Introduction Conclusions References Tables Figures J I J I Back Close Full Screen / EscPrinter-friendly Version Interactive Discussion
EGU To predict subsurface flow processes, lateral flow paths have to be identified and
their efficiency evaluated. At site 6, a 10 cm thick weathered zone lay just above the bedrock below a sandy and shallow soil of varying depths. This highly permeable layer, which consisted mostly of stones and sand, allowed rapid downward flow (Fig. 8g). At the forested site 4, both living and decaying tree roots formed a network of preferential
5
pathways. In combination with the stony moraine, these structures were able to drain the water rapidly. Considering the conditions at site 18, some SSF was expected, but the observed rapid and intense macropore flow initiation was not expected (Fig. 8i). In such cases, process prediction is difficult.
Dominant deep percolation (DP, Fig. 8h) occurs if the bedrock or base material below
10
is pervious and soil is permeable as well (site 9, 14). Mostly, the amount of water that can seep into the deeper underground is limited and DP does not become dominant (site 17). At site 6, nearly all water flowed into the bedrock (conglomerate), clearly ful-filling the DP definition. However, an efficient lateral drainage system in the underlying bedrock led the water rapidly to the nearby river and made it react like SSF.
15
Are reliable process predictions possible?
With the knowledge gained in this study, process prediction for extreme rainfall events with intensities of between 50 and 100 mm/h worked reasonably well in 12 of the 18 sites. At three further sites, the prediction of HOF instead of SOF1 hardly affects the magnitude or timing of flow (sites 11, 12 and 13). This encouraged the development
20
of a scheme, which allows the prediction of dominant runoff processes on temperate grassland sites (Scherrer and Naef, 2003).
At two other sites (5 and 18), the observed processes were caused by a reduced water exchange between macropores and the soil matrix. This factor was not rec-ognized before the experiments, not mentioned in the literature and even difficult to
25
understand after the experiments. It might be connected with a higher clay content of the soil matrix, which impairs water flow out of macropores. An evaluation of the e ffi-ciency of lateral subsurface flow paths is generally difficult. Whereas highly permeable
HESSD
3, 2523–2558, 2006 Runoff formation at hilsslope S. Scherrer et al. Title Page Abstract Introduction Conclusions References Tables Figures J I J I Back Close Full Screen / EscPrinter-friendly Version Interactive Discussion
EGU layers can be detected in a trench, although their extent may remain uncertain (site 4,
6 and 18), the detection of pipes is more accidental. Hillslopes prone to SSF might be suspected through a combination of observations (geology, soil type, slope, seepage of water at the foot of the hill, geomorphology).
At a few sites, the processes were influenced by a delicate combination of factors
5
not identified before the experiment. However, at the majority of the experimental sites, the processes and the widely differing runoff behaviour were clearly identified with the discussed criteria. It therefore seems possible to apply them successfully at the catchment scale.
5.2 Influence of the antecedent wetness on runoff formation
10
Usually, it is expected that antecedent conditions influence the amount of rain that runs off. Runoff coefficients usually increase with increasing soil moisture. However, no direct relation between antecedent conditions and the resulting runoff could be found. To provide some insight into this problem, the sprinkling experiments were repeated at each site one day after the first run. Whereas the first experiment was generally
15
performed on rather dry soils, the second experiment was done less than one day after the application of several hundred millimetres of rain. In Table 2 the influence of the increased wetness on the processes in the follow-up experiment can be seen (the numbers in brackets in the location column indicate the numbers of days between the first experiment and each subsequent experiment).
20
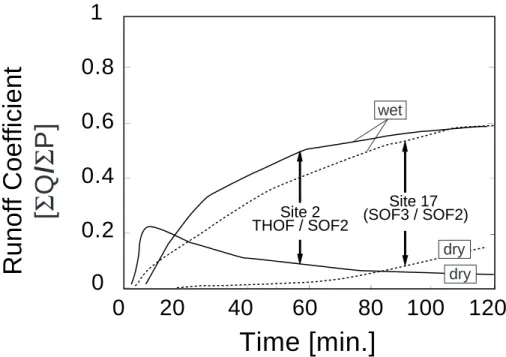
For the SOF3 dominated sites 2 and 17 (Fig. 9), faster and stronger response from the wet plot was observed and process dominance changed to SOF2. Despite the high water table at the end of the first experiments, the efficient drainage system managed to lower the water table overnight enough to prevent SOF1. In contrast to this, the runoff response from sites 3, 5, 13, which was dominated by SOF1 or HOF1 did not
25
change except for a slight increase in runoff volume when the experiment was repeated under wet conditions (Fig. 10).
HESSD
3, 2523–2558, 2006 Runoff formation at hilsslope S. Scherrer et al. Title Page Abstract Introduction Conclusions References Tables Figures J I J I Back Close Full Screen / EscPrinter-friendly Version Interactive Discussion
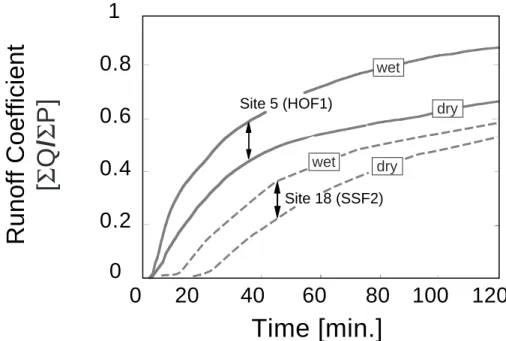
EGU volumes depends on the efficiency of the drainage network. At site 4, the dominant
pro-cess changed from SSF2 to SOF2 when the plot was wet. Despite overnight drainage, parts of the hill slope were still saturated or near saturation. At site 18 however (Fig. 10), the drainage of the soil was so efficient, that SSF2 remained dominant for the wet con-ditions on the second day.
5
These results imply that the impact of the antecedent wetness on the runoff volume depends on the runoff process encountered. HOF or SOF1 are hardly affected, as they already react rapidly under dry or wet conditions. More surprising is the indi ffer-ence of some SOF3, SSF and DP sites, where after the application of several hundred millimetres of rain the day before, no significant change occurred. A faster reaction
10
under wet conditions was prevented by an efficient drainage system, which lowered the water table in the soil within a few hours. On the other hand, some SOF3 and SSF dominated sites reacted quite sensitively to antecedent wetness. Here, the first experiments increased the saturation of the matrix. In these cases the macropore sys-tem was not efficient enough to drain the soil before the next experiment and so the
15
different starting conditions of the second experiment resulted in a process change.
6 Conclusions
The set of experiments described here, has revealed the wide range of reactions to precipitation between 50 mm/h and 100 mm/h on different grassland sites in Switzer-land. Runoff varying from as little as 2% to more than 90% of the applied rainfall rate
20
was observed. The experiments provided insight into the differences in runoff forma-tion on different soils and the reasons for the occurrence of a specific process. Process occurrence depends on interactions between infiltration rate, change in soil water stor-age and drainstor-age of the soil water. It has been shown which attributes determine the dominant and subsidiary processes that occur. These attributes are often not directly
25
linked to parameters usually considered important such as vegetation, slope, soil clay content and antecedent soil moisture. Sometimes process determination can be fairly
HESSD
3, 2523–2558, 2006 Runoff formation at hilsslope S. Scherrer et al. Title Page Abstract Introduction Conclusions References Tables Figures J I J I Back Close Full Screen / EscPrinter-friendly Version Interactive Discussion
EGU straightforward. However, effects that are not easily recognizable, can lead to
surpris-ing results.
There are two main consequences from this research. Firstly, the insight gained into the processes that govern the runoff response of hillslopes to high intensity rainfall provides some basis for the understanding of runoff formation at the catchment scale.
5
Secondly, unexpected processes were observed at some locations. Their analysis revealed at some sites a complex interaction of factors, which can influence runoff formation and the need for future research in this direction.
Acknowledgements. This research was financed by the Swiss National Science Foundation
and the Federal Institute of Technology, Zurich.
10
References
Anderson, M. G. and Burt, T. P.: Process studies in hillslope hydrology: an overview, in Process studies in hillslope hydrology, edited by: Anderson, M. G. and Burt, T. P., 1–8, J. Wiley & Sons, Chichester, 1991.
Betson, R. P.: What is watershed runoff?, J. Geophys. Res., 69, 1541–1552, 1964.
15
Beven, K. J.: Interflow, in Unsaturated Flow in Hydrologic Modelling Theory and Practice, edited by: Morel-Seytoux, H. J., Kluwer Academic Publishers, 191–219, 1989.
Beven, K. J. and Germann, P.: Macropores and water flow in soils, Water Resour. Res., 18, 1311–1325, 1982.
Blackwell, P. S.: Management of water repellency in Australia, and risks associated with
pref-20
erential flow, pesticide concentration and leaching, J. Hydrol., 231, 384–395, 2000.
Bouma, J.: Influence of macroporosity on environmental quality, Adv. Agronomy 46, 1–37, 1991.
Bronstert, A.: Capabilities and limitations of detailed hillslope hydrologic modelling, Hydrol. Processes, 13, 21–48, 1999.
25
Burch, G. J., Moore I. D., and Burns, J.: Soil hydrophobic effects on infiltration and catchment runoff, Hydrol. Processes, 3, 211–222, 1989.
HESSD
3, 2523–2558, 2006 Runoff formation at hilsslope S. Scherrer et al. Title Page Abstract Introduction Conclusions References Tables Figures J I J I Back Close Full Screen / EscPrinter-friendly Version Interactive Discussion
EGU
Mountain Geomorphology, edited by: Slaymaker, H. O. and McPherson, H. J., Tantalus Re-search, Vancouver, 1212–1228, 1972.
Chorley R. J.: The hillslope hydrologic cycle, in Hillslope Hydrology, edited by: Kirkby, M. J., 1–42, J.Wiley & Sons, Chichester, 1978.
Christiansen J. S., Thorsen, M., Clausen, Hansen, S., and Refsgaard, J. C.: Modelling of
5
macropore flow and transport processes at catchment scale, J. Hydrol., 299, 136–158, 2004. Doerr, S. H., Shakesby, R. A., and Walsh, R. P. D.: Soil water repellency: its causes,
character-istics and hydrogeomorphological significance, Earth Sci. Rev., 51, 33–65, 2000.
Dunne, T. and Black, R. D.: Partial area contributions to storm runoff in a small New England watershed, Water Resour. Res., 6, 1296–1311, 1970.
10
Ellerbrock, R. H., Gerke, H. H., Bachmann, J., and Goebel, M. O.: Composition of organic matter fractions for explaining wettability of three forest soils, J. Am. Soc. Soil Sci., 69, 57– 66, 2005.
Faeh, A. O., Scherrer, S., and Naef, F.: A combined field and numerical approach to investigate flow processes in natural macroporous soils under extreme precipitation, Hydrol. Earth Syst.
15
Sci., 4, 787–800, 1997.
FAO (United Nations Food and Agriculture Organization), Soil Map of the World, Vols. 1-10 (1:5M scale maps and accompanying texts), UNESCO, Paris, 1971–1981.
Flury, M., Fl ¨uhler, H., Jury, W. A., and Leuenberger, J.: Susceptibility of soils to preferential flow of water: A field study, Water Resour. Res., 7, 1945–1954, 1994.
20
Ghodrati, M. and Jury, W. A.: A field study using dyes to characterize preferential flow of water, J. Am. Soc. Soil Sci., 54, 1558–1563, 1990.
Heppell, C. M., Bidwell, A. S., Forrester, G., and Kilfeather, A. A.: A lysimeter experiment to investigate the effect of surface sealing on hydrology and pesticide losses from the recon-structed profile of a clay soil. 1. Hydrological characteristics, Soil Use Manage., 20, 373–383,
25
2004.
Horton, R. E.: The role of infiltration in the hydrologic cycle, Trans. of the American Geophysical Union, 14, 446–460, 1933.
Jones, J. A. A. and Connelly, L. J.: A semi distributed simulation model for natural pipeflow, J. Hydrol., 262, 28–49, 2002.
30
Kirkby, M. J. (Eds.): Hillslope hydrology, J. Wiley & Sons, Chichester, 1978.
McGlynn, B. L., McDonell, J. J., Seibert, J., and Kendall, C.: Scale effects on headwater catch-ment runoff timing, flow sources, and groundwater-streamflow relations, Water Resour. Res.,
HESSD
3, 2523–2558, 2006 Runoff formation at hilsslope S. Scherrer et al. Title Page Abstract Introduction Conclusions References Tables Figures J I J I Back Close Full Screen / EscPrinter-friendly Version Interactive Discussion
EGU
40, W07504, 1–14, 2004.
Markart, G., Kohl, B., Poscher, G., Wanker, W., and Schnetzer, I.: Assessment of runoff charac-teristics in a torrent catchment area. Proceedings of the XXVIII IAHR-Congress on Hydraulic Engineering for Sustainable Water Management at the Turn of the Millennium, 22–27 August, Graz Austria, Europe, 1999.
5
Mosely, P. M.: Streamflow generation in a forested watershed, New Zealand, Water Resour. Res., 15, 795–806, 1979.
Mosely, P. M.: Subsurface flow velocities through selected forest soils, South Island, New Zealand, J. Hydrol., 52, 321–335, 1982.
Nobles, M. M., Wilding, L. P., and McInnes, K. J.: Pathways of dye tracer movement through
10
structured soils on a macroscopic scale, Soil Sci., 169, 229–242, 2004.
Pilgrim, D. H., Huff, D. D., and Steele, T. D.: A field evaluation of subsurface and surface runoff. II. Processes, J. Hydrol., 38, 319–341, 1978.
Scherrer, S.: Abflussbildung bei Starkniederschl ¨agen – Identifikation von Abflussprozessen mittels k ¨unstlicher Niederschl ¨age. (Translation: Runoff formation under extreme precipitation
15
– Identification of runoff processes by means of sprinkling experiments), PhD thesis, 189 pp., Swiss Federal Institute of Technology, Z ¨urich, 1996.
Scherrer, S. and Naef, F.: A decision scheme to indicate dominant hydrological flow processes on temperate grassland, Hydrol. Processes, 17, 391–401, 2003.
Weiler, M. and Naef, F.: Simulating surface and subsurface initiation of macropore flow, J.
20
Hydrol., 273, 139–154, 2003a.
Weiler, M. and Naef, F.: An experimental tracer study of the role of macropores in the infiltration in grassland soils, Hydrol. Processes, 17, 477–493, 2003b.
Whipkey, R. Z.: Subsurface stormflow from forested slopes, Bull. IAHS X, 1, 74–85, 1965.
HESSD
3, 2523–2558, 2006 Runoff formation at hilsslope S. Scherrer et al. Title Page Abstract Introduction Conclusions References Tables Figures J I J I Back Close Full Screen / EscPrinter-friendly Version Interactive Discussion
EGU Table 1. Details of the 18 experimental sites shown in Fig. 1. Texture: S: content of sand, C:
content of clay; vegetation: m: meadow, p: pasture, f: forest.
Location (Event/s) Soil Classification (FAO 1974) Texture of up-per Layer (A-Horizon) Texture of lower Layer (B-Horizon)
Parent Material Vegetation
Cover Slope Hittnau (1) eutric cambisol S: 57% C: 19% S: 53% C: 21% moraine m 29% Hospental (2/1–6)) eutric cambisol S: 44% C: 14% S: 50% C: 8% gneiss m 31% Sonvilier (3/1–2) eutric cambisol S: 17% C: 35% S: 19% C: 43% moraine p 40% Spreitenbach (4/1–3) eutric cambisol S: 30% C: 28% S: 28% C: 31% moraine f 44% Heitersberg (5/1–4) eutric cambisol S: 35% C: 25% S: 43% C: 26% moraine m 27% Ebersol (6/1–3) eutric ranker-cambisol S: 42% C: 23% S: 47% C: 23% conglo-merate m/p 30% Bauma (7) vertic cambisol S: 31% C: 37% S: 30% C: 36% conglom-erate p 29% Schnebelhorn (8) vertic cambisol S: 30% C: 38% S: 23% C: 43% conglo-merate m 48% St. Imier (9/1–2) vertic cambisol S: 21% C: 47% S: 16% C: 48% limestone p 36% Nenzlingen (10/1–2) rendzina-cambisol S: 14% C: 36% S: 40% C: 19% sandstone p 45% Bilten 1 (11) humic gleysol S: 38% C: 29% S: 30% C: 34% Conglo-merate f 15% Bilten 2 (12) humicgleysol S: 49% C: 29% S: 33% C: 22% conglo-merate f 31% Willerzell Mulde (13/1–4) humic gleysol S: 51% C: 21% S: 55% C: 19% sandstone-colluvium p 36% Blauen (14/1–2) rendzina S: 9% C: 37% S: 27% C: 25% limestone p 35%
Alpe San Gottardo (15) humic podsol S: 52% C: 15% S: 69% C: 5% granite m 41% Gotthard Pass (16) humic podsol S: 80% C: 7% S: 72% C: 5% granite m 38% Therwil (17/1–8) luvisol S: 44% C: 24% S: 50% C: 27% sandstone-shale m 23% Willerzell Hang (18/1–5) ranker S: 58% C: 20% S: 60% C: 19% sandstone p 55%
HESSD
3, 2523–2558, 2006 Runoff formation at hilsslope S. Scherrer et al. Title Page Abstract Introduction Conclusions References Tables Figures J I J I Back Close Full Screen / EscPrinter-friendly Version Interactive Discussion
EGU Table 2. Runoff processes observed at the 18 sites during all experiments performed. (No. 2/1
means site no. 2, first experiment; value in brackets (1): experiment performed one day after the first experiment, a: uncomplete instrumental equipment, b: experiment performed without trench;
24 Table 2. Runoff processes observed at the 18 sites during all experiments performed. (No. 2/1 means site no. 2, first experiment; value in brackets (1): experiment performed one day after the first experiment, a: uncomplete instrumental equipment, b: experiment performed without trench; •: dominant process, ο: subordinate process, T: temporary process. The processes are ranked as fast (e.g. SOF1), delayed (SOF2) and very delayed (SOF3). No trench to measure subsurface flow was made for experiments 2, 3 and 4 at site 2.
No. Location Hortonian
Overland Flow
Saturation Overland Flow
Sub-Surface Flow Deep
Percol a-tion THO F HO F SO F1 SO F2 SO F3 SSF 1 SSF 2 SSF 3 DP 1 Hittnau a 2/1 Hospental a 2/2 Hospental (370) b 2/3 Hospental (382) b 2/4 Hospental (383) b n. a. 2/5 Hospental (392) 2/6 Hospental (393) 3/1 Sonvilier a 3/2 Sonvilier (1) a 4/1 Spreitenbach 4/2 Spreitenbach (4) 4/3 Spreitenbach (6) 5/1 Heitersberg 5/2 Heitersberg (6) 5/3 Heitersberg (7) 5/4 Heitersberg (9) 6/1 Ebersol 6/2 Ebersol (1) 6/3 Ebersol (15) 7 Bauma a 8 Schnebelhorn a 9/1 St. Imier a 9/2 St. Imier (1) a 10/1 Nenzlingen a 10/2 Nenzlingen (1) a 11 Bilten 1 a b 12 Bilten 2 a b 13/1 Willerzell Mulde 13/2 Willerzell M. (1) 13/3 Willerzell M. (5) 13/4 Willerzell M. (6) 14/1 Blauen a 14/2 Blauen (1) a
: dominant process, o: subordinate process, T: temporary process. The processes are ranked as fast (e.g. SOF1), delayed (SOF2) and very delayed (SOF3). No trench to measure subsurface flow was made for experiments 2, 3 and 4 at site 2.
No. Location Hortonian Overland
Flow
Saturation Overland Flow
Sub-Surface Flow Deep
Percola-tion THOF HOF SOF
1 SOF 2 SOF 3 SSF 1 SSF 2 SSF 3 DP 1 Hittnau a 2/1 Hospental a 2/2 Hospental (370) b 2/3 Hospental (382) b 2/4 Hospental (383) b n. a. 2/5 Hospental (392) 2/6 Hospental (393) 3/1 Sonvilier a 3/2 Sonvilier (1) a 4/1 Spreitenbach 4/2 Spreitenbach (4) 4/3 Spreitenbach (6) 5/1 Heitersberg 5/2 Heitersberg (6) 5/3 Heitersberg (7) 5/4 Heitersberg (9) 6/1 Ebersol 6/2 Ebersol (1) 6/3 Ebersol (15) 7 Bauma a 8 Schnebelhorn a 9/1 St. Imier a 9/2 St. Imier (1) a 10/1 Nenzlingen a 10/2 Nenzlingen (1) a 11 Bilten 1 a b 12 Bilten 2 a b 13/1 Willerzell Mulde 13/2 Willerzell M. (1) 13/3 Willerzell M. (5) 13/4 Willerzell M. (6) 14/1 Blauen a 14/2 Blauen (1) a
15 Alpe San Gottardo a
16 Gotthard Pass a 17/1 Therwil a 17/2 Therwil (1) a 17/3 Therwil (566) 17/4 Therwil (567) 17/5 Therwil (615) 17/6 Therwil (616) 17/7 Therwil (646) 17/8 Therwil (647) 18/1 Willerzell Hang a 18/2 Willerzell H. (1) 18/3 Willerzell H. (6) 18/4 Willerzell H. (14) 18/5 Willerzell H. (16) 2548
HESSD
3, 2523–2558, 2006 Runoff formation at hilsslope S. Scherrer et al. Title Page Abstract Introduction Conclusions References Tables Figures J I J I Back Close Full Screen / EscPrinter-friendly Version Interactive Discussion EGU Geneva Bern Basel 1 7 8 10 14 16 3 6 4 Zurich 18 12 13 Alpine Region Pre-Alpine Region Swiss Plateau Jura 15 2 0 50 km
N
5 17 11 9 Alpine Region Fig. 1Fig. 1. Map of Switzerland with the location of the 18 sites where high intensity sprinkling
experiments were performed. The sites were selected to cover the main geological and clima-tological regions of Switzerland. For details see Table 1.
HESSD
3, 2523–2558, 2006 Runoff formation at hilsslope S. Scherrer et al. Title Page Abstract Introduction Conclusions References Tables Figures J I J I Back Close Full Screen / EscPrinter-friendly Version Interactive Discussion EGU B1 B2/Cv TDR - Probes (installed vertically) Collector Tray for Overland Flows
α Slope angle: 20-50% Trench Mineral Soil Humus Tensiometer A Sprinkler TDR - Probes (installed horizontly) Piezometer Rock Collection of Sub-Surface Flow via ditch Fig. 2 4 m 15 m
Fig. 2. The experimental equipment and layout: overland flow and subsurface flow were
mea-sured at a trench at the foot of the hillslope plot. Tensiometers, piezometers and TDR probes installed at different locations and depths were used to monitor the water movements within the soil body of the plot during and after the sprinkling.
HESSD
3, 2523–2558, 2006 Runoff formation at hilsslope S. Scherrer et al. Title Page Abstract Introduction Conclusions References Tables Figures J I J I Back Close Full Screen / EscPrinter-friendly Version Interactive Discussion EGU 0 10 20 30 40 50
Flow and precipitation rate [mm/h]
Fig. 3 -0.7 -0.6 -0.5 -0.4 -0.3 -0.2 -0.1 0 0 1 2 3 Time [h] 0 1 2 3 P3 P4 calc. meas. Piezometers
Piezometric level [m below terrain]
60 calculated measured Flow Subsurface Overland Precipitation 70
Fig. 3. Measured flows and examples of the piezometer and tensiometer measurements of the
third experiment at Willerzell Hang (site 18). Subsurface flow started before overland flow and was more intense than overland flow. The corresponding results of the calculations with the numerical QSOIL model are also shown (dots).
HESSD
3, 2523–2558, 2006 Runoff formation at hilsslope S. Scherrer et al. Title Page Abstract Introduction Conclusions References Tables Figures J I J I Back Close Full Screen / EscPrinter-friendly Version Interactive Discussion EGU Ah Bw Cz R Sandstone 1 2 3 trench
Pipe flow, return flow
very delayed overland flow due to soil saturation (SOF3)
1 1 1 1 2 2 3 weathered bedrock
dominant flow process subordinate flow process
water level at the end of experiment Flow along macropores and highly permeable Layers
Fig. 4
P4
P3
HESSD
3, 2523–2558, 2006 Runoff formation at hilsslope S. Scherrer et al. Title Page Abstract Introduction Conclusions References Tables Figures J I J I Back Close Full Screen / EscPrinter-friendly Version Interactive Discussion EGU 0 -100 -200 -300 -400 0 1 2 Discharge, Precipitation Rate [mm/h]
Soil Suction measured by Tensiometers [cm]
Time [h]
Piezometric Level [m below terrain]
-0.8 -0.6 -0.4 -0.2 0 0 2 4 6 8 10 Time [h] 100 Experiment 2/2 Experiment 2/3 T6 (soil depth: 58cm) P1 (lower end of plot) P3 (middle of plot) T2 (soil depth: 28cm) Fig. 5 0 20 40 60 80 100
Overland Flow Rate
Precipitation Rate Subsurface Flow Rate
-100 -200 -300 -400 Discharge, Precipitation Rate [mm/h]
Soil Suction measured by Tensiometers [cm]
100 0 20 40 60 80 100
Piezometric Level [m below terrain]
-0.8 -0.6 -0.4 -0.2 0 P3 P1 T2 T6 P1 P3 T2 T6 a) b)
Fig. 5. (a) Results from Hospental (site 2) with dry antecedent conditions (left, experiment 2/2)
and(b) with wet initial conditions (right, experiment 2/3). Temporary Hortonian Overland flow
due to hydrophobic effects was initially observed in experiment 2/2. Under wet conditions (experiment 2/3), significant overland flow occurred after the soil was saturated. Below the hydrographs the reaction of selected tensiometers and piezometers show the measured soil water changes of the soils during and after the experiments.
HESSD
3, 2523–2558, 2006 Runoff formation at hilsslope S. Scherrer et al. Title Page Abstract Introduction Conclusions References Tables Figures J I J I Back Close Full Screen / EscPrinter-friendly Version Interactive Discussion EGU 0.2 0.4 0.6 0.8 1 Time (h) Runoff Coefficient ( Σ Q /Σ P ) 1 2 3 4 0 0 13 16 12 5 11 3 18 4 8 7 17 10 1 14, 6 2 15 9 Fig. 6
Fig. 6. The volumetric runoff coefficients (cumulated runoff divided by cumulated precipitation)
observed at the 18 sites when sprinkling of 50 to 100 mm/h on the initially dry soils was applied. Solid lines indicate the dominance of overland flow processes, dashed lines subsurface flow dominance. The numbers refer to the site numbers as listed in Table 1.
HESSD
3, 2523–2558, 2006 Runoff formation at hilsslope S. Scherrer et al. Title Page Abstract Introduction Conclusions References Tables Figures J I J I Back Close Full Screen / EscPrinter-friendly Version Interactive Discussion EGU 0 0.2 0.4 0.6 0.8 1 10-7 10-6 10-5 10-4
Saturated Conductivity of Topsoil ks [m/s] 0 0.2 0.4 0.6 0.8 1 0 10 20 30 40 50 Clay Content of Topsoil [%]
0 0.2 0.4 0.6 0.8 1 0.5 0.7 1 1.2 1.4 Bulk Density of Topsoil
[g/cm3] 0 0.2 0.4 0.6 0.8 1 10 20 30 40 50 60 Slope [%] Runoff Coefficient [ Σ Q / Σ P] of Overland Flow Runoff Coefficient [ Σ Q / Σ P] of Overland Flow Fig. 7
Fig. 7. Volumetric runoff coefficients (cumulated runoff divided by cumulated precipitation)
produced by overland flow after one hour of sprinkling versus the slope of the hillslope, the soil parameters of the top-layer, such as clay content, bulk density and saturated conductivity for relatively dry initial soil conditions at the 18 experimental sites.
HESSD
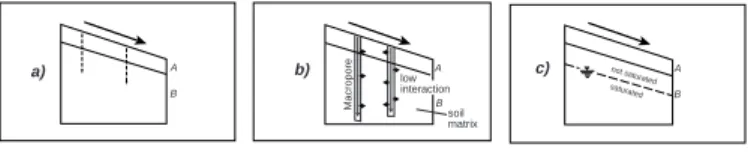
3, 2523–2558, 2006 Runoff formation at hilsslope S. Scherrer et al. Title Page Abstract Introduction Conclusions References Tables Figures J I J I Back Close Full Screen / EscPrinter-friendly Version Interactive Discussion EGU A B A B A B A B Macropore low interaction soil matrix A B not satur ated satur ated a) d) c) b) f) Figure 8.
Different forms of hortonian overland flow (HOF):
8a. Infiltration restricted by a low permeability layer in the A or upper B horizon caused by compaction, dispersion of aggre-gates, hydrophobic humus, C-enrichment by certain vegetation (sites 3, 15, 16) in soils without macropores.
8b. Rapid initial infiltration via macropores, but little uptake by the soil matrix either at the surface or from macropores (site 5). 8c. General low infiltration characteristics (site 13).
Different forms of saturation overland flow (SOF).
8d. On nearly saturated shallow soils, infiltration quickly causes saturation (sites 11,12).
9e. Delayed saturation overland flow (SOF2). High rate of infiltration into shallow soil which becomes saturated up to the surface when all pore space is filled with water (sites 1, 7).
8f. Very delayed saturation overland flow (SOF3). Deep and permeable soils become only saturated up to the surface when all pore space is filled with water. This occurs only during large rainfall events (sites 2, 8,10, 17).
Subsurface flow (SSF):
8f. Rapid subsurface flow (SSF2). Shallow soils over an impervious layer. Good vertical and lateral permeability are required (sites 4, 6, 18).
Deep percolation (DP):
8h). Permeable soils with good verical permeablity in combination with a pervious geology (sites 9,14).
A B e) A B 2 g)
8i. Reasons for the rapid lateral flow (SSF2) at site 18 in detail. Step1: Quick saturation of the upper most A-horizon. Step 2: Initiation of macropore flow and bypassing of the soil matrix.
Step 3: Lateral flow in highly permeable layer above bedrock.
A B 2 h) A B
step 1 step 2 step 3
highly permeable layers, pipes impervious bedrock Macropore i)
HESSD
3, 2523–2558, 2006 Runoff formation at hilsslope S. Scherrer et al. Title Page Abstract Introduction Conclusions References Tables Figures J I J I Back Close Full Screen / EscPrinter-friendly Version Interactive Discussion EGU
Runoff Coefficient
[
Σ
Q
/
Σ
P]
Site 17 (SOF3 / SOF2) Site 2 THOF / SOF20.2
0.4
0.6
0.8
1
0
20
40
60
80
100
120
Time [min.]
0
Fig. 9
dry dry wetFig. 9. Effects of antecedent wetness on runoff and dominant flow processes at sites 2 and 17.
At both sites the dominant process changed from SOF3 under dry conditions to SOF2 under wet conditions.

![Fig. 3 -0.7-0.6-0.5-0.4-0.3-0.2-0.10 0 1 2 3 Time [h]01 2 3P3P4 calc.meas.Piezometers](https://thumb-eu.123doks.com/thumbv2/123doknet/14793581.602557/30.918.236.466.41.500/fig-time-h-p-p-calc-meas-piezometers.webp)