HAL Id: hal-00298126
https://hal.archives-ouvertes.fr/hal-00298126
Submitted on 24 Apr 2006HAL is a multi-disciplinary open access
archive for the deposit and dissemination of sci-entific research documents, whether they are pub-lished or not. The documents may come from teaching and research institutions in France or abroad, or from public or private research centers.
L’archive ouverte pluridisciplinaire HAL, est destinée au dépôt et à la diffusion de documents scientifiques de niveau recherche, publiés ou non, émanant des établissements d’enseignement et de recherche français ou étrangers, des laboratoires publics ou privés.
On the variability of return periods of European winter
precipitation extremes over the last five centuries
A. Pauling, H. Paeth
To cite this version:
A. Pauling, H. Paeth. On the variability of return periods of European winter precipitation extremes over the last five centuries. Climate of the Past Discussions, European Geosciences Union (EGU), 2006, 2 (2), pp.157-189. �hal-00298126�
CPD
2, 157–189, 2006 Return periods of European winter precipitation extremesA. Pauling and H. Paeth
Title Page Abstract Introduction Conclusions References Tables Figures J I J I Back Close Full Screen / Esc
Printer-friendly Version Interactive Discussion Clim. Past Discuss., 2, 157–189, 2006
www.clim-past-discuss.net/2/157/2006/ © Author(s) 2006. This work is licensed under a Creative Commons License.
Climate of the Past Discussions
Climate of the Past Discussions is the access reviewed discussion forum of Climate of the Past
On the variability of return periods of
European winter precipitation extremes
over the last five centuries
A. Pauling1and H. Paeth2
1
Institute of Geography, University of Bern, Hallerstrasse 12, 3012 Bern, Switzerland
2
Meteorological Institute, University of Bonn, Auf dem H ¨ugel 20, 53121 Bonn, Germany Received: 22 February 2006 – Accepted: 18 March 2006 – Published: 24 April 2006 Correspondence to: A. Pauling ([email protected])
CPD
2, 157–189, 2006 Return periods of European winter precipitation extremesA. Pauling and H. Paeth
Title Page Abstract Introduction Conclusions References Tables Figures J I J I Back Close Full Screen / Esc
Printer-friendly Version Interactive Discussion
Abstract
We investigate the changes of extreme European winter (December–February) precip-itation over the last half millennium and show for various European regions that return periods of extremely wet and dry winters are subject to significant changes both before and after the onset of anthropogenic influences. Additionally, we examine the spatial
5
pattern of the changes of the extremes covering the last 300 years where data quality is sufficient. Over central and eastern Europe dry winters occurred more frequently during the 18th and the second part of the 19th century relative to 1951–2000. Dry winters were less frequent during both the 18th and 19th century over the British Isles and the Mediterranean. Wet winters have been less abundant during the last three
cen-10
turies compared to 1951–2000 except during the early 18th century in central Europe. Although winter precipitation extremes are affected by climate change, no obvious con-nection of these changes was found to solar, volcanic or anthropogenic forcing. How-ever, physically meaningful interpretation with atmospheric circulation changes was possible.
15
1 Introduction
The most prominent aspect of climate change is the global warming trend during the 20th century (IPCC, 2001). Beside temperature, however, precipitation is a key climate variable as well, as it affects both human economies and terrestrial ecosystems in different areas of the globe (e.g. Jones and Mann, 2004; Xoplaki et al., 2004; Touchan
20
et al., 2003, 2005). From a societal point of view it may be even more important than temperature as in past centuries crop failures in central Europe were often connected to precipitation anomalies (Pfister, 1999). Even nowadays agricultural success strongly depends on the timely availability of water. Over the past 50 years water demand increased strongly as a consequence of the increase of wealth and irrigation, changes
25
CPD
2, 157–189, 2006 Return periods of European winter precipitation extremesA. Pauling and H. Paeth
Title Page Abstract Introduction Conclusions References Tables Figures J I J I Back Close Full Screen / Esc
Printer-friendly Version Interactive Discussion Precipitation trends have been observed on both global and hemispheric scales
dur-ing the 20th century, which may influence future water supply (Easterldur-ing et al., 2000; Folland et al., 2001; Mann, 2002; Cullen et al., 2002; Touchan et al., 2003, 2005; Xo-plaki et al., 2004). Additionally, water vapour is the most important greenhouse gas and has a strong feedback mechanism to temperature. Hence, a key question is the future
5
changes of precipitation and its extremes at different temporal and spatial scales. Mod-elling studies allow to assess possible changes. A coupled climate model applied by Kharin and Zwiers (2000) suggests that extreme daily precipitation will increase almost everywhere on the globe. However, more profound understanding of the variability of extreme precipitation may help to improve the models and to interpret the model
10
results.
One way to address this question is to analyse past precipitation anomalies. Apart from changes in the mean, changes in the variability is of great importance as the im-pact of changes in extremes on societies is larger than in the mean (Katz and Brown, 1992; Schaeffer et al., 2005; Sch¨ar et al., 2004). So far, most studies dealing with
15
changes in precipitation extremes concentrated on daily data (e.g. Easterling et al., 2000; Frei and Sch ¨ar, 2001; Groisman et al., 1999; Heino et al., 1999; Van den Brink et al., 2005; Zhang et al., 2004). Xoplaki et al. (2005) investigated the change of Eu-ropean spring and autumn temperature extremes over the last 500 years. So far, very few studies deal with changes in European seasonal precipitation extremes (e.g.
Luter-20
bacher et al., 2006).
For the understanding of the climate system, it is crucial to investigate seasonal ex-tremes rather than annual exex-tremes as each season has its specific dynamics and also the impacts on the society are season-specific. Central and northern European precipitation extremes in summer affect harvests (Pfister, 1999), while in the
Mediter-25
ranean region winter precipitation is paramount for water availability over the whole year (Xoplaki, 2002; Xoplaki et al., 2004). Moreover, European winter precipitation can be linked to large-scale circulation, which may help to improve our understanding of the climate system (e.g. Xoplaki et al., 2004; Pauling et al., 2006) whereas summer
CPD
2, 157–189, 2006 Return periods of European winter precipitation extremesA. Pauling and H. Paeth
Title Page Abstract Introduction Conclusions References Tables Figures J I J I Back Close Full Screen / Esc
Printer-friendly Version Interactive Discussion precipitation is more local and reconstructive skill is lower for that season (Pauling et
al., 2006).
A key issue of the present study is whether extremely dry or wet anomalies aver-aged over Europe and subregions have become more extreme in recent decades in the context of the last few centuries. A similar analysis has been performed for the
5
Mediterranean area over the last 500 years (Luterbacher et al., 2006) and European spring and autumn temperature (Xoplaki et al., 2005). In a first step, we present recent precipitation anomalies and compare them with historical analogues. Further, return values of extremely wet and dry winters are estimated and the significance of their changes over the last 500 years is assessed (Paeth and Hense, 2005; Xoplaki et al.,
10
2005; Luterbacher et al., 2006). As climate change may differ regionally, we perform the analyses on a gridpoint basis (0.5◦×0.5◦ resolution, see below) with special re-gard to anomalies during the recent decades (which were presumably influenced by anthropogenic forcing) and seasonal extremes during earlier periods.
This work is structured as follows: Section 2 describes the data and the methods. In
15
Sect. 3 the results are presented, in Sect. 4 they are discussed and in Sect. 5 some conclusions are drawn.
2 Data and methods
For our analyses we use the precipitation reconstructions from Pauling et al. (2006). This dataset is seasonally resolved back to 1500 covering all European land
ar-20
eas (30◦W–40◦E/30◦N–71◦N) on a 0.5◦×0.5◦ grid. It has been developed using precipitation-sensitive proxies including long instrumental series, indices based on doc-umentary evidence and natural proxies (tree-rings, ice cores, coral and speleothem data). These proxies served as input to a Principal Component Regression (PCR) technique which seeks to reconstruct large-scale fields (e.g. Mann et al., 1998, 2005;
25
Jones and Mann, 2004; Luterbacher et al., 2004; Br ¨onnimann and Luterbacher, 2004; Casty et al., 2005; Rutherford et al., 2005; Xoplaki et al., 2005; Pauling et al., 2006).
CPD
2, 157–189, 2006 Return periods of European winter precipitation extremesA. Pauling and H. Paeth
Title Page Abstract Introduction Conclusions References Tables Figures J I J I Back Close Full Screen / Esc
Printer-friendly Version Interactive Discussion As dependent variable the Mitchell and Jones (2005) gridded precipitation dataset has
been used for calibration. Throughout our analyses we use this dataset for the 1901– 2000 period and the Pauling et al. (2006) dataset for the 1500–1900 period. This approach allows to study seasonal precipitation patterns and extremes over whole Eu-rope during 1500–2000. We restrict our analyses to the winter (here defined as the
5
sum of December, January and February) season, as this allows dynamic interpreta-tion and may contribute most to the understanding of the climate system. Addiinterpreta-tionally, reconstructive skill is highest for the winter season (Pauling et al., 2006).
We define climate extremes as k-year return values (RVs) of seasonal sums of pre-cipitation as estimated from Gamma distributions fitted to the data (Paeth and Hense,
10
2005; Xoplaki et al., 2005; Luterbacher et al., 2006). The return period (RP) k associ-ated with a given RV is defined as the inverse of the probability that the RV is reached or exceeded assuming Gamma distribution. Seasonal precipitation is generally believed to follow this distribution (Dunn, 2004).
To investigate the changing RPs we selected different areas with reliable
reconstruc-15
tions back to 1500 (Pauling et al., 2006). Then we selected some years of the modern (1951–2000) period that have been anomalously dry or wet. Using different subperi-ods between 1500 and 2000 we estimated the parameters of the Gamma distribution and calculated the corresponding RPs given specific RVs during these subperiods (Ta-bles 1 and 2). In a second analysis, we estimated RVs for several RPs for a moving
20
50-year-window over the period 1500–2000. These results provide insight in how vari-able the recurrence of extreme seasonal winter precipitation has been over the last 500 years and in whether recent precipitation trends are unusual in the light of past precipitation variability (Figs. 2, 3, 4 and 5).
To analyse the spatial differences of the change in RPs, we performed the following
25
experiment: First, we selected all gridpoints that have reconstructive skill (Pauling et al., 2006). Reconstructive skill is measured by the Reduction of Error (RE) values. Any reconstruction with RE>0 can be considered as skilful (e.g. Cook et al., 1994). Second, we determined the RVs that have a RP of 20 years for every gridpoint during 1951–
CPD
2, 157–189, 2006 Return periods of European winter precipitation extremesA. Pauling and H. Paeth
Title Page Abstract Introduction Conclusions References Tables Figures J I J I Back Close Full Screen / Esc
Printer-friendly Version Interactive Discussion 2000 assuming Gamma distribution (the results do not significantly change if other RPs
are calculated, not shown). Third, using these RVs we estimated the RPs based on Gamma distributions whose parameters were estimated using 50-year-periods back to 1700. We chose periods of 50 years to ensure that 20-year-events are likely to occur. Fourth, the significance of these changes were estimated by applying a Monte
5
Carlo sampling approach (Paeth and Hense, 2005). Similar to Xoplaki et al. (2005) we performed 1000 parametric bootstrap simulations and estimated confidence intervals for the RV estimates. These confidence intervals are based on the standard deviation and the quantiles of the bootstrap samples. A change of RPs significant at the 1% level is reached if the 90% confidence intervals of the associated RVs do not overlap
10
between two subperiods (Kharin and Zwiers, 2000; Park et al., 2001).
3 Results
The gridded precipitation reconstructions by Pauling et al. (2006) allow analyses of recent and past patterns of European precipitation. To investigate possible differences in patterns and magnitudes between recent and past winter precipitation, we select
15
recent winters that were anomalously dry in various regions and compare them with winters of the reconstruction period (1500–1900) that were drier than normal in the same region. The left panels of Fig. 1 display the spatial distribution of recent dry winter precipitation anomalies for northern Ireland (winter 1956: hereafter, “winter” always refers to the year where the January falls in), southern Spain (1992), eastern Europe
20
(1963) and central Europe (1973). In these regions precipitation could be reconstructed back to 1500 with high reconstructive skill (Pauling et al., 2006). They are marked by the black rectangles in Fig. 1. The corresponding RPs of these winters in these regions are given in Table 1: In eastern Europe, southern Spain and northern Ireland such dry winters are estimated to occur every 6–7 years on average during 1951–
25
2000. The middle panels of Fig. 1 show the precipitation distributions of some years of the reconstruction period that were drier than normal in the same regions, and the
CPD
2, 157–189, 2006 Return periods of European winter precipitation extremesA. Pauling and H. Paeth
Title Page Abstract Introduction Conclusions References Tables Figures J I J I Back Close Full Screen / Esc
Printer-friendly Version Interactive Discussion right panels show the spatial distribution of the associated RE values. They show
that the reconstructions of the presented winters are reliable over key regions such as central and eastern Europe, southern Spain, Iceland and parts of the British Isles and Scandinavia.
Both the years 1956 and 1684 were dry in northern Ireland (Fig. 1a and b). However,
5
the precipitation pattern for the rest of Europe looks different for these years: in 1684, central and eastern Europe experienced pronounced dryness whereas in 1956 precip-itation amounts in that area were normal or slightly above average. The patterns differ as well over Scandinavia while over south-western Europe and northern Africa good agreement can be observed. The anomaly patterns for 1992 and 1521 (Fig. 1c and d)
10
are similar except over the central and eastern Mediterranean. In 1992, these areas experienced severe dryness while in 1521 precipitation reached normal amounts. Both winters 1963 and 1743 were anomalously dry in north-eastern Europe (Fig. 1e and f). The absolute anomaly in this region is less pronounced than in other areas because of its relative dryness. The precipitation anomaly pattern of 1963 and 1743 is also similar
15
though the Mediterranean received much more winter precipitation in 1963 than in 1743 (e.g. Xoplaki et al., 2000, 2004). On the other hand the British Isles and south-western Scandinavia were much drier in 1963 than in 1743. The winter 1973 was dry over most parts of Europe while the central Mediterranean and northern Scandinavia were wetter than normal (Fig. 1g). The winter 1696 showed a similar pattern, though less regional
20
details can be observed and the dry anomaly in central and western Europe was more pronounced than in 1973 (Fig. 1h).
To sum up, the spatial distribution of the historical examples is similar to the modern ones. This holds true for most winters and regions (not shown). On the other hand, the historical examples seem to be unable to capture all regional details.
25
Table 1 shows the estimated RPs of the same winters and regions as displayed in the left panel of Fig. 1 for various reference periods (1500–1644, 1645–1715, 1716–1900 and 1951–2000). We divided the reconstruction period into these three subperiods as the Maunder Minimum (1645–1715) is well-known for circulation regimes and
anoma-CPD
2, 157–189, 2006 Return periods of European winter precipitation extremesA. Pauling and H. Paeth
Title Page Abstract Introduction Conclusions References Tables Figures J I J I Back Close Full Screen / Esc
Printer-friendly Version Interactive Discussion lies that were different from other periods (Luterbacher et al., 2001, 2002a, b; Shindell
et al., 2001; Xoplaki et al., 2001, 2005). Comparing this period with 1951–2000 may provide insights into the interactions of forcing factors, circulation regimes and precipi-tation extremes.
When using the 1951–2000 reference period, the presented dry winters are expected
5
to occur every 6–7 years (Table 1). Only the winter 1973 has an estimated RP of 17 years in central Europe. When referring to the 1500–1644 period, these winters were significantly (at the 1%-level) less frequent with RPs of tens to few hundreds of years. During the Maunder Minimum these events tended to occur more infrequently as well except for central Europe where such dry winters are estimated to have been four
10
times more frequent than during 1951–2000. In the 1716–1900 period, the change of frequencies of dry winters is relatively small compared to 1951–2000 except in central Europe where they were twice as probable as during the reference period 1951–2000. Similar to Table 1, Table 2 presents the RPs for selected wet winters. They are expected to occur every 4–8 years during 1951–2000. For almost all other reference
15
periods the RPs are estimated to be significantly higher. Only the expected frequencies of wet winters in central Europe during 1645–1900 have been comparable to 1951– 2000.
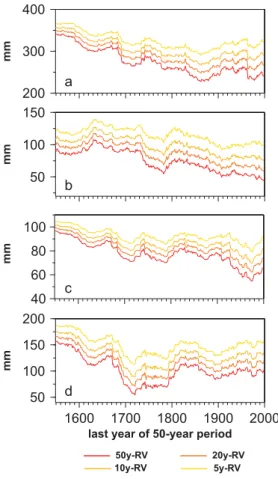
Figure 2 presents the estimated RVs of dry winter extremes in four regions (see rect-angles in Fig. 1) with RPs of 5, 10, 20, and 50 years. These regions were selected
20
for their reliable reconstructions back to 1500 (Pauling et al., 2006). The RVs are es-timated for 50-year windows from 1500 to 2000 based on 1000 bootstrap samples, taking into account the inaccuracy of the data (Xoplaki et al., 2005). Over northern Ireland (Fig. 2a) the RVs gradually decreased since 1500, i.e. extremely dry winters became more severe. Additionally, some interdecadal fluctuations can be observed.
25
The RVs over southern Spain (Fig. 2b) and over north-eastern Europe (Fig. 2c) show an overall negative trend since 1500 with superimposed interdecadal fluctuations. The temporal evolution of the RVs in central Europe (Fig. 2d) is characterized by a strong negative trend from 1500 to around 1720. Thereafter, the RVs increased until the early
CPD
2, 157–189, 2006 Return periods of European winter precipitation extremesA. Pauling and H. Paeth
Title Page Abstract Introduction Conclusions References Tables Figures J I J I Back Close Full Screen / Esc
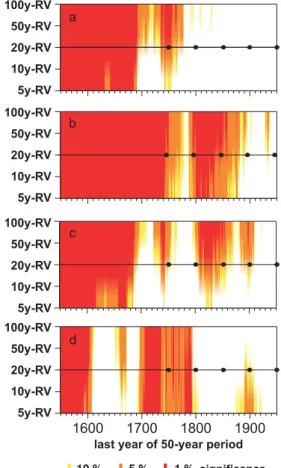
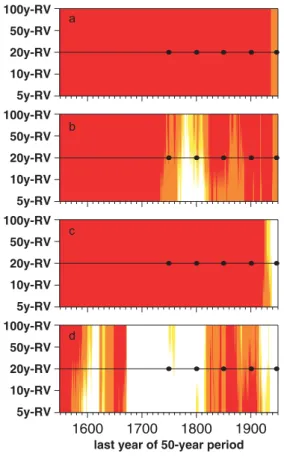
Printer-friendly Version Interactive Discussion 19th century and remained at that level. Significance estimates of these changes
rela-tive to 1951–2000 are given in Fig. 3. Over northern Ireland the RVs were significantly different from 1951–2000 before around 1750, while over southern Spain this was the case up to 1900 (Fig. 3a and b). Over north-eastern Europe the RVs were different from 1951–2000 only before 1700, while over central Europe the RVs during the 16th
5
century and during the period 1650–1750 differed significantly from 1951–2000 (Fig. 3c and d).
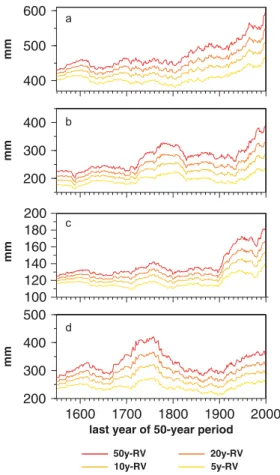
Similar to Fig. 2, Fig. 4 displays the estimated RVs of wet winter extremes. The RVs in northern Ireland (Fig. 4a) are dominated by a positive trend, which is enhanced during the 20th century. Interdecadal fluctuations are superimposed. The RVs over
10
southern Spain (Fig. 4b) are characterized by a peak during the second half of the 18th century and by a positive trend during the 20th century. The RVs in north-eastern Europe (Fig. 4c) feature similar characteristics. In central Europe (Fig. 4d) the RVs peak around 1750, suggesting severe wet extremes during that time. Another feature is the positive trend during the 20th century. However, the RVs do not reach the levels
15
of 1750. Significance estimates of these changes relative to 1951–2000 are given in Fig. 5. All RVs are significantly different from 1951–2000 except over southern Spain around 1800 and over central Europe during the 18th century.
To sum up, the dry winter extremes generally got more severe in the course of the past 500 years. This holds for all investigated regions except for central Europe where
20
during the Maunder Minimum dry extremes were around four times more probable than during 1951–2000 (Table 1). In addition, strong interdecadal fluctuations are su-perimposed on this trend (Fig. 2). The wet RVs generally increased as well over the 1500–2000 period except in central Europe where during the Maunder Minimum wet extremes were as probable as during 1951–2000 (Fig. 4 and Table 2). Moreover, the
25
RVs of different RPs vary rather synchronously over the last 500 years.
Figure 6 presents the spatio-temporal variation of RPs of dry extremes, which had a RP of 20 years during 1951–2000. We analyse events with an estimated RP of 20 years to ensure adequate occurrence during the investigated 50-year-periods. The
CPD
2, 157–189, 2006 Return periods of European winter precipitation extremesA. Pauling and H. Paeth
Title Page Abstract Introduction Conclusions References Tables Figures J I J I Back Close Full Screen / Esc
Printer-friendly Version Interactive Discussion significance of changes in the displayed RPs relative to the RPs during 1951–2000 for
the regions marked by the black rectangles in Fig. 6e can be obtained from Fig. 3. As Fig. 6 is based on the 20-year RVs, the horizontal line with the black dots in Fig. 3 (end of the analysed 50-year periods) can be used to determine the significance. We restricted this analysis to the period 1700–2000 as earlier reconstructions lack
recon-5
structive skill over many parts of Europe (except for the regions presented above). Moreover, we only analyse gridpoints with reliable reconstructions over the 1701–1720 period (i.e. RE values larger than 0). We chose this period as benchmark because thereafter the skill generally increases (Pauling et al., 2006).
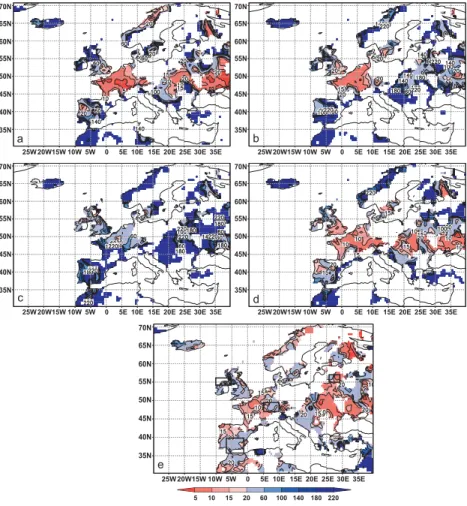
As seen from Fig. 6a dry winters in western and eastern Europe with a RP of 20
10
years during 1951–2000 occurred every 5–10 years during 1701–1750. This change is significant at the 5% level (see corresponding black dot in Fig. 3d). On the other hand, dry winters were less frequent over the Iberian Peninsula, south-eastern Europe and the British Isles. The same situation persists during 1751–1800 over Europe (Fig. 6b) except that in eastern European dry winters were less frequent. During 1801–1850
15
(Fig. 6c) almost over whole Europe dry winters were less frequent than during the 1951–2000 reference period. From 1851–1900 (Fig. 6d) the pattern is again very sim-ilar to the one during the early 18th century (Fig. 6a). The same holds for 1901–1950 (Fig. 6e), although the magnitude of the changes of the RP is less pronounced.
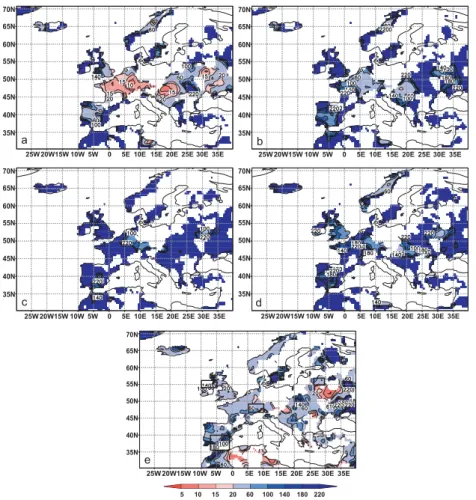
Figure 7 displays the same analysis as Fig. 6 but for wet extremes. The significance
20
of the RPs relative to the RPs during 1951–2000 for the regions marked by the black rectangles in Fig. 7e is given by the black dots in Fig. 5. From 1701–1750 wet winters were up to twice as probable over central Europe and parts of eastern Europe than during the 1951–2000 period (Fig. 7a). This change is, however, not significant at the 10% level (see corresponding black dot in Fig. 5d). From 1750–1950 wet winters were
25
less probable compared to 1951–2000 (Fig. 7b–e) over whole Europe. This change is mostly significant (Fig. 5a–d).
CPD
2, 157–189, 2006 Return periods of European winter precipitation extremesA. Pauling and H. Paeth
Title Page Abstract Introduction Conclusions References Tables Figures J I J I Back Close Full Screen / Esc
Printer-friendly Version Interactive Discussion
4 Discussion
Figure 1 presents precipitation winter anomaly maps for some selected years. They have been chosen for their strong dry anomaly in the region marked by the black rect-angles. Their return values are given in Table 1. The winters of 1992, 1696 and 1743 show similar precipitation distributions (Fig. 1c, f and h). The pattern is not typical for
5
extreme North Atlantic Oscillation (NAO) states, as pronounced anomalies occurred both in central Europe and in western Norway. Indeed, the NAO index revealed ar-bitrary positive and negative anomalies for these winters (1696: +0.55; 1743: –0.01; 1992: –0.22; Luterbacher et al., 2002a). These NAO values were independently constructed from the precipitation reconstructions used in this study, i.e. the two
re-10
constructions share no common predictors. Hence, a different circulation regime has caused these precipitation distributions. Large-scale sea level pressure reconstruc-tions by Luterbacher at al. (2002b) reveal that in 1696, 1743 and 1992 central Europe was dominated by high pressure with a strong gradient towards the north. This also helps to explain the wet conditions in Scotland and western Scandinavia.
15
The winters of 1684 and 1963, however, are typical examples of strong negative NAO phases (Fig. 1b and e). Very dry conditions over the British Isles and south-western Norway coincide with positive precipitation anomalies in the Mediterranean (see also Xoplaki et al., 2001). This observation is supported by the NAO reconstruc-tions by Luterbacher et al. (2002a): For the winter 1684 the NAO value of –2.49 was
20
reconstructed and in 1963 the NAO value was –2.61. These results agree with Luter-bacher et al. (2001) who found increased negative states of the NAO during the period of the Late Maunder Minimum (1675–1715). Shindell et al. (2001), Luterbacher et al. (2004) and Xoplaki et al. (2005) argue that reduced solar irradiance in combination with volcanic activity and internal oscillations may have caused circulation changes that
25
increased the influence of the Russian high which is connected to the advection of cold and dry air masses to central Europe. However, our results suggest that strong pre-cipitation anomalies are not always linked to negative NAO states, especially in central
CPD
2, 157–189, 2006 Return periods of European winter precipitation extremesA. Pauling and H. Paeth
Title Page Abstract Introduction Conclusions References Tables Figures J I J I Back Close Full Screen / Esc
Printer-friendly Version Interactive Discussion Europe (see above). Using a comprehensive climate model, Yoshimori et al. (2005)
found that the influence of forcings on regional climate are often masked by unforced internal variability. Moreover, due to the small signal-to-noise ratio of precipitation, it is particularly difficult to extract the externally forced signal (Yoshimori et al., 2005).
To sum up, the historical patterns are consistent with present-day relationships
be-5
tween precipitation and circulation and can be interpreted in a physical sense. This holds for most of the reconstructed winter precipitation distributions (not shown). How-ever, the spatial details of precipitation variability tend to get lost in the reconstructions compared with the modern examples (Fig. 1). This may be due to reduced reconstruc-tive skill over large parts of Europe during early periods of the reconstructions. Pauling
10
et al. (2006) argue that a limited number of proxies probably cannot capture the full range of spatial precipitation variability even if they are able to capture local precipita-tion. This is especially the case if the proxies are not evenly distributed in space.
Tables 1 and 2 show the changes in RPs of the winters in the region marked by the black rectangles in Fig. 1 (northern Ireland, southern Spain, north-eastern and central
15
Europe). These areas have been selected for their high reconstructive skill back to 1500 (Pauling et al., 2006). During the 1500–1644 period extremes have occurred less frequently than during 1951–2000. This is possibly related to reduced temporal variability of the reconstructions. Reasons may include low numbers, reduced quality or uneven distribution of the available predictors. Thus, it remains uncertain whether
20
reduced variability during the 1500–1644 period is real. At least large fluctuations of the variability can be observed back to 1700, a period with rather reliable reconstructions. Comparison of the Maunder Minimum with the modern period (1951–2000) reveals that in northern Ireland and southern Spain both dry and wet extremes occurred less often (Tables 1 and 2). Rodrigo et al. (1999) report that in southern Spain wet and dry
25
anomalies during the Maunder Minimum lie within the variability of the 20th century. In central Europe, dry extremes were significantly more probable during the Maunder Minimum than during 1951–2000, while there was little change concerning the wet extremes (Tables 1 and 2). This is consistent with Luterbacher et al. (2001) who found
CPD
2, 157–189, 2006 Return periods of European winter precipitation extremesA. Pauling and H. Paeth
Title Page Abstract Introduction Conclusions References Tables Figures J I J I Back Close Full Screen / Esc
Printer-friendly Version Interactive Discussion for central Europe increased cold and dry winters during the Maunder Minimum.
Further uncertainty in the estimation of the RPs may stem from the assumption that the data is Gamma distributed. Seasonal precipitation data generally follow this distri-bution (Dunn, 2004), and the data analysed here is no exception in this respect (not shown). However, misfits do influence the estimation of the probability of extreme
5
events. On the other hand, we also calculated the RPs assuming normal distribution. The results were very similar (not shown). In addition, the uncertainties arising from the data and from the fit of the statistical distribution are accounted for by the Monte Carlo sampling approach (Paeth and Hense, 2005) which was used for the calculations of the RV changes in Figs. 2 and 4 as well as the significance estimates in Figs. 3 and
10
5.
Figures 2 and 4 present estimated RVs for dry and wet extremes with different RPs for 50-year windows over 1500–2000. Figures 3 and 5 give the associated significance estimates relative to 1951–2000. A prominent feature is the increase of the RVs of wet extremes and the decrease of the dry RVs during the 20th century. This implies
15
increased variability. The crucial question is if these features are real climate or merely statistical artefacts. Low variability back in time can be related to predictors that do not capture the full range of spatial and temporal variability (see above). The well-marked breakpoint at 1900 in Fig. 4c may be related to this as at that time the reconstructions end and the gridded data by Mitchell and Jones (2005) are used. However, RVs and
20
RPs do change significantly over time as shown by the last 300 years of the recon-struction (Figs. 3, 5, 6 and 7) at locations with high reconstructive skill. Additionally, the fluctuations of the dry RVs for central Europe (Fig. 2d) are in line with Pfister (1999) who found comparable dry and cold extremes in Switzerland to be non-existent from 1496–1566, while they occurred rarely during the following 110 years and regularly
25
from 1676–1895. This is supported by Wanner et al. (1995) who report that cold winter extremes were particularly frequent during the Late Maunder Minimum. These obser-vations based on documentary evidence are largely coherent with the graphs in Fig. 2d and support the conclusions that the curves reflect some realistic aspects of long-term
CPD
2, 157–189, 2006 Return periods of European winter precipitation extremesA. Pauling and H. Paeth
Title Page Abstract Introduction Conclusions References Tables Figures J I J I Back Close Full Screen / Esc
Printer-friendly Version Interactive Discussion climate variability. However, indices derived from the documentary evidence have also
been used in the reconstructions, hence, they are not independent.
The change in wet RVs in northern Ireland and north-eastern Europe is highly signifi-cant during the 19th and 20th century (Fig. 5a and c). Back to 1800 the reconstructions are based mainly on instrumental measurements (Pauling et al., 2006). Hence, we
ar-5
gue that the observed change for the last 200 years is real. This is supported by the results from southern Spain where the wet RVs between 1750 and 1800 (Fig. 4b) were not significantly different from the late 20th century (Fig. 5b). However, between 1800 and 1950 they are different from 1951–2000 (Fig. 5b). This suggests that recently observed RVs are not exceptional for southern Spain.
10
As seen from Figs. 2 and 4, the range of the RVs during the 16th century was rather small in all regions. From a dynamical point of view it is not likely that variability was reduced for such a long period. The reconstructions for the 16th century rely on only few and not evenly distributed predictors (Pauling et al., 2006). Hence, we argue that the relatively moderate extremes during the 16th century are related to effects during
15
the reconstruction process rather than to real climate changes.
Figures 2d and 4d reveal that extremes became more and more severe in the course of the Maunder Minimum, which implies increasing variability. It is well known that during that period the influence of the Russian high increased during some winters which led to persisting advection of cold and dry continental air (e.g. Wanner et al.,
20
1995; Luterbacher et al., 2001, 2002b, 2004; Xoplaki et al., 2001; Shindell et al., 2001; Jacobeit et al., 2003). On the other hand, also wet winters appear to have recurred (Fig. 4), leading to the observed increase in the year-to-year variability of precipitation. The physical mechanism leading to this change is not completely understood. Shindell et al. (2001) conclude from modelling studies that low solar irradiance forces the NAO
25
toward the low index state. Wanner at al. (2000) argue that sea surface temperatures (SSTs) may have been high in the north Atlantic promoting high pressure over the Atlantic which helped block the westerlies and facilitate the advection of cold and dry continental air to central Europe. Luterbacher et al. (2001) and Shindell et al. (2001)
CPD
2, 157–189, 2006 Return periods of European winter precipitation extremesA. Pauling and H. Paeth
Title Page Abstract Introduction Conclusions References Tables Figures J I J I Back Close Full Screen / Esc
Printer-friendly Version Interactive Discussion further suggest that increasing solar irradiance at the end of the Maunder Minimum
might lead to a strengthening of the NAO through complex interactions between the troposphere and stratosphere, and thus to a general continental warming and wetter conditions in northern Europe.
Figures 6 and 7 provide a spatially detailed view of the changes in the RPs back to
5
1700. Data before that date was not used as reconstructive skill is low in many parts of Europe. Additionally, only areas with reconstructive skill during the 1701–1720 pe-riod are considered (therefore the white areas over parts of Europe). Figure 6 shows that most of western Europe has experienced more frequently dry extremes back to 1700 compared to 1951–2000 except during the first part of the 19th century.
How-10
ever, only the 1701–1750 period was significantly different from 1951–2000 (see black dots in Fig. 3d). Other regions such as Iceland, western Norway, parts of eastern Eu-rope and Turkey experienced less frequently dry winters. These results suggest that the circulation changes over the last centuries affected all regions but in a different way. While in central and eastern Europe circulation changes caused more frequent
15
dry extremes during the 18th century, over most other European regions dry extremes happened less frequently during the same period. During the 1800–1850 period the dry extremes were less frequent than during the 18th century and the second part of the 19th century in central Europe. This is in line with Jacobeit et al. (2001, 2003) who found north-westerly flow over Europe to be dominant during 1830–1850. This
circula-20
tion type advects moist and cold air to central Europe which may also have contributed to the marked and well documented advances of Alpine glaciers such as the Lower Grindelwald Glacier, Switzerland (Zumb ¨uhl, 1980; Zumb ¨uhl et al., 1983; Zumb ¨uhl and Holzhauser, 1988; Steiner et al., 2005a). However, less dry extremes does not nec-essarily mean wetter conditions on average (Katz and Brown, 1992; Schaeffer et al.,
25
2005) which may be more important for the mass balance of glaciers than changes in the extremes. This argument is supported by Steiner et al. (2005b)1 who found from
1
Steiner, D., Pauling, A., Nesje, A., Luterbacher, J., Wanner, H., and Zumb ¨uhl, H. J.: Sensi-tivity of European glaciers to precipitation and temperature – two case studies, Clim. Dynam.,
CPD
2, 157–189, 2006 Return periods of European winter precipitation extremesA. Pauling and H. Paeth
Title Page Abstract Introduction Conclusions References Tables Figures J I J I Back Close Full Screen / Esc
Printer-friendly Version Interactive Discussion a sensitivity study using neural networks that summer temperature was the dominant
factor leading to the advance of the Lower Grindelwald Glacier during the first part of the 19th century.
As seen from Figs. 5 and 7 the wet extremes have been significantly less frequent over all regions during all studied time periods except over central Europe during 1701–
5
1750 (not significant). Hence, the suggested increase of the RVs (see Fig. 4) for the wet years in all four regions (marked by black rectangles in Fig. 7e) is spatially coher-ent. Interestingly, both the wet and dry extremes in central Europe were more frequent during 1701–1750 than during 1951–2000 (Figs. 6a and 7a). During these two pe-riods a positive trend in the NAO is observed (Luterbacher et al., 2002a). The fact
10
that both the dry and wet extremes increased may be explained by the location of this region in the transition zone of the dominating pressure systems (Icelandic low, Azores high and Russian high). Hence, central Europe is possibly affected by only small changes, for instance spatial displacements, of the pressure systems. This may also help to explain the fact that increased winter wetness was spatially limited to
Eu-15
ropean regions between around 45 and 50◦N (Fig. 7a). The frequent wet extremes during 1951–2000 may indicate intensification of the water cycle as a consequence of recent climate change. In addition, the predominantly positive NAO state during the late 20th century may have contributed to the increased wetness over northern Europe as well (e.g. Paeth et al., 1999). However, this contradicts the seemingly more frequent
20
wet winter extremes over the Mediterranean area during 1951–2000 compared to pre-vious periods (Fig. 7), as positive NAO states lead to increased dryness in that area (Hurrell, 1995; Xoplaki et al., 2004). Within-mode variations are a possible reconcil-iation (Jacobeit et al., 2003). Additionally, changes in the mean do not automatically mean corresponding changes in the extremes (Katz and Brown, 1992; Schaeffer et al.,
25
2005; Xoplaki et al., 2005). Moreover, reduced variability in the reconstruction period for the Mediterranean area may be related to reconstruction issues such as the qualitiy, the spatial and temporal distribution of the predictors (Luterbacher et al., 2006).
CPD
2, 157–189, 2006 Return periods of European winter precipitation extremesA. Pauling and H. Paeth
Title Page Abstract Introduction Conclusions References Tables Figures J I J I Back Close Full Screen / Esc
Printer-friendly Version Interactive Discussion Interpretation of the observed changes in extremes requires profound understanding
of the physical mechanisms. However, the link to forcing factors such as solar variabil-ity, volcanic activity and greenhouse forcing is hard to establish (Easterling et al., 2000; Wanner et al., 2001; Yoshimori et al., 2005). Solar activity may play a certain role as the Maunder Minimum (reduced solar irradiance) coincides with increased
precipita-5
tion variability. Still, it is not possible to distinguish between solar influence and the inclusion of new predictors that become available during the Maunder Minimum. The same applies for 20th century greenhouse forcing. Although extremes are influenced by climate change, they are not suited for detection issues as they occur very rarely by definition. Detection of trends of rare extremes requires very long time series (Frei and
10
Sch ¨ar, 2001).
The influence of volcanic events typically persists for only 1–3 years (Robock, 2002; Shindell et al., 2004). Hence, it is not surprising that there is no obvious connection between volcanic events and the observed changes in the extremes, which are anal-ysed using 50-year periods. Additionally, all possible influences by the forcing factors
15
are superimposed by internal variability. The clearest interpretation of the influence of the forcing factors is via circulation changes as proposed above. As the example of the Late Maunder Minimum has shown, the increase of cold and dry winters due to circulation changes have affected very much the probability of extremely dry win-ters. These circulation changes are linked in a complex way to both solar irradiance
20
and volcanoes (Shindell et al., 2001) on different time and space scales, but also to other factors such as the distribution of sea surface temperatures (Wanner et al., 2000; Luterbacher et al., 2001). Establishing the chain of causation is no trivial task. One way to address this task is experiments using physical climate models, an objective for further investigations.
CPD
2, 157–189, 2006 Return periods of European winter precipitation extremesA. Pauling and H. Paeth
Title Page Abstract Introduction Conclusions References Tables Figures J I J I Back Close Full Screen / Esc
Printer-friendly Version Interactive Discussion
5 Conclusions
We investigated the changes of the return periods of seasonal winter precipitation ex-tremes over the last 500 years for various European regions using the reconstructions by Pauling et al. (2006). Additionally, we discussed European precipitation patterns associated with regional anomalies. Winter precipitation anomaly patterns during the
5
1500–1900 period are similar to the ones we observed in the last decades, though the amplitude may have been larger in the past.
We demonstrated that over central Europe dry winters occurred more often during the past 300 years (except 1801–1850) with respect to 1951–2000. On the other hand, wet winters were less frequent (except 1701–1750). Over many other parts of Europe,
10
extremes happened less frequently over the last 300 years compared to 1951–2000. Most of these changes are highly significant. By limiting our analyses spatially and temporally to reliable reconstructed data, we minimized the bias that may stem from reduced reconstructive skill. This increased considerably the confidence in the results obtained.
15
We discussed possible physical mechanisms to explain the observed changes of extremes. The reasons for these changes may include internal oscillations as well as changes in forcing factors (solar variability, volcanic events, greenhouse gases). Further studies are needed to attribute the observed changes in extremes to forcing factors. Additionally, similar analyses could be performed for other seasons. Also,
20
comparisons with model data could further increase the confidence in our conclusions and physical explanations.
Acknowledgements. This work is part of the EU-project SOAP (Simulations, Observations And Palaeoclimate data: climate variability over the last 500 years) the Swiss part being funded by the Staatssekretariat f ¨ur Bildung und Forschung (SBF) under contract 01.0560. Publication
25
of this work was also supported by the Marchese Francesco Medici del Vascello foundation. H. Paeth was supported by the Federal German Ministry of Education and Research (BMBF) under grant No. 07 GWK 02 and by the Ministry of Education, Science and Research (MSWF) of the Federal State Northrhine-Westfalia under grants No. 514-21200200 and No. 223-21200200.
CPD
2, 157–189, 2006 Return periods of European winter precipitation extremesA. Pauling and H. Paeth
Title Page Abstract Introduction Conclusions References Tables Figures J I J I Back Close Full Screen / Esc
Printer-friendly Version Interactive Discussion
The authors also wish to thank J. Luterbacher for fruitful discussions and contributions to this manuscript.
References
Br ¨onnimann, S. and Luterbacher, J.: Reconstructing Northern Hemisphere upper-level fields during World War II, Clim. Dynam., 22, 499–510, doi:10.1007/s00382-004-0391-3, 2004.
5
Casty, C., Wanner, H., Luterbacher, J., Esper, J., and B ¨ohm, R.: Temperature and pre-cipitation variability in the European Alps since 1500, Int. J. Climatol., 25, 1855–1880, doi:10.1002/joc1216, 2005.
Cook, E. R., Briffa, K. R., and Jones, P. D.: Spatial regression methods in dendroclimatology – a review and comparison of two techniques, Int. J. Climatol., 14, 379–402, 1994.
10
Cullen, H. M., Kaplan, A., Arkin, P. A., and Demenocal, P. B.: Impact of the North Atlantic Oscillation on Middle Eastern climate and streamflow, Climatic Change, 55, 315–338, 2002. Dunn, P. K.: Occurrence and quantity of precipitation can be modelled simultaneously, Int. J.
Climatol., 24, 1231–1239, 2004.
Easterling, D. R., Meehl, G. A., Parmesan, C., Changnon, A., Karl, T. R., and Mearns, L. O.:
15
Climate extremes: observations, modeling, and impacts, Science, 289, 2068–2074, 2000. Folland, C. K., Karl, T. P., Christy, J. R., Clarke, R. A., Gruza, G. V., Jouzel, J., Mann, M. E.,
Oerlemans, J., Salinger, M. J., and Wang, S. W.: Observed climate variability and change, in: Chapter 2 of climate change 2001; the scientific basis, edited by: Houghton, J. T., Ding, Y., Griggs, D. J., Noguer, M., van der Linden, P. J., and Xiaoxu, D., Contribution of Working
20
Group I to the Third Assessment Report of the Intergovernmental Panel on Climate Change (IPCC), Cambridge University Press, Cambridge UK, 99–181, 2001.
Frei, C. and Sch ¨ar, C.: Detection probability of trends in rare events: theory and application to heavy precipitation in the Alpine region, J. Climate, 14, 1568–1584, 2001.
Groisman, P. Y., Karl, T. R., Easterling, D. R., Knight, R. W., Jamason, P. F., Hennessy, K. J.,
25
Suppiah, R., Page, C. M., Wibig, J., Fortuniak, K., Razuvaev, N., Douglas, A., Forland, E., and Zhai, P.-M.: Changes in the probability of heavy precipitation: important indicators of climatic change, Climatic Change, 42, 243–283, 1999.
CPD
2, 157–189, 2006 Return periods of European winter precipitation extremesA. Pauling and H. Paeth
Title Page Abstract Introduction Conclusions References Tables Figures J I J I Back Close Full Screen / Esc
Printer-friendly Version Interactive Discussion
C., Rebetez, M., Rosenhagen, G., R ¨osner, S., and Wibig, J.: Progress in the study of climatic extremes in northern and central Europe, Climatic Change, 42, 23–29, 1999.
Intergovernmental Panel on Climate Change (IPCC): Climate change 2001: The scientific ba-sis, edited by: Houghton, J. T., Ding, Y., Griggs, D. J., Noguer, M., Van der Linden, P. J., Dai, X., Maskell, K., and Johnson, C. A., Cambridge University Press, 2001.
5
Jacobeit, J., J ¨onsson, P., B ¨arring, L., Beck, C., and Ekstr ¨om, M.: Zonal indices for Eu-rope 1780–1995 and running correlations with temperature, Climatic Change, 48, 219–241, 2001.
Jacobeit, J., Wanner, H., Luterbacher, J., Beck, C., Philipp, A., and Sturm, K.: Atmospheric circulation variability in the North-Atlantic-European area since the mid-seventeenth century,
10
Clim. Dynam., 20, 341–352, doi:10.1007/s00382-002-0278-0, 2003.
Jones, P. D. and Mann, M. E.: Climate over past millennia, Rev. Geophys., 42, doi:10.1029/2003RG000143, 2004.
Katz, R. W. and Brown, B. G.: Extreme events in a changing climate: variability is more impor-tant than averages, Climatic Change, 21, 289–302, 1992.
15
Kharin, V. V. and Zwiers, F. W.: Changes in the extremes in an ensemble of transient climate simulations with a coupled atmosphere-ocean GCM, J. Climate, 13, 3760–3788, 2000. Luterbacher, J., Rickli, R., Xoplaki, E., Tinguely, C., Beck, C., Pfister, C., and Wanner, H.:
The Late Maunder Minimum (1675–1715) – a key period for studying decadal scale climatic change in Europe, Climatic Change, 49, 441–462, 2001.
20
Luterbacher, J., Xoplaki, E., Dietrich, D., Jones, P. D., Davies, T. D., Portis, D., Gonzalez-Rouco, J. F., von Storch, H., Gyalistras, D., Casty, C., and Wanner, H.: Extending North Atlantic Oscil-lation reconstructions back to 1500, Atm. Sci. Lett., 2, 114–124, doi:10.1006/asle.2001.0044, 2002a.
Luterbacher, J., Xoplaki, E., Dietrich, D., Rickli, R., Jacobeit, J., Beck, C., Gyalistras, D.,
25
Schmutz, C., and Wanner, H.: Reconstruction of Sea-Level Pressure Fields over the Eastern North Atlantic and Europe Back to 1500, Clim. Dynam., 18, 545–561, 2002b.
Luterbacher, J., Dietrich, D., Xoplaki, E., Grosjean, M., and Wanner, H.: European seasonal and annual temperature variability, trends and extremes since 1500, Science, 303, 1499– 1503, 2004.
30
Luterbacher, J., Xoplaki, E., Casty, C., et al.: Mediterranean climate variability over the last centuries; a review, in: The Mediterranean climate: an overview of the main characteristics and issues, edited by: Lionello, P., Malanotte-Rizzoli, P., and Boscolo, R., Elsevier, 2006.
CPD
2, 157–189, 2006 Return periods of European winter precipitation extremesA. Pauling and H. Paeth
Title Page Abstract Introduction Conclusions References Tables Figures J I J I Back Close Full Screen / Esc
Printer-friendly Version Interactive Discussion
Mann, M. E., Bradley, R. S., and Hughes, M. K.: Global-scale temperature patterns and climate forcing over the past six centuries, Nature, 392, 779–787, 1998.
Mann, M. E.: Large-scale climate variability and connections with the Middle East in past cen-turies, Climatic Change, 55, 287–314, 2002.
Mann, M. E., Rutherford, S., Wahl, E., and Ammann, C.: Testing the fidelity of methods used in
5
proxy-based reconstructions of past climate, J. Climate, 18, 4097–4107, 2005.
Mitchell, T. D. and Jones, P. D.: An improved method of constructing a database of monthly climate observations and associated high-resolution grids, Int. J. Climatol., 25, 693–712, 2005.
Paeth, H., Hense, A., Glowienka-Hense, R., Voss, S., and Cubasch, U.: The North Atlantic
Os-10
cillation as an indicator for greenhouse-gas induced regional climate change, Clim. Dynam., 15, 953–960, 1999.
Paeth, H. and Hense, A.: Mean versus extreme climate in the Mediterranean region and its sensitivity to future global warming conditions, Meteorol. Z., 14, 329–347, 2005.
Park, J. S., Jung, H. S., Kim, R. S., and Oh, J. H.: Modelling summer extreme rainfall over the
15
Korean peninsula using Wakeby distribution, Int. J. Climatol., 21, 1371–1384, 2001.
Pauling, A., Luterbacher, J., Casty, C., and Wanner, H.: Five hundred years of gridded high-resolution precipitation reconstructions over Europe and the connection to large-scale circu-lation, Clim. Dynam., 26, 387–405, doi:10.1007/s00382-005-0090-8, 2006.
Pfister, C.: Wetternachhersage: 500 Jahre Klimavariationen und Naturkatastrophen (1496–
20
1995), Verlag Haupt, Bern, 1999.
Rutherford, S., Mann, M. E., Osborn, T. J., Bradley, R. S., Briffa, K. R., Hughes, M. K., and Jones, P. D.: Proxy-based northern hemisphere surface temperature reconstructions: sen-sitivity to methodology, predictor network, target season and target domain, J. Climate, 18, 2308–2329, 2005.
25
Robock, A.: The climatic aftermath, Science, 295, 1242–1244, 2002.
Schaeffer, M., Selten, F. M., and Opsteegh, J. D.: Shifts of means are not a proxy for changes in extreme winter temperatures in climate projections, Clim. Dynam., 25, 51–63, 2005. Sch ¨ar, C., Vidale, P. L., L ¨uthi, D., Frei, C., H ¨aberli, C., Liniger, M. A., and Appenzeller, C.:
The role of increasing temperature variability in European summer heatwaves, Nature, 427,
30
332–336, 2004.
Shindell, D. T., Schmidt, G. A., Mann, M. E., Rind, D., and Waple, A.: Solar forcing of regional climate change during the Maunder Minimum, Science, 294, 2149–2152, 2001.
CPD
2, 157–189, 2006 Return periods of European winter precipitation extremesA. Pauling and H. Paeth
Title Page Abstract Introduction Conclusions References Tables Figures J I J I Back Close Full Screen / Esc
Printer-friendly Version Interactive Discussion
Shindell, D. T., Schmidt, G. A., Mann, M. E., and Faluvegi, G.: Dynamic winter climate re-sponse to large tropical volcanic eruptions since 1600, J. Geophys. Res., 109, D05104, doi:10.1029/2003JD004151, 2004.
Steiner, D., Walter, A., and Zumb ¨uhl, H. J.: The application of a non-linear back-propagation neural network to study the mass balance of Grosser Aletschgletscher, J. Glaciol., 51, 313–
5
323, 2005a.
Touchan, R., Garfin, G. M., Meko, D. M., Funkhouser, G., Erkan, N., Hughes, M. K., and Wallin, B. S.: Preliminary reconstructions of spring precipitation in southwestern Turkey from tree-ring width, Int. J. Climatol., 23, 157–171, 2003.
Touchan, R., Xoplaki, E., Funkhouser, G., Luterbacher, J., Hughes, M. K., Erkan, N., Akkemik,
10
Ue., and Stephan, J.: Reconstructions of spring/summer precipitation for the Eastern Mediterranean from tree-ring widths and its connection to large-scale atmospheric circu-lation, Clim. Dynam., 25, 75–98, 2005.
Van den Brink, H. W., K ¨onnen, G. P., Opsteegh, J. D., Van Oldenborgh, G. J., and Burgers, G.: Estimating return periods of extreme events from ECMWF seasonal forecast ensembles, Int.
15
J. Climatol., 25, 1345–1354, 2005.
Wanner, H., Pfister, C., Brazdil, R., Frich, P., Frydendahl, K., Jonsson, T., Kington, J., Lamb, H. H., Rosenorn, S., and Wishman, E.: Wintertime European circulation patterns during the Late Maunder Minimum cooling period (1675–1704), Theor. Appl. Climatol., 51, 167–175, 1995.
20
Wanner, H., Gyalistras, D., Luterbacher, J., Rickli, R., Salvisberg, E., and Schmutz, C.: Kli-mawandel im Schweizer Alpenraum, vdf Hochschulverlag AG an der ETH, Z ¨urich, 2000. Wanner, H., Br ¨onnimann, S., Casty, C., Gyalistras, D., Luterbacher, J., Schmutz, C.,
Stephen-son, D., and Xoplaki, E.: North Atlantic Oscillation – concepts and studies, Surv. Geophys., 22, 321–382, 2001.
25
Xoplaki, E., Luterbacher, J., Burkard, R., Patrikas, I., and Maheras, P.: Connection between the large scale 500 hPa geopotential height fields and precipitation over Greece during winter time, Clim. Res., 14, 129–146, 2000.
Xoplaki, E., Maheras, P., and Luterbacher, J.: Variability of climate in meridional Balkans during the periods 1675–1715 and 1780–1830 and its impact on human life, Climatic Change, 48,
30
581–615, 2001.
Xoplaki, E.: Climate variability over the Mediterranean, PhD thesis, University of Bern, Switzer-land, 2002.
CPD
2, 157–189, 2006 Return periods of European winter precipitation extremesA. Pauling and H. Paeth
Title Page Abstract Introduction Conclusions References Tables Figures J I J I Back Close Full Screen / Esc
Printer-friendly Version Interactive Discussion
Xoplaki, E., Gonzalez-Rouco, J. F., Luterbacher, J., and Wanner, H.: Wet season Mediter-ranean precipitation variability: influence of large-scale dynamics and trends, Clim. Dynam., 23, 63–78, 2004.
Xoplaki, E., Luterbacher, J., Paeth, H., Dietrich, D., Steiner, N., Grosjean, M., and Wanner, H.: European spring and autumn temperature variability and change of extremes over the last
5
half millennium, Geophys. Res. Lett., 32, L15713, doi:10.1029/2005GL023424, 2005. Yoshimori, M., Stocker, T. F., Raible, C. C., and Renold, M.: Externally forced and internal
variability in ensemble climate simulations of the Maunder Minimum, J. Climate, 18, 4253– 4270, 2005.
Zhang, X., Zwiers, F. W., and Li, G.: Monte Carlo experiments on the detection of trends in
10
extreme values, J. Climate, 17, 1945–1952, 2004.
Zumb ¨uhl, H. J.: Die Schwankungen der Grindelwaldgletscher in den historischen Bild-und Schriftquellen des 12. bis 19. JahrhBild-underts. Ein Beitrag zur Gletschergeschichte und Erforschung des Alpenraumes. Denkschriften der Schweizerischen Naturforschenden Gesellschaft (SNG), Birkh ¨auser, Basel/Boston/Stuttgart, Band 92, 1980.
15
Zumb ¨uhl, H. J., Messerli, B., and Pfister, C.: Die kleine Eiszeit: Gletschergeschichte im Spiegel der Kunst. Katalog zur Sonderausstellung des Schweizerischen Alpinen Museums Bern und des Gletschergarten-Museums Luzern vom 09.06.–14.08.1983 (Luzern), 24.08.–16.10.1983 (Bern), 1983.
Zumb ¨uhl, H. J. and Holzhauser, H.: Alpengletscher in der Kleinen Eiszeit. Sonderheft zum
20
CPD
2, 157–189, 2006 Return periods of European winter precipitation extremesA. Pauling and H. Paeth
Title Page Abstract Introduction Conclusions References Tables Figures J I J I Back Close Full Screen / Esc
Printer-friendly Version Interactive Discussion
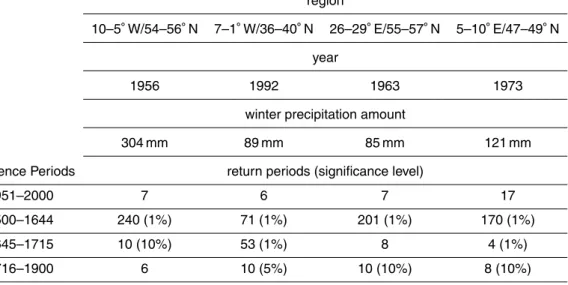
Table 1. Return periods of selected dry modern winters in various regions estimated using
different periods as reference. The significance levels of the changes in RPs relative to 1951– 2000 are given in brackets. For details on the significance calculations see text.
region
10–5◦W/54–56◦N 7–1◦W/36–40◦N 26–29◦E/55–57◦N 5–10◦E/47–49◦N year
1956 1992 1963 1973
winter precipitation amount
304 mm 89 mm 85 mm 121 mm
Reference Periods return periods (significance level)
1951–2000 7 6 7 17
1500–1644 240 (1%) 71 (1%) 201 (1%) 170 (1%)
1645–1715 10 (10%) 53 (1%) 8 4 (1%)
CPD
2, 157–189, 2006 Return periods of European winter precipitation extremesA. Pauling and H. Paeth
Title Page Abstract Introduction Conclusions References Tables Figures J I J I Back Close Full Screen / Esc
Printer-friendly Version Interactive Discussion
Table 2. As Table 1, but for wet winters.
region
10–5◦W/54–56◦N 7–1◦W/36–40◦N 26–29◦E/55–57◦N 5–10◦E/47–49◦N year
1999 1978 1982 1995
winter precipitation amount
480 mm 230 mm 134 mm 286 mm
Reference Periods return periods (significance level)
1951–2000 6 5 4 8
1500–1644 1100 (1%) 50 (1%) 230 (1%) 26 (1%)
1645–1715 113 (1%) 39 (1%) 84 (1%) 7
CPD
2, 157–189, 2006 Return periods of European winter precipitation extremesA. Pauling and H. Paeth
Title Page Abstract Introduction Conclusions References Tables Figures J I J I Back Close Full Screen / Esc
Printer-friendly Version Interactive Discussion
CPD
2, 157–189, 2006 Return periods of European winter precipitation extremesA. Pauling and H. Paeth
Title Page Abstract Introduction Conclusions References Tables Figures J I J I Back Close Full Screen / Esc
Printer-friendly Version Interactive Discussion
Fig. 1. European winter (DJF) precipitation anomaly maps [mm] relative to 1951–2000. The
left panels show modern winters that have been very dry in the region marked by the black rectangles. For the return period of the modern extremes in these regions see Table 1. The middle panels show winters taken from the reconstructions (1500–1900) that were anomalously dry in the same region. (a), (b): northern Ireland (10–5◦W/54–56◦N),(c), (d): southern Spain
(7–1◦W/36–40◦N),(e), (f): north-eastern Europe (26–29◦E/55–57◦N),(g), (h): central Europe
CPD
2, 157–189, 2006 Return periods of European winter precipitation extremesA. Pauling and H. Paeth
Title Page Abstract Introduction Conclusions References Tables Figures J I J I Back Close Full Screen / Esc
Printer-friendly Version Interactive Discussion
Fig. 2. Estimated return values of various dry extremes for 50-year windows over 1500–
2000. For details see the text. (a): northern Ireland (10–5◦W/54–56◦N),(b): southern Spain
(7–1◦W/36–40◦N), (c): north-eastern Europe (26–29◦E/55–57◦N), (d): central Europe (5–
10◦E/47–49◦N). These areas are marked by black rectangles in Fig. 1. For significance of the changes in the return values relative to 1951–2000 see Fig. 3.
CPD
2, 157–189, 2006 Return periods of European winter precipitation extremesA. Pauling and H. Paeth
Title Page Abstract Introduction Conclusions References Tables Figures J I J I Back Close Full Screen / Esc
Printer-friendly Version Interactive Discussion
Fig. 3. Statistical significance of changes in extremely dry winters. All 50-year periods have
been compared against 1951–2000 for various regions. (a): northern Ireland (10–5◦W/54–
56◦N),(b): southern Spain (7–1◦W/36–40◦N),(c): north-eastern Europe (26–29◦E/55–57◦N),
(d): central Europe (5–10◦E/47–49◦N). The black dots at the 20y-RV line mark the significance
CPD
2, 157–189, 2006 Return periods of European winter precipitation extremesA. Pauling and H. Paeth
Title Page Abstract Introduction Conclusions References Tables Figures J I J I Back Close Full Screen / Esc
Printer-friendly Version Interactive Discussion
CPD
2, 157–189, 2006 Return periods of European winter precipitation extremesA. Pauling and H. Paeth
Title Page Abstract Introduction Conclusions References Tables Figures J I J I Back Close Full Screen / Esc
Printer-friendly Version Interactive Discussion
CPD
2, 157–189, 2006 Return periods of European winter precipitation extremesA. Pauling and H. Paeth
Title Page Abstract Introduction Conclusions References Tables Figures J I J I Back Close Full Screen / Esc
Printer-friendly Version Interactive Discussion
Fig. 6. Spatial distribution of return periods for dry winters which had a return period of 20
years during 1951–2000. The displayed return periods are estimated using(a) 1701–1750, (b)
1751–1800,(c) 1801–1850, (d) 1851–1900, (e) 1901–1950. The black rectangles mark the
CPD
2, 157–189, 2006 Return periods of European winter precipitation extremesA. Pauling and H. Paeth
Title Page Abstract Introduction Conclusions References Tables Figures J I J I Back Close Full Screen / Esc
Printer-friendly Version Interactive Discussion
Fig. 7. As Fig. 6, but for wet winters. For significance of the changes in the regions marked by