HAL Id: hal-01174763
https://hal.archives-ouvertes.fr/hal-01174763
Submitted on 7 Sep 2015
HAL is a multi-disciplinary open access
archive for the deposit and dissemination of
sci-entific research documents, whether they are
pub-lished or not. The documents may come from
teaching and research institutions in France or
abroad, or from public or private research centers.
L’archive ouverte pluridisciplinaire HAL, est
destinée au dépôt et à la diffusion de documents
scientifiques de niveau recherche, publiés ou non,
émanant des établissements d’enseignement et de
recherche français ou étrangers, des laboratoires
publics ou privés.
Modeling and Animation of Crisis Management Process
with Statecharts
Elena Kushnareva, Irina Rychkova, Bénédicte Le Grand
To cite this version:
Elena Kushnareva, Irina Rychkova, Bénédicte Le Grand. Modeling and Animation of Crisis
Manage-ment Process with Statecharts. 14th International Conference on Perspectives in Business Informatics
Research (BIR 2015), Aug 2015, Tartu, Estonia. �hal-01174763�
Process with Statecharts
Elena Kushnareva, Irina Rychkova, and B´en´edicte Le Grand
University Paris 1 Panth´eon-Sorbonne, 12, Place de Panth´eon, 75005 Paris, France {irina.rychkova,benedicte.le-grand}@univ-paris1.fr
elena.kushnareva@malix.univ-paris1.fr http://www.univ-paris1.fr/
Abstract. Crisis management process has to comply with various norms and regulations; at the same time, it needs to constantly deal with un-certainty and adapt the process scenario to a current situation. These re-quirements make process design challenging: whereas conventional activity-oriented modeling formalisms ensure process control by design, they pro-vide only limited support for run-time adaptability of a process scenario. State-oriented formalisms can overcome this deficiency and, thus, extend the process designers toolkit. In this paper, we consider the example of a flood management process implemented as a part of the COS Opera-tion Center - a smart city soluOpera-tion developed by COS&HT company in Russia. We examine the existing (BPMN) specification of this process and propose an alternative way to specify the process based on stat-echarts formalism. We model, animate and test the process scenarios with Yakindu Statecharts tools.
Keywords: Statecharts, process simulation, process flexibility
1
Introduction
A natural or technological crisis can occur as a result of an unpredictable se-quence of events, putting lives of people at risk. Crisis management process has to comply with various norms and regulations; at the same time, it needs to constantly deal with uncertainty and adapt the process scenario to a current situation.
Modern city administrations seek to automate crisis management, imple-menting it as a part of their process-aware information systems (PAIS). A PAIS is a software system that manages operational processes involving people and applications based on explicit process models [7].
PAIS design is mostly based on the activity-driven paradigm. According to this paradigm, a process is specified as an ordered set of activities that the system has to execute. This paradigm ensures that the crisis management process is compliant with its norms and regulations ”by design”. However, it supports only limited process flexibility in response to unforeseen situation at run-time.
This is what we experience with the COS Operation Center (COSOC) - a smart city solution developed by the COS&HT company in Russia.
In this paper, we consider the example of a flood management process im-plemented as a part of COSOC. We examine the existing (BPMN) specification of this process and propose an alternative (state-oriented) specification of this process using the statecharts formalism [12].
The statecharts formalism allows a designer to focus on WHAT must be done (i.e., expected outputs or postconditions) instead of HOW it must be done (i.e, concrete activities and their ordering). As a result, the concrete activities that suit best a given situation can be selected or even invented by a process manager at run-time. We call this deferred binding.
Statecharts specifications are executable. In this work, we simulate the stat-echarts specification of the flood management process with YAKINDU SCT (http://statecharts.org/). We show how the instant animation of a process combined with deferred binding of activities improves the process understand-ing, enables interactive (re)design and testing of both mandatory and adaptable process scenarios and paves the road for automated recommendations.
Our findings can be summarised as follows:
- BPMN focuses on activities, their ordering and thus ensures compliance by design. The statecharts formalism, in contrast, focuses on the expected outcomes and allows for deferred binding of activities at run-time. We propose (and en-visage for the future work) to combine these formalisms for crisis management process specification, ensuring at the same time the required degree of control and flexibility.
- YAKINDU SCT provides a simple yet powerful tool for animation of process scenarios. It can be used as a complement to more conventional process spec-ification and analysis techniques. Developing a methodology for state-oriented and simulation-based process design and analysis needs to be addressed in the future.
The remainder of this paper is organized as follows. In Section 2, we discuss the related work. In Section 3, we introduce our running example - the flood management process on Oka River in Moscow Region, Russia. In Section 4, we provide a brief overview of the statecharts formalism. In Sections 5 and 6, we show how the flood management process can be specified with statecharts and animated using Yakindu Statecharts Tools. In Section 7, we draw our conclusions and present the perspective of this work.
2
Related Work
Crisis management is widely addressed by researchers in management science: in [20][8] leading ideas on crisis management in a business environment are pre-sented; in [16][6] the context, concepts and practice of risk and crisis management in the public sector are discussed; in [15], a multidisciplinary approach to crisis management is defined. These works are mostly targeted towards federal agen-cies, city administration, policy makers, practitioners and researchers in
man-agement and business administration. Up to our knowledge, only a few works discuss the challenges of crisis management or its supporting information sys-tems. An example is [17], which highlights the importance of context-awareness in crisis management.
Crisis management process is an example of Case Management Process (CMP). Davenport [4] defines a case management process as a process that is not pdefined or repeatable, but depends on evolving circumstances and decisions re-garding a particular situation, i.e., a case.
Adaptive Case Management (ACM) is a paradigm developed by a group of practitioners [25]. The body of knowledge on ACM has been extensively de-veloped by practitioners; the best solutions are regularly reported in the book series on WfMC Global Awards for Excellence in Case Management [26]. How-ever, methodologies and formalisms for CMP modeling are rarely discussed.
According to ACM [25], CMP must be organized around a collection of data artifacts about the case; the tasks and their ordering shall be adapted at run time, according to the evolution of the case circumstances and case-related data [18].
We agree with the authors of [25] that the conventional, activity-oriented paradigm is very restrictive while specifying case management and crisis man-agement processes in particular. Moreover, we claim that the capacity of PAIS to support process flexibility is inherent to the underlying process modeling paradigm [13].
Up to now, the activity-oriented paradigm remains the mainstream paradigm for PAIS design. Within the activity-oriented paradigm, a process is specified imperatively, as an ordered set of activities that the system has to carry out. Examples of activity-oriented formalisms include BPMN[14], YAWL[1], activity diagrams in UML[23].
To provide better support for process flexibility, activity-oriented formalisms are extended with declarative parts such as constraints or configurable elements [2][22]. Possibilities to add or modify the activities at run-time remain beyond the scope of these approaches.
Whereas the activity-oriented paradigm can be very efficient in specifying highly-regulated crisis management processes, it can hardly support the run-time flexibility and adaptability required while handling the critical situation since it encourages the early binding of activities (at design-time). On the other hand, the product-oriented (or state-oriented) paradigm focuses on scenario adap-tation and supports the deferred binding: at design-time, the process scenario is specified with as a sequence of events; the concrete activities that will produce these events can be selected or even invented at run-time. Examples of product-oriented modeling formalisms include state machines in UML[23], generic state-transition systems or state machines, such as FSM [9] or statecharts by D. Harel [10] created for the specification and analysis of complex discrete-event systems. Several research groups report on approaches to design and specify case man-agement processes based on the product-oriented paradigm: in [19] an approach that combines product- and activity-oriented paradigms is presented. The case
handling paradigm is presented in [3]. Other formalisms extend product-oriented paradigm with the notions of goal and context [21] [24]. These formalisms sup-port automated recommendations and user guidance, providing that for each goal all the situations (states) in which this goal is achievable are known. How-ever, such formalisms focus on high-level system specifications and rarely support process analysis and simulation.
To conclude, we consider that combining an activity-oriented formalism with a state-oriented formalism can provide a process designer with a set of tools to 1) ensure the compliance and control over process execution and 2) better support the run-time process adaptability.
3
Activity-Oriented Model and Process Control
3.1 Flood Management Process in COS Operation Center
The COS operation center (COSOC) is a cross-domain information system de-veloped by COS&HT in Russia. In this paper, we discuss the example of a flood management process, supported by COSOC.
Floods on the Oka River in the Moscow region are seasonal events caused by an increase in the flow of the river, provoked by intensive snow melting during the spring months. Floods on Oka also represent substantial risks for the critical infrastructure facilities situated in the area: a railway bridge, a pontoon road bridge, an electric power plant, industrial storage facilities, etc.
The flood emergency is triggered when the water level in the Oka River rises above 10cm. Table 1 provides a brief description of the major phases of the flood. The flood crisis terminates when the water level gets back to normal, the response operations are terminated and the post-crisis reconstructions begin.
The goal of the flood management process in COSOC is to dispatch the assignments for operation procedures according to the crisis development and in agreement with the the Emergency Management Guidelines [5] defined by by the Ministry for Emergency Situations (MES). The selected procedures are carried out by MES, police taskforce, fire brigades, etc. The execution of the flood management process is monitored and controlled by the COSOC process manager.
The underlying processes in COSOC (including flood management process) are specified with BPMN - an activity-oriented modeling formalism. Fig.1 illus-trates the (simplified) model of the flood management process implemented in COSOC.
3.2 Modeling Flood Management Process with BPMN
Following the flood scenario in Table 1, the BPMN model identifies its major phases and specifies the operation procedures accordingly. The list of events processed by COSOC is presented in Fig. 2-a.
The decision-making logic is modeled with a complex gateway G4 in the BPMN diagram. Here, various operation procedures can be (inclusively) selected.
Fig. 1. The B P MN mo de l of the flo o d managemen t pro cess implemen ted in COSOC
Water level rise
Threats / Expected
con-sequences Response
>10cm Flood Alert Inform citizens, deploy the equipment and set up temporary barriers
>10cm and
keeps rising Flood emergency
Declare emergency situation, evacuate people from the flooded zones; prepare temporary accommodation
> 25cm
Minor damages in living areas; risk of disrupted water supply
Emergency water supply; patrol flooded zones, provide boats and reinforce water barriers
>40cm Risk of severe damage in living areas
Rescue operations; secure bridges and or-ganize deviations
>45cm Disrupted road traffic
Close the pontoon bridge; secure strate-gic infrastructure facilities (industrial stor-ages, factories, electric power plant, etc.)
> 60cm
Severe damages in liv-ing and industrial ar-eas; Risk of presence of toxic substances in the river; Disrupted electric-ity supply
Rescuing operations; chemical and biolog-ical control of water; evacuation of indus-trial storage facilities; temporal accommo-dation for citizens
> 75cm Disrupted railway
com-munication Close the railway bridge
Table 1. Flood Scenario Driven by the changing water level in the Oka River
The provided model ensures (by design) a full compliance with norms and regulations defined by MES for flood management process. It also supports flex-ible scenario execution: the activities defined by G4 can be selected in various combinations, repeated or skipped. However, the model is bound by the num-ber and kind of activities. When complex (unforeseen) situations unfold and predefined activities cannot be accomplished (e.g., due to disrupted telecommu-nication, lack of resources etc.) new activities cannot be added at run-time.
Run-time adaptability of the process scenario can be improved with state-oriented specifications that do not require early (at design) binding of activities to a process scenario.
4
State-Oriented Model and Process Adaptability
4.1 Statecharts
The statecharts formalism specifies a hierarchical state machine (HSM) that ex-tends classical finite state machine (FSM)[9] by providing:
(i) depth - the possibility to model states at multiple hierarchical levels, with the notion of abstraction/refinement between levels;
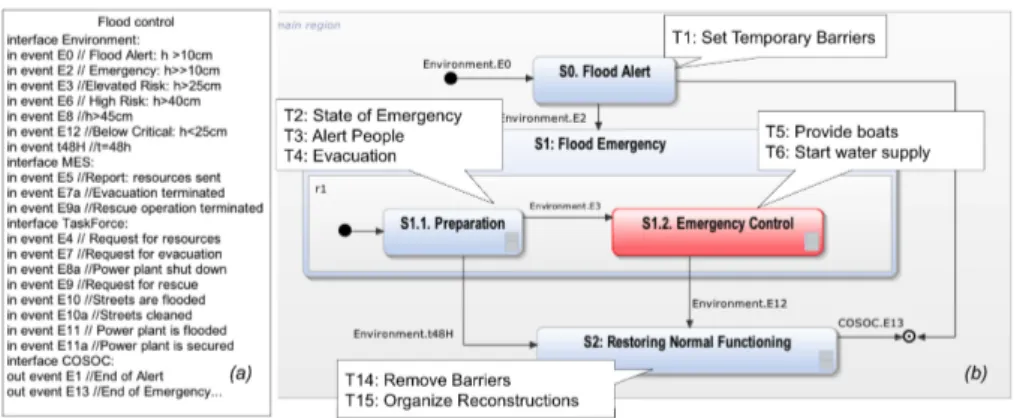
Fig. 2. High-level specification of the flood management process
(ii) orthogonality - the possibility to model concurrent or independent subma-chines within one state machine;
(iii) broadcast communication - the possibility to synchronize multiple concur-rent submachines via events.
A state s ∈ S in statechart represents a state of the system at a given time. A state s consists of a (possibly empty) hierarchy of substates, representing (possibly concurrent) state machines. These substates provide the details about their parent state (or superstate).
The active configuration of a state s is the set of substates of s that are activated at the current moment.
Events that occur in the environment or result from some activity execution trigger state transitions in statecharts. The triggering event e[c] (interpreted as e occurs and c holds ) of a transition t is an event that must occur in order for t to take place. Here e ∈ E is the event that triggers the transition; c ∈ C is a condition that prevents the transition from being taken unless it is true when e occurs; all these parameters are optional.
Some state-oriented approaches (e.g., Petri Net) explicitly associate a state transition with the execution of some activity: they consider a triggering event as an outcome of some concrete activity that is defined at design time. With state-charts, we do not specify the activities and focus uniquely on the expected out-comes (triggering events). We consider that the same outcome can be achieved in different ways and the concrete activity that needs to be executed can be selected or invented in run-time. This is the deferred activity binding that we mentioned in Section 2.
Thanks to the deferred binding, at design-time, the process enactment can be seen as a dynamic selection of activities to produce some outcomes (events) that make the process progress towards its (desired) final state.
States in statecharts can be explicitly associated with the activities that have to be carried out throughout or within this state. Such activities would represent the mandatory procedures for a crisis management process.
The association between states and activities can also be implicit : an activity can be carried out at any state once its precondition is fulfilled (i.e., if it is ”not forbidden for performance at this state”). Therefore, any state of statechart can be associated with a (possibly empty) set of mandatory activities and a (possibly empty) set of optional activities.
In case of unforeseen situations (i.e., when a mandatory activity cannot result in a desired outcome and an expected triggering event does not occur) - the process manager can select an activity from the list of optional activities in order to compensate/resolve the situation and to eventually produce the desired triggering event.
Activities with their preconditions and postconditions can be modeled in a separate model called activity chart [11]. The list of optional activities can be maintained and extended dynamically at run time. New activities can be added to the activity chart by the process manager without affecting the statechart. The activity specification is out of scope for statecharts models and will not be further considered in this paper.
5
Modeling Flood Management Process with Statecharts
5.1 High Level Specification
We start the statecharts specification defining three main states for the flood management process: S0: Flood Alert, S1: Flood Emergency and S2: Restoring Normal Functioning. S1 is refined in two (exclusive) substates: S1.1.: Preparation and S1.2.: Emergency Control. S1.1 is the state where preparations of the city facing the flood are carried out according to the MES regulations in place. S1.2 is triggered when the water level in Oka River rises above 25cm (E3 in the list of Flood control events). The black circle indicates that S1.1 is entered by default once S1 is entered (Fig. 2-b). With this high-level specification, we provide a correspondence with the original BPMN specification (the states are indicated in Fig. 1).
In the statecharts notation states are depicted by rectangular boxes with rounded corners. The substate-superstate relation is depicted by boxes encapsu-lation.
5.2 Introducing Concurrent Areas
We model four different domains of flood management from our example as four concurrent substates of the S1.2 Emergency Control: Living Area, Transport, Electric Power Plant (EPP) and Resources. Concurrent substates are depicted by regions within an AND-superstate separated by dashed lines.
When entering S1.2., the process simultaneously enters the (default) state in each corresponding concurrent substate. Black circles with an outgoing arrow indicate default states.
Living Area sub-machine defines three states: Elevated Risk, High Risk and Unsecured. The transitions between these states describe how a flood will progress
Fig. 3. Explicit resource management
and will be managed: Elevated Risk is entered when the water level h rises above 25cm (E3). The events received from Police Taskforce (e.g., requests for evacua-tion, rescue operations etc.) or from the environment (further rise of water level) trigger the High Risk state. The events E7a, E9a, E10a trigger the transition back to the safer state Elevated Risk. These events result from the execution of some operation procedures (e.g., evacuation, rescue, pumping the water out of the streets or others). The state Unsecured is triggered when the event E4 indi-cating the lack of resources during execution of an operation procedure occurs.
Along those lines Electric Power Plant and Transport concurrent substates define the submachines that show how the corresponding infrastructure objects are managed during the flood. According to the regulations, the power plant must be Shut Down when the water level rises above 40cm (E6). If the water keeps rising there is a risk that this facility will be flooded. Here the Unsecured state is triggered. The Normal Functioning is maintained for the Transport area; when the water h rises above 40cm only Limited Traffic is supported; when the water level h exceeds 45cm threshold the pontoon bridge has to be closed (Bridge Closed).
In our example, each state of the statechart can be associated with the list of mandatory and optional activities that must/can be carried out upon entering, upon exiting and while in this state. With the state-oriented paradigm, the objective of the flood management process can be reformulated as follows: the process participants (i.e., MES and Police Taskforce) should respond to the
events that occur in the environment (e.g., rise of water, weather changes, etc.) by executing the operation procedures and producing the outcomes in order to maintain the secure functioning of the city in specified domains.
6
Simulation with Yakindo Statecharts Tools
We have designed the process specification described previously with the YAKINDU SCT modeler. The YAKINDU simulation environment allows us to instantiate the statecharts specification and to simulate the underlying process. Fig. 4
il-Fig. 4. Simulation of the flood management process with YAKINDU SCT
lustrates an execution of a flood management process modeled in Fig. 3. The process starts when the water level in Oka River rises above 10cm (see the event E0 in Table 1) and enters the state S0 Flood Alert. The event E2 triggers the state S1 Flood Emergency and enters its default (exclusive) substate S1 1 Preparation (Fig. 3).
When the water level rises above 25cm - the S1 2 Emergency Control state is entered.
Fig.4-a illustrates an active configuration of the statecharts upon the real-isation of a sequence of events: E0 → E2 → E3 → E7. When the event E7 (Request for evacuation) occurs, it triggers a transition to the High Risk state of the Living Area region. In response, the process manager assigns the tasks for evacuation.
According to our scenario ”played” in YAKINDU, the water level rises above 40cm (E6) and then above 45cm (E8). These events trigger the corresponding configurations (the latter is shown in Fig.4-b). In response to the threat, specific tasks for securing the power plant (e.g., Pumping water, Evacuating equipment) are assigned by the process manager. One (or several) of such actions produces a desired event E11a (Power plant is secured), which triggers a transition from Unsecured to Shut Down state in our statechart (Fig.4-c).
As the process continues, some of the crisis handling activities (e.g., evacua-tion) produce the E4 (lack of resources) event (Fig.4-d). If it occurs repeatedly, E4 triggers the Federal Alert state (Fig.4-e). The triggering event in our model specifies that this state is activated if the E4 event occurs while the Unsecured state of the Living Area or the Power Plant Unsecured state is active. This mod-els ”an interruption” - a situation of high priority that requires the involvement of military forces or other reserves in order to protect citizens.
When the required resources are available (E5) - the system returns back to the configuration where this interruption occurred - in statecharts and in YAKINDU it is realised by the ”entering by deep history” mechanism The evac-uation operations that were compromised by the lack of resources can continue once the resources are available. Eventually the E7a (evacuation terminated) event is generated. It triggers the return to the Elevated Risk state in the Living Area (Fig.4-f).
The process terminates once the water level comes below critical (E12).
6.1 Mandatory Scenario
Our simulation illustrated in Fig.4 shows the development of flood management process for the following sequence of events:
E0 → E2 → E3 → E7 → E6 → E8 → E11a → E4 → E4 → E5 → E5 → E7a → E12
Fig. 2 shows the high level view of the statecharts model. Here only the transi-tions triggered by external events (i.e., the water level h) are visible:
E0 → E2 → E3 → E12
According to this view, the process can be seen as an execution of predefined operation procedures in response to the water raise. Official norms and regula-tions are usually focused on such mandatory scenarios. Compliance with them is essential for crisis management processes. The list of (mandatory) operation procedures can be specified for each state, similarly to the BPMN specification.
These procedures can be carried out on entering, on exiting, throughout or within a state. The resulting mandatory process scenario can be represented as follows:
E0 − T 1 → E2 − T 2, T 3, T 4 → E3 − T 5, T 6 → E12 − T 14, T 15
The detailed statecharts specification involves not only external but also internal events. Combinations of these events result in unforeseen situations. Moreover, the situations where the execution of mandatory operation procedures are com-promised are not uncommon (the lack of resources is one of the most typical situations). These situations are not considered by the official regulations and require adaptation of activities and scenarios at run-time.
6.2 Adaptable Scenario
The process can be seen as an execution of mandatory procedures defined by MES and other (optional, adapted) activities justified by a concrete situation. We refer to this process scenario as adaptable scenario.
The goal of the process can be seen as ”to maintain a safe state”. This means that at run-time, if the process enters some ”unsafe state”, the process manager will select or propose activities in order to generate an event that shall trigger the transition back to the ”safe state”. In case of ”selection”, the process manager will select among the activities enabled (i.e., with valid precondition) in the Activity chart associated with the process. If the process manager decides to propose a new activity that better suits the situation - she will add the activity into the activity chart by specifying its precondition and its expected outcome. Activity charts remain out of scope for this work.
In Fig. 5 we show the alternative activities that can be carried out at a given state in order to ”produce” a desired event that would trigger a transition to a ”safe” state. For example, in High Risk state of a Living Area submachine, we define two alternative ways to execute the evacuation of people from the flooded areas: by land or by air (when the former is not possible). Both activities, in case of successful termination, can produce the event E7a (evacuation successfully terminated) and thus trigger a transition to Elevated Risk state.
There is more then a single adaptable process scenario that can be realised within the same sequence of events:
a) → E7−T 4 → E7a → ... b) → E7−T 4, T 4a → E7a → ...c) → E7−T 4, T 4a, T 4 → E7a → ...
A more interesting case can be seen for the Resource management area: besides a predefined activity Request Reinforcement that consists in contacting the MES, the process manager defines two other activities that (based on her experience) lead to the same outcome (E5). During the process execution, the alternative activities can be carried out in combination or iteratively until the desired effect is obtained and the transition to Crisis Control is triggered. The corresponding process scenarios that can be realised can look as follows:
a) → E4−T 7 → E5 → ...b) → E4−T 7, T 7, T 7a → E5 → ...c) → E7−T 7b, T 7a → E5 → ...
Note that some of the activities may not even be known at design (e.g., T7b -Call for reinforcements via social media).
Fig. 5. Adaptive scenarios
7
Conclusion and Perspectives
In this paper, we reported on our experience of modeling crisis management process with the statecharts formalism [12]. We also presented the results of the simulations conducted with YAKINDU SCT. Whereas conventional activity-oriented modeling formalisms ensure process control by design, they provide only limited support for run-time adaptability of a process scenario. The formalism of statecharts can overcome this deficiency and, thus, extend the designers toolkit. In particular, it provides capabilities for animated design and paves the road for automated recommendations. In our future work, we are going to further explore these capabilities. Below, we present some of these perspectives.
7.1 Combining Activity-Oriented and State-Oriented Paradigms for Improving Process Flexibility
Business Process Model and Notation (BPMN) is a defacto standard for business process modeling and simulation. Various modeling environments (e.g. Bizagi, Aris, Signavio etc.) support modeling, simulation and validation of the result-ing process models.These and similar tools focus on designresult-ing the activities and combining these activities into scenarios. While the ordering of activities (control flow) can be configured at run-time, the number and kind of activities have to be predefined at design-time. For knowledge-intensive processes such as crisis man-agement, activities are also a subject of run-time adaptation. Such adaptation is not supported by activity-oriented paradigm and its corresponding formalisms. Following the state-oriented paradigm, a process designer does not need to design activities, but only their desired results. As for BPMN, the numbers of states and state transitions in statecharts are explicitly specified at design time. Activities, however, are not associated with state transitions and do not need to be explicitly defined by the model. They can be linked or even defined on fly.
In response to unforeseen situations, the process manager can select from available activities. Thanks to deferred binding, she can also define a new activity better adapted for a situation.
Combining activity-oriented and state-oriented formalisms, we aim to im-prove the process flexibility. With BPMN, we can specify the ”obligatory” part of the process and validate the compliance with norms and regulations. With stat-echarts, we can focus on the adaptive part. The activities prescribed by BPMN can be explicitly linked to statecharts states, whereas the other (optional) list of activities can be maintained on fly by a process manager, providing greater flexibility of a process.
7.2 Exploring Animated Design
Statechart formalism and YAKINDU SCT enable an animated design process for crisis management. The simple yet powerful visual formalism of statecharts allows a process designer to focus on the situations (states) and to reason in terms of ”safe” - ”unsafe” states, setting up the objectives of the process (i.e., ”to maintain the safe state”).
Desired case handling outcomes (events) are designed independently from the activities that actually produce these outcomes. As a result, a process is simu-lated with a sequence of (desired/undesired/external/internal) events whereas a decision about a concrete activities can be made reflecting a concrete situation (an active configuration, a history of previously triggered active configurations, a history of events occured etc.).
Developing a design framework where different process scenarios (desired or undesired events) can be played and analysed is our objective. Such framework can help the domain experts to improve the process and possibly to find some situations that they have never considered before and be prepared to handle them.
7.3 From Management to Recommendations
From the system perspective, the state-oriented paradigm creates a recommen-dation system where the process manager plays the leading role in scenario defi-nition. Unforeseen situations are handled within the system enabling a seamless improvement of the process.
We aim at analyzing situations together with the identification of a desired target state in order to generate recommendations.
References
1. van der Aalst, W., Ter Hofstede, A.H.: Yawl: yet another workflow language. In-formation Systems 30(4), 245–275 (2005)
2. van der Aalst, W., Pesic, M., Schonenberg, H.: Declarative workflows: Balanc-ing between flexibility and support. Computer Science-Research and Development 23(2), 99–113 (2009)
3. van der Aalst, W., Weske, M., Gr¨unbauer, D.: Case handling: a new paradigm for business process support. Data & Knowledge Engineering 53(2), 129–162 (2005)
4. Davenport, T.: Thinking for a living: How to get better performances and results from knowledge workers. Harvard Business Press (2005)
5. The ministry of the Russian Federation for civil defense, e., elimina-tion of consequences of natural disasters: Emergency management guidelines. http://www.mchs.gov.ru/ (2013)
6. Drennan, L., McConnell, A.: Risk and crisis management in the public sector (Routledge masters in public management). Routledge, new edn. (2007)
7. Dumas, M., van der Aalst, W.M., Ter Hofstede, A.H.: Process-aware information systems: bridging people and software through process technology. John Wiley & Sons (2005)
8. Fink, S.: Crisis management: Planning for the inevitable. American Management Association, Reed Business Information, Inc. (1986)
9. Gill, A.: Introduction to the theory of finite-state machines (1962), http://opac. inria.fr/record=b1082931
10. Harel, D.: Statecharts: A visual formalism for complex systems. Science of com-puter programming 8(3), 231–274 (1987)
11. Harel, D., Pnueli, A.: On the development of reactive systems. Springer (1985) 12. Harel, D., Politi, M.: Modeling reactive systems with statecharts: the
STATEM-ATE approach. McGraw-Hill, Inc. (1998)
13. Kushnareva, E., Rychkova, I., Le Grand, B.: Modeling business processes for au-tomated crisis management support: lessons learned. In: IEEE 9th International Conference on Research Challenges in Information Science (RCIS) (2015) 14. OMG: Business process model and notation. http://www.omg.org/spec (2011) 15. Pearson, C., Clair, J.: Reframing crisis management, vol. 23.1. Academy of
man-agement review (1998)
16. Penuel, K., Statler, M., Hagen, R.: Encyclopedia of Crisis Management. SAGE Publications, Inc. (2013)
17. Ploesser, K.: A design theory for context-aware information systems. http://eprints.qut.edu.au/60865/ (2012)
18. Pucher, M.: The elements of adaptive case management. Mastering the Unpre-dictable pp. 89–134 (2010)
19. Reijers, H.A., Limam, S., Van Der Aalst, W.: Product-based workflow design. J. of Management Information Systems 20(1), 229–262 (2003)
20. Review, H.B.: Crisis Management: Mastering the skills to prevent disasters. Har-vard Business Essentials (2004)
21. Rolland, C., Souveyet, C., Moreno, M.: An approach for defining ways-of-working. Information Systems 20(4), 337–359 (1995)
22. Rosemann, M., van der Aalst, W.: A configurable reference modelling language. Information Systems 32(1), 1–23 (2007)
23. Rumbaugh, J., Jacobson, I., Booch, G.: Unified Modeling Language Reference Manual, The (2Nd Edition). Pearson Higher Education (2004)
24. Soffer, P., Yehezkel, T.: A state-based context-aware declarative process model. In: Enterprise, Business-Process and Information Systems Modeling, pp. 148–162. Springer (2011)
25. Swenson, K.: Mastering The Unpredictable: How Adaptive Case Management Will Revolutionize The Way That Knowledge Workers Get Things Do. Meghan-Kiffer Press (2010)
26. Swenson, K., Palmer, N., Manuel, A., Carlsen, S.: Empowering Knowledge Work-ers. BPM and Workflow Handbook Series, Future Strategies Inc. (2013)