Publisher’s version / Version de l'éditeur:
Canadian Geotechnical Journal, 10, pp. 180-192, 1973-05
READ THESE TERMS AND CONDITIONS CAREFULLY BEFORE USING THIS WEBSITE. https://nrc-publications.canada.ca/eng/copyright
Vous avez des questions? Nous pouvons vous aider. Pour communiquer directement avec un auteur, consultez la première page de la revue dans laquelle son article a été publié afin de trouver ses coordonnées. Si vous n’arrivez pas à les repérer, communiquez avec nous à [email protected].
Questions? Contact the NRC Publications Archive team at
[email protected]. If you wish to email the authors directly, please see the first page of the publication for their contact information.
NRC Publications Archive
Archives des publications du CNRC
This publication could be one of several versions: author’s original, accepted manuscript or the publisher’s version. / La version de cette publication peut être l’une des suivantes : la version prépublication de l’auteur, la version acceptée du manuscrit ou la version de l’éditeur.
Access and use of this website and the material on it are subject to the Terms and Conditions set forth at
Measured contact pressures below raft supporting a stiff building
Eden, W. J.; McRostie, G. C.; Hall, J. S.
https://publications-cnrc.canada.ca/fra/droits
L’accès à ce site Web et l’utilisation de son contenu sont assujettis aux conditions présentées dans le site LISEZ CES CONDITIONS ATTENTIVEMENT AVANT D’UTILISER CE SITE WEB.
NRC Publications Record / Notice d'Archives des publications de CNRC:
https://nrc-publications.canada.ca/eng/view/object/?id=c3ca35a9-6e2a-418b-8c6a-f7f815cef4bf
https://publications-cnrc.canada.ca/fra/voir/objet/?id=c3ca35a9-6e2a-418b-8c6a-f7f815cef4bf
Measured Contact Pressures Below Raft Supporting a Stiff
Building'
W.
J. EDEN
Division of Bftildit~g Resenrch, Notional Research Co~mcil of Canada, Otta,vn, Cnnada K1A OR6
G . C. MCROSTIE
McRostie, Seto, Genest anrl Associntes, Geotechnical Engineers, Ottnwn, Canada KIS 4KS
AND
J . S. HALL
J. Strrart Hall and Associates Lin~ited, Strfrctriral Engineers, Ottawo, Canada K2E 6 2 5
Received September 25, 1972 Accepted January 3, 1973
Contact pressures between supporting clay and the foundation raft of a very stiff, 15-storey building indicate that pressures near the edge of the raft were up to three times those near the center. This condition persisted over a 2-year period. The difference in pressure is discussed in the light of the stiffness of the building. The raft design method suggested by an A.C.I. Committee in 1966 is com- pared with the measured performance and found to be reasonable for the raft itself but questionable for the foundation walls above the raft.
Les contraintes au contact entre I'argile portante et le radier de fondation d'un edifice trks rigide de 15 Ctages indiquent que les contraintes prks du bord du radier sont jusqu'a trois fois plus grandes que prks du centre. Cette condition a persist& pendant une periode de 2 ans. L'auteur examine cette diffkrence de contrainte a la lurnikre de la rigidite de I'edifice. En comparant avec le fonctionnement mesure la methode de conception suggeree en 1966 par un cornite de ]'American Concrete Institute, on constate que celle-ci est convenable pour le radier mCrne rnais douteuse pour les murs de fonda- tion au-dessus du radier.
The structural design of reinforced concrete
raft foundations has been for many years
one of the least satisfactory areas of design.
Geotechnical engineers have tended to neglect
it after making estimates of the immediate
and long term settlements produced by an
infinitely flexible surface load; and structural
engineers have tended to start an analysis
with the assumption of
a
soil modulus
constant at all stress levels and unchanging
with time. Concern has been expressed
in the past (Teng 1949; Meyerhof 1965)
and investigators are currently studying the
problem.
Progress has been hampered by the lack
of analytical methods sufficiently simple
to be generally usable, yet based on realistic
assumptions regarding soil behavior. De-
velopments in analysis techniques have been
reported by Barden (1962) and by Sommer
1Presented at the 25th Canadian Geotechnical Confer- ence, Ottawa. December 7-8, 1972.
(1965), who considered the effect of su-
perstructure stiffness, and by Ranganatham
(1967), Rabinovici (1970), and Lin et 01.
(1971).
A major step forward in the development
of procedures acceptable to practising de-
signers occurred in 1966 when the American
Concrete Institute, Committee No. 436 (A.C.1.-
1966) published its report "Suggested design
procedures for combined footings and mats".
These analysis methods recognized tlie con-
tribution of tlie superstructure to total
building
stiffness
and
the
significance
of total building stiffness in comparison
with the stiffness of the soil mass. Greatly
simplified soil reactions are, however, assumed
in tlie A.C.1.-1966 procedure.
Current analysis methods using computer
solutions such as ICES-STRUDL
I1 are
capable of including the assumption of a
soil with variable linear contact pressure
versus
settlement characteristics. The con-
tribution of the stiffness of the superstructure
Can. Geotecli. J. 10. 180 (1973)EDEN BT AL.: MEASURED CONTRACT PRESSURES 181
columns and slabs and of the foundation
mat can also be considered in the analysis.
Calculated or measured vertical deformations
at each column location are used as input
information.
Recent work (DeJong and Morgenstern
1971
;
Heil 1969, 1971) has recognized the
changes that take place in building stiffness
as storeys are added during construction.
The need to include the effects of both short
term settlements related to load additions
and long term consolidation settlements
occurring at constant load has also been
recognized. The effect of creep in structural
materials in reducing stresses caused by
consolidation settlements can also be con-
sidered.
Not many case histories exist in the lite-
rature that give the magnitude and distri-
bution of contact pressures at the bottom
of a raft, but the more useful include the
following: Lazebnik 1970; Gerrard et
01.
1971; Focht et
01.
1971; De Simone and
Gould 1972.
Each new record provides useful back-
ground information for geotechnical and
structural engineers involved in the structural
design of foundations. The building now
reported is not typical of past construction
such as framed, flat slab structures. It is,
instead, typical of an increasing number
of high rise residential buildings that have
reinforced concrete shear walls and hence
are much stiffer in at least one direction
than conventional framed structures. A dif-
ferent distribution of contact pressures might
be expected beneath such stiff buildings.
Site
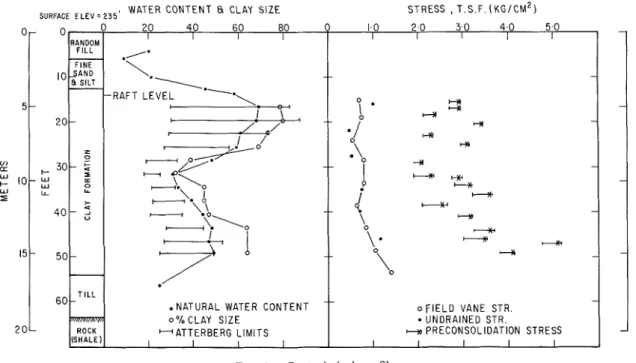
The building is located at the north-east corner of Rideau and Wurtemburg Streets in Ottawa, close to the crest of the slope to the Rideau River. Soils include 6 ft (1.8 m) of random fill over 6 . 5 ft (2 m) of fine sand and silt on a Marine clay formation extending to a depth of 54 ft (16 m); there is 9 ft (2.7 m) of till on the shale bedrock at 63 ft (19 m). This sequence of strata is shown on Fig. 1. With the lower surface of the foundation raft near the top of the clay deposit, the clay deposit is the significant formation affecting the performance of the building.
Two borings were made on site, and continuous 54 nim @ piston samples were taken from one. Results of tests and the boring log are presented on Fig. 1. The test results indicate that the middle 10 ft (3 ni) of clay were quite silty and rather sensitive. Results from this zone are probably more influenced by sample disturbance than results from the upper or lower clay layers. Pre- consolidation deterniinations from standard consolida- tion tests indicate that the clay is overconsolidated by nearly 2t/ft2 (1.95 kg/cm2).
As contact pressure would be influenced by the relative stiffness of the structiire and the clay, some evaluation
E L E V E P I S , WATER C O N T E N T B. CLAY S I Z E STRESS , T . S . F . ~ K G I C M ~ )
-
060 - T I L L . N A T U R A L WATER C O N T E N T -- - o F I E L D V A N E STR.
m ~ ~ m m OXCLAY SIZE
.
U N D R A I N E D STR.R O C K -ATTERBERG LIMITS I-M PRECONSOLIDATION STRESS
ISHALE) I I
I I I I I I I
182 c.-AN. GEOTECII. J. VOL. 10, 1 9 7 3
of a modulus of deformation of the soil mass was re- quired. Attempts were made to determine a pseudo- elastic modulus from undrained triaxial tests. T o mini- mize seating effects the test specimens were subjected to three cycles of loading and unloading, up to a deviator stress of 0.6 kg/cmz. On the fourth loading cycle the secant modulus of the stress-strain curve was measured over the above stress range. The results of these tests are presented in Table 1. The range of Eu (undrained Young's modulus) was from 135 to 910 kg/cmz, with an average of 480 kg/cmz for 12 tests. Previous experience (Burn 1969) has indicated that sample disturbance seriously affects E u , so that the empirical rule of Eu N
1000 S,, (D'Appolonia et a/. 1971) was applied to the field vane strength determinations, giving a value for
Eu of about 1540 k.s.f. (752 kg/cmz).
The modulus was also estimated by back calculation using the settlement measurements. This method has several inherent defects and cannot be expected to give more than the order of magnitude of the modulus:
(a) settlement measurements do not distinguish between consolidation settlements and purely elastic settlements;
(b) load increment varies from 0 to 100% over the construction period ;
(c) elastic rebound is not considered; and
(d) stress distribution is not uniform throughout the clay layer.
Bearing these factors in mind, the first attempt to obtain a modulus used the following assumptions: (a) all settlement from start of measurements to April 1971 (end of loading) were elastic, and were due to a load increment of 1420 Ib/ft2 (0.69 kg/cm2); and (b) stress distribution over thickness of clay stratum was uniform and equal to 0 . 9 times average bearing pressure; a value of 0 . 9 was taken for an average factor from Jumikis' tables (1971) for conditions half-way through the clay layer and under the quarter-point of the long side of the building.
From the formula
E = modulus of elasticity r/ = applied stress = 0.69 kg/cmz
B = width of the foundation = 55 ft or 1680 c n ~
I p = influence factor dependent on length and width of the building and depth of the compressible
layer = 0 . 9 .
E was calculated to be 1040 kg/cml (2130 k.s.f.) and may be compared with a value of E,, equal to 752 kg/cm2 which was previously judged to be the most appropriate single value for purposes of s t r u c t ~ ~ r a l design analysis.
Instrumentation and Measurements
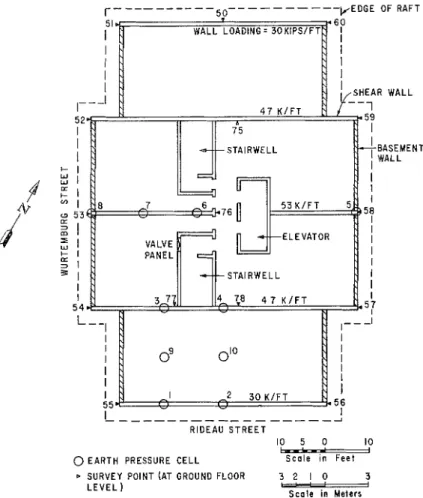
Instrumentation for the building included 10 Gloetzl earth pressure cells, 15 survey reference points and a deep bench mark. The locations of the test installations (with the exception of the bench mark) are shown on Fig. 2.The Gloetzl cells consist of a sealed flat jack ap- proximately 8 x 12 in. (20 x 30 cm) filled with hydraulic oil (Lauffer and Schober 1964). Two tubes lead to a steel membrane encapsulating the oil in the jack. Meas- urements are taken by raising the pressure in the inlet line until oil leaks by a special orifice next to the mem- brane. The minimum pressure required to cause this flow is the pressure of oil inside the cell. Each cell is connected to the reading terminal by its own inlet line of copper tubing. The circuit is completed by a
common return line connected to all cells.
Before the earth pressure cells were installed, a skim slab of lean concrete had been cast directly over the clay subsoil immediately after excavation. Wooden planks left in the skim slab were lifted for the installation of the pressure cells. Each cell was then installed on a carefully prepared surface of ~lndisturbed clay and connected to its lead system. All were installed without difficulty, with the exception of No. 5. At this location the clay seemed to have been somewhat disturbed by excavating equipment and readings were too low. Following installation, all cells and the lead lines were covered with lean concrete and all leads were brought to a common point and taken up vertically through the foundation slab in a short length of pipe. Immediately
TABLE 1. Values of E,, determined from cyclic undrained triaxial tests
Depth Water EL,
content Test No. ft m
%
kg/cm2* k.s.f. 1 82-1-3 16.1 4.90 72.5 417 854 182-1-4 16.5 5.03 71.5 525 1075 182-3-3 22.1 6.74 40.5 135 276 182-3-4 22.5 6.86 67.2 312 639 182-5-2 28.1 8.56 61 .O 267 547 182-5-3 28.5 8.69 54.7 333 682 182-7-5 35.0 10.67 37.5 232 475 182-7-6 35.3 10.76 37.1 606 1241 1 82-9-3 40.1 12.22 44.2 555 1137 1 82-9-4 40.5 12.34 44.7 625 1280 182-1 1-3 46.1 14.05 49.4 909 1862 182-1 1-4 46.5 14.17 50.7 833 1706'Secant modulus determined on fourth loading cycle of test i n range 0-0.6 Irglcm? deviator stress.
E D E N E T .4L.: MEASURED CONTRACT PRESSURES 183 following installation, work proceeded on the placing of
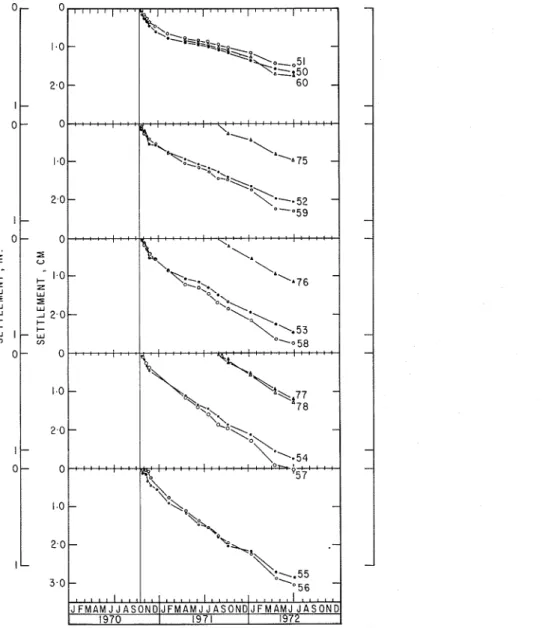
reinforcing steel for the foundation raft. Concrete was placed 3 days later. Readings of contact pressure were made immediately after the slab was placed and at various intervals afterward. The time dependence of the pressure measurements is shown in Fig. 3. The read- ings indicate that high contact pressures developed near the edge of the slab and that they have persisted.
In general, the earth pressure cells appear to have performed satisfactorily, although results for No. 5 have been omitted because of possible disturbance of the clay subsoil. The cells were quite sensitive and measured the effect of wind pressure. This was con- firmed on April 17, 1972 when readings were taken when a wind averaging 15 m.p.h. (24 km/h) was blowing from the northwest; readings were repeated on the following morning when the wind speed did not exceed 3 n1.p.h. (4.8 km/h) from the east. Pressure d ~ ~ e to wind is indica- ted on Fig. 3.
Settlements have been measured with a precise optical levelling system accurate to about 0.004 in. (0.01 cm). Reference points were installed in the ends of the shear walls as soon as possible (at this time work was proceeding on the building frame on the fourth floor). The locations of these points (Nos. 50 to 60) are indicated on Fig. 2.
When the building was completed, f o ~ ~ r additional points (Nos. 75 to 78) were installed on the shear walls near the center of the building. Level readings are taken with reference to a deep bench mark driven to 55 ft outside the building (Bozozuk e l 01. 1962).
Time dependent settlements of the reference points are presented on Fig. 4. Settlements of typical points at the end of load addition and after one year at constant load are presented on Fig. 5. These meas~lrements indicate that the maximum settlement (from October 1970 to June 1972) is 3 cm (1.2 in.) and that a maximum dif- ferential settlement of 1 . 5 cm (0.6 in.) has o c c ~ ~ r r e d between the maximum and minimum points located on diagonally opposite corners.
The Structure
The building is a 15-storey residential
structure on a raft foundation. The framing
is very stiff transverse concrete shearwalls
supporting concrete slabs. The shearwalls
transmit the loads down to the raft and are
cast integrally with a continuous perimeter
- -
- - -- - -
- - - - --
- - --
- - 5 0 p E D G E OF RAFT WALL LOADING= 3 0 K I P S / F T L---
--
- ----
2 RIDEAU S T R E E T 10 5 0 10 0 E A R T H PRESSURE CELL-
SURVEY POINT (AT GROUND FLOOR 3 2 I 0 3
P
S c a l e in Meters
184 C:1hT.
GEOTECII.
J. VOL. 10, 1973foundation wall 10 ft
(3 m) high between the
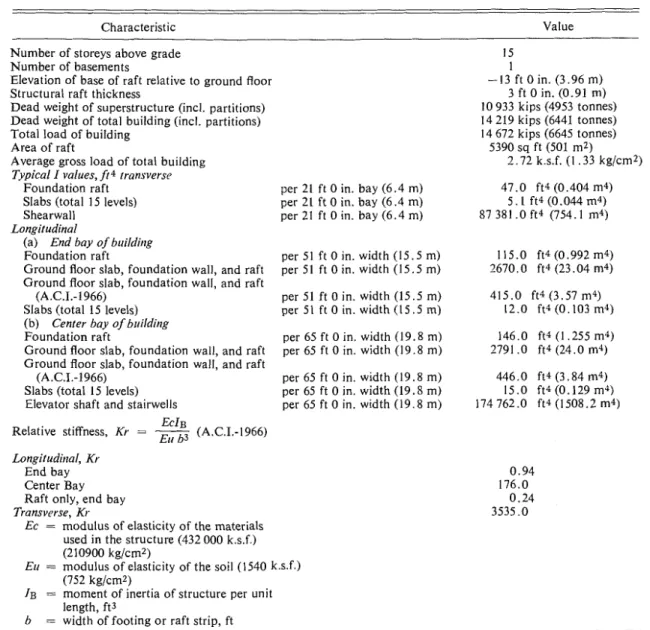
raft and the ground floor. Table 2 gives
some of the pertinent characteristics of the
structure, and Fig. 2 shows the basement
plan of the building and the location of the
instrumentation.
Design Considerations
Rigidity of the superstructure affects the
response of a raft and supporting soil by
redistributing loads from the superstructure
so that differential settlements will be com-
patible with elastic and creep deflections.
This is a complex problem and rigorous
mathematical analysis is not within the scope
of the average design office. One empirical
procedure that can, however, be used to
determine the distribution of soil reactions
is the suggested design procedure for com-
bined footings and mats hereinafter referred
to as A.C.1.-1966. in this procedure, the
relative stiffness (Kr) of the combined stiff-
nesses of footing, superstructure, and framing
members (including shearwalls) in comparison
with the stiffness of the soil determines
whether a straight line distribution or a
distribution governed by elastic subgrade
reaction should be used. As shown in Table 2,
the relative stiffness (Kr) is greater than
0 . 5 except for the raft taken alone. A.C.1.-
1966 recommends that the footings or raft
EDEN ET AL.: MEASURED CONTRACT PRESSURES 185
strips be considered rigid and that variation
of soil pressures be determined by simple
statics.
Design Contact Pressures
Loads imposed on the soils include:
(a) negative load created by excavation
to an average depth of 13 ft 0 in. (3.96 m);
( b ) dead weight of the foundation raft;
(c) dead weight of total building structure;
and
(d) long term sustained live load.
The excavation resulted in a temporary
removal of 1 .30 k.s.f. (0.64 kg/cmz) in the
raft area. The combined average gross
area load of the building, consisting of raft,
dead load, and sustained live load, is 2.72
k.s.f. (1.33 kgIcm2). Loads (c) and (d) are
transmitted to the raft along the transverse
shearwalls. The net average area load of the
building is therefore 1 .42 k.s.f. (0.69 kgIcm2).
Under earthquake or hurricane conditions
the maximum gross bearing pressure at the
edge of the raft, as computed by PIA plus
186
CAN. GEOTECH.
J. VOL. 10, 1973FIG.
5. Settlements along east and west sides of building.5 5 POINTS ON WEST SIDE 5 4 5 3 5 2 51
5 6 POINTS ON EAST SIDE 5 7 5 8 5 9 6 0
1
RAFT1
DISTANCE,
M E T E R S 0 5 10 15 2 0 I I I i DISTANCE , F E E TM c / I analysis, would be 3.25 k.s.f. (1 .59
kg/cm2).
Distribution of soil pressure on the basis
of simple statics, in accordance with the
suggested procedure of A.C.l.-1966, resulted
in a uniform pressure across the building
raft of 2.37 k.s.f. (1 .16 kg/cm2) (Fig. 7).
Because of the compactness of the structure
and its considerable stiffness in both directions
it was the opinion of the designers that edge
contact pressures higher than average should
be assumed, in agreement with the mathe-
matical concept of a rigid plate placed
011an elastic medium.
T o include the effects of soil structure
interaction in pressure distribution that would
reflect higher edge pressures, a pattern of
raft reaction was determined and an iterative
procedure set up for calculating settlement
and corresponding deflections of the structure
below selected reference points. The final
raft reaction was varied until the settlements
and deflections at the various reference
points reached close agreement. As the Kt.
value for the raft alone is less than 0 . 5 ,
the raft strip can be considered flexible so
that pressure will vary according to foundation
modulus theories. A series of rectangular
pressure strips was chosen to represent the
0
actual Dressure distribution for easier com-
OI
putation.
Figure 7 shows the calculated pressure
profiles for a transverse strip along the
center shearwalls, for longitudinal strips on
the center line of the building, and for a strip
midway between the center and the edge.
These strips were also chosen as the 1ocati;ns
for the observation pressure cells. The pro-
files compare pressure distribution (accor-
ding to A.C.1.-1966) with design pressures
and with observed readings for April 1971,
when full dead load was applied t o the
foundation, and for the latest readings
taken in June 1972. April 1971 can be con-
sidered as the end of any elastic movements
dependent on increased loads. June 1972
10 2 0 3 0 4 0 5 0 6 0 7 0 8 0 9 0represents conditions after about 1 year of
movement under constant load.
0 z 0
-
+ Z W z W JE
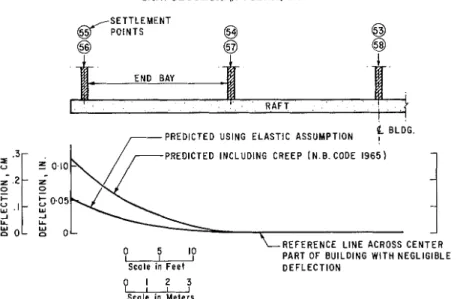
W V) 3Deflection Profiles
Figure 6 shows the calculated deflection
profile for the structure along the center line
of the longitudinal axis of the building.
As may be seen in Table 2, the only important
stiffness in the end bay longitudinal direction
is that from the lowest part of the building.
When the building was completed to the
ground floor, the stiffness
(I) of a n end bay
- z I - - - + Z W z W _I 2 -
E
W V) I-
I I I I I I I I I-
WEST S I D E o y p A P R l L 7 1 - a - ? .---
0-
I I I I IE D E N E T AL.: MEASURED CONTRACT PRESSURES 187
was 2670 ft4 (23.0 m'). The addition of 15
additional levels added only about 12 ft4
(0.103 m4) to the calculated stiffness.
Evaluation of creep effects was based
upon the recommendations of the National
Building Code of Canada 1965, section
4. 5. 4. 9(5), which was in effect when the
building was designed. The ratio of com-
pression steel to tension steel is small, and
a
creep factor of 2 . 0 was used.
Comparison of the observed deflections
with the calculated ones was attempted but
was not satisfactory. The variation in observed
deflections from the north end bay with
that of the south end bay could not be ex-
plained. The amount of observed deflection
at the center line on the longitudinal axis
also disagreed with the calculated deflections
as performed using the stiffnesses as given
in Table 2. Deflections in the transverse
direction are not plotted, but are calculated
to be only 0.004 in. (0.0102 cm) because
of the very great stiffness in the transverse
direction contributed by the shearwalls.
TABLE 2. Structural data
Characteristic Value
Number of storeys above grade Number of basements
Elevation of base of raft relative to ground floor Structural raft thickness
Dead weight of superstructure (incl. partitions) Dead weight of total building (incl. partitions) Total load of building
Area of raft
Average gross load of total building
Typical I values, ft4 transverse
Foundation raft Slabs (total 15 levels) Shearwall
Longitudinal
(a) End bay of blrildit~g
Foundation raft
Ground floor slab, foundation wall, and raft Ground floor slab, foundation wall, and raft
(A.C.1.-1966) Slabs (total 15 levels) (b) Center bay of buildit~g
Foundation raft
Ground floor slab, foundation wall, and raft Ground floor slab, foundation wall, and raft
(A.C.1.-1966) Slabs (total 15 levels) Elevator shaft and stairwells
ECIB
Relative stiffness, Kr =
-
Eli b3 (A.C.1.-I 966)
per 21 ft 0 in. bay (6.4 ~ n )
per 21 ft 0 in. bay (6.4 m) per 21 ft 0 in. bay (6.4 m)
per 51 ft 0 in. width (15.5 rn) per 51 ft 0 in. width (15.5 m)
per 51 ft 0 in. width (15.5 rn) per 51 ft 0 in. width (15.5 rn)
per 65 ft 0 in. width (19.8 m) per 65 ft 0 in. width (19.8 m)
Longitudir~al, Kr
End bay Center Bay Raft only, end bay
Transverse, Kr
Ec = modulus of elasticity of the materials used in the structure (432 000 k.s.f.) (210900 kg/crn2)
Elr = modulus of elasticity of the soil (1540 k.s.f.) (752 kg/crnz)
J B = moment of inertia of structure per unit length, ft3
b = width of footing or raft strip, ft
per 65 ft 0 in. width (19.8 rn) per 65 ft 0 in, width (19.8 m ) per 65 ft 0 in. width (19.8 rn)
15 1 - 3 ft 0 in. (3.96 rn) 3 ft 0 in. (0.91 m) I0 933 kips (4953 tonnes) 14 219 kips (6441 tonnes) 14 672 kips (6645 tonnes) 5390 sq ft (501 rnz) 2.72 k.s.f. (1 .33 kg/cm2) 47.0 ft4 (0.404 m4) 5.1 ft4 (0.044 m4) 87 381.0 ft4 (754.1 m4)
CAN. GEOTECII. J. VOL. 10. 1073
/PREDICTED USING ELASTIC ASSUMPTION f BLDG. PREDICTED INCLUDING CREEP (N.B.CODE 1 9 6 5 )
0 5 10
LREFERENCE
LINE ACROSS C E N T E Rk d - d
PART OF BUILDING WITH NEGLIGIBLE DEFLECTION0 1 2 3
-5
FIG. 6. Calculated deflection of s t r u c t u r e , longitudinal axis.
1
*" SHEAR WALL 4 7 K / F T,
CI1 I I
. : . . . . .
. , . . . . .- . - . .
L
:
. R A F T 0 . 4 5 K S E L : .':.7 6
$
B1PRESSURE CELL LOCATION
ACI 1966
----Flu
UMED FOR DESIGN OF THIS BUILDING4 7 K / F T TRANSVERSE ALONG CENTER SHEAR WALLS
-
-
0 - W a-
--
a O- 2 - A C I 1966---I
0 u LONGITUDINAL ON f. OF BUILDING OBSERVED APRIL 1- , . - -179 Y - - - _ _ _ _ _ _ _ _ _ _ _---
---
---
A C I 1 9 6 6 3 - 2L
OBSERVED
JUNE I 9 7 2 FIG. 7. Pressure d i a g r a m s .EDEN ET ..\I,.: MEASURED
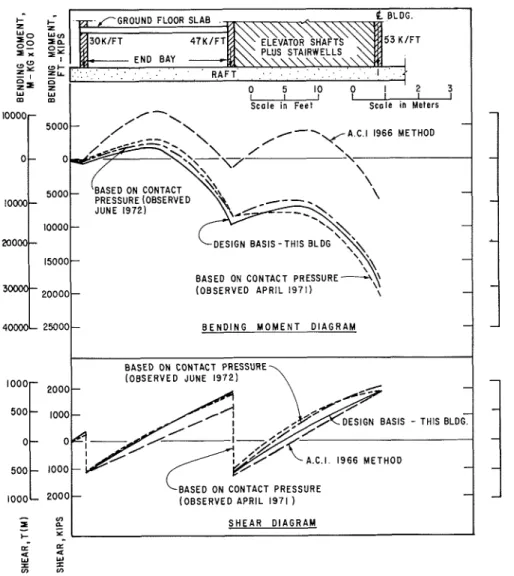
Bending Moment Diagrams
Figure
8 shows the bending moment for
the reinforced concrete raft, calculated for
the same strips as for the previous diagrams.
The bending moment diagrams assume no
differential displacement between shearwalls
and assume that the downward reaction of
the shearwalls on the raft is equal to the
design loads.
CONTRACT PRESSURES 189
Figure 9 gives the bending moment and
shear for the total structure in the longi-
tudinal direction. This includes raft, founda-
tion walls, all floor slabs, elevator shafts,
and stairwells. The values plotted for April
1971 and June 1972 have been adjusted so
that the pressure cell readings equal the
actual load on the structure at that time.
The product of pressure cell readings times
A
I
RAFT 0 4 5 K S F
0 1 2 5 10
n
SCALE IN METERS SCALE IN F E E T8 0 DESIGN BASIS - T H I S BUILDING
BASED ON CONTACT PRESSURES (OBSERVED
2 0 4 0 6 0 8 0
L
L O N G I T U D I N A L ( C E N T E R S T R I P ) (OBSERVED JUNE 1972) (OBSERVED APRIL 1971 1-
-
A.C.1 1966 METHOD - --
d - . - . . . . . . .TYPICAL REINFORCING LONGITUDINAL SECTION PER FOOT WIDTH 0 f ' R A F T
190
CAN.
GEOTECII. J. VOL. 10, 1973the raft area did not equal the building
weight, owing, it was deduced, to the fact
that the contact pressures were highest a t
the extreme edges of the raft where no pres-
sure cells had been installed. The product
of pressure cell readings times raft area
changed with time indicated and a decrease
in probable extreme edge pressures. This
agreed with the expected changes resulting
from redistribution of contact pressures that
would reduce the highest values and increase
the lowest.
There are significant differences between
observed values and values obtained using
the
A.C.T. method for the design of the
superstructure. The results are actually of
more significance in the design of perimeter
foundation walls than for the raft itself.
Raft Reinforcement
Reinforcement used in the raft of this
particular building is illustrated in Fig. 8.
Because the building is relatively narrow,
areas of reinforcement were calculated a t
critical strips and maximum values were
used for the total width. For larger buildings
the areas could be adjusted for each strip,
as dictated by stress requirements.
Conclusions
(1)
Observed contact pressures between
a raft on clay and a stiff building varied
I - . ~ A . C . I 1 9 6 6 M E T H O D
-
BASED ON CONTACT ( O B S E R V E D A P R I L 1 9 7 1 ) \ B E N D I N G M O M E N T D I A G R A M B A S E D ON CONTACT PRESSURE ( O B S E R V E D JUNE 1 9 7 2 ) 1 0 0 0 --
'--BASED ON CONTACT PRESSURE ( O B S E R V E D A P R I L 1 9 7 1 1
FIG. 9. Bending moment and shear diagrams for total structure, longitudinal axis.
-
V)2
a
S H E A R D I A G R A MEDEN ET AL.: MEASURED CONTRACT PRESSURES 191
greatly from a uniform condition, were up
to three times greater at the edge than at
the center, and did not redistribute or equalize
themselves greatly over the first 2 years of
the life of the structure.
(2) The observed pattern of contact pres-
sure distribution did not change significantly
during the construction period. The total
structure increased in stiffness as each storey
was added, but the foundation walls alone,
acting in conjunction with the raft, had
already created a relation where the structure
was very stiff in comparison with the soil
mass. It may be noted that foundation wall
stiffness would not have such an important
effect on buildings of greater length to width
ratio.
(3) A raft designed to A.C.1.-1966 rec-
ommendations would have been adequate
and slightly conservative for this particular,
very stiff, building. Foundation walls im-
mediately above the raft would, however,
need t o be reinforced to resist the large
forces that must be redistributed; these
would not be anticipated by the contact
pressure distributions suggested in the A.C.1.-
1966 method.
(4) Judgement must still play a large
part in raft design. There remain significant
unknown site factors such as laterally varying
soil conditions and irregular soil shrinkage
or swelling conditions, even when design
methods are available that recognize the
relative stiffnesses of building and soil, the in-
crease in building stiffness during construction,
and the effects of differing creep rates of
concrete and soil in reducing stresses due
to long term differential settlements.
Acknowledgments
The investigation reported in this paper
is the result of a joint program conducted
by the consultants, McRostie, Seto, Genest
and Associates, J. Stuart Hall and Associates
Limited, and the Division of Building Re-
search, National Research Council of Canada.
The building is the property of the Ontario
Housing Corporation and is operated by
the Ottawa Housing Authority. Architects
for the building were Miska and Gale Associa-
tes, Ottawa, and developers were Catkey
Construction Limited. The cooperation of
these agencies was freely given. The authors
wish to acknowledge the assistance of various
members of the Geotechnical Section, Di-
vision of Building Research, in the installation
and maintenance of the instrumentation.
AMERICAN CONCRETE INSTITUTE, COMMITTEE 436. 1966. Suggested design procedures for combined footings and mats. Am. Concr. Inst. J. Oct. 1966. BARDEN, L. 1962. Distribution of contact pressure under
foundations. Geotechnique, 12, pp. 181-198. B o z o z u ~ , M., JOHNSTON, G. H., and HAMILTON, J. J.
1962. Deep bench marks in clay and permafrost areas. Am. Soc. Test. Mater. STP 322. pp. 265- 279.
BURN, K. N. 1969. Settlement of high embankment and overpass structures in Ottawa. Can. Geotech. J. 6, pp. 3 3 4 1 .
D'APPOLONIA, D. J., POULOS, H. G., and LADD, C. C. 1971. Initial settlement of structures on clay. Soil Mech. Found. Div., Proc. Am. Soc. Civ. Eng. 97(SMlO) pp. 1359-1377.
DESIMONE, S. V., and GOULD, J. P. 1972. Performance of two mat foundations on Boston clue clay. Am. Soc. Civ. Eng. Spec. Conf. Purdue Univ. 1(2), pp. 935-980.
DEJONG, J., and MORGENSTERN, N. R. 1971. The influence of structural rigidity on the foundation loads of the C.N. Tower, Edmonton. Can. Geotech. J.
8, pp. 527-537.
FOCHT, J. A., KHAN, F. R., and GEMEINHARDT, J. P. 1971. Performance of deep mat foundation of 52 storey, one shell plaza building. Presented Ann. Meet. Am. Soc. Civ. Eng., St. Louis, Oct. 1971. GERRARD, C. M., KURZEME, B. E., ANDREWS, D. C.,
and TOPP, R. 1971. Instrumentation of raft founda- tions in Perth. Proc. First Aust.-N.Z. Conf. Geomech. Melbourne. 1, pp. 361-368.
HETL, H . 1969. Studies on the structural rigidity of reinforced concrete building frames on clay. Proc. 7th Int. Conf. Soil Mech. 2, pp. 115-122. - 1971. The influence of stiffness of reinforced
concrete building frames on the deformation and the stresses of foundation slabs on clay. (In German). Inst. Soil Mech. Found. Eng., Tech. Univ., Darm- stadt. Publ. No. 8.
JUMIKIS, A. R. 1971. Vertical stress tables for uniformly distributed loads on soil. Coll. Eng. Rutgers Univ. Press, Eng. Res. Publ. No. 52.
LAUFFER, H., and SCHOBER, W. 1964. The Gopatsch Rockfill dam in the Kauner Valley. Proc. 8th Congr. Large Dams. 3, pp. 635-660.
LAZEBNIK, G. E. 1970. Investigation of soil pressure distribution under foundation mats of buildings. Soil Mech. Found. Eng. No. 6, pp. 405409. LIN, K. K., SWARTZ, S. E., and WILLIAMS, W. W. 1971.
Beams on one way elastic foundations. J. Boston Soc. Civ. Eng. 58(3), pp. 164-178.
MEYERHOF, G . G . 1965. Shallow foundations. J. Soil Mech. Found. Div., Am. Soc. Civ. Eng. 91(SM2), pp. 21-31.
RABINOVICI, A. 1970. Interaction between structures and s~lbsoil. Bull. Tech. Suisse Rom. 96(9), pp. 131-137.
192 CAN. GEOTECM. J . VOL. 10, 1973
RANGANATHAM, B. V. 1967. Some rational concepts in rigidity of the superstructure. Proc. 6th Int. Conf. the structural design of foundations. Proc. S. E. Soil Mech. 2, pp. 197-201.
Asian Reg. Conf, Soil. Eng. Bangkok, pp. 313-320. TENG, W. C. 1949. Determination of the contact pressures SOMMER, H. 1965. A method for the calculation of against a large raft foundation. Geotechnique, 1,
settlements, contact pressures, and bending moments pp. 222-228. in a foundation including the influence of the flexural