HAL Id: hal-03142233
https://hal.inria.fr/hal-03142233
Submitted on 15 Feb 2021HAL is a multi-disciplinary open access
archive for the deposit and dissemination of sci-entific research documents, whether they are pub-lished or not. The documents may come from teaching and research institutions in France or abroad, or from public or private research centers.
L’archive ouverte pluridisciplinaire HAL, est destinée au dépôt et à la diffusion de documents scientifiques de niveau recherche, publiés ou non, émanant des établissements d’enseignement et de recherche français ou étrangers, des laboratoires publics ou privés.
Rotating algal biofilm versus planktonic cultivation:
LCA perspective
Marjorie Morales, Hubert Bonnefond, Olivier Bernard
To cite this version:
Marjorie Morales, Hubert Bonnefond, Olivier Bernard. Rotating algal biofilm versus planktonic cultivation: LCA perspective. Journal of Cleaner Production, Elsevier, 2020, 257, pp.120547. �10.1016/j.jclepro.2020.120547�. �hal-03142233�
Rotating algal biofilm versus planktonic cultivation: LCA perspective
Marjorie Moralesa*, Hubert Bonnefondb and Olivier Bernarda,c.
a INRIA BIOCORE, BP 93 06902 Sophia Antipolis Cedex, France.
b Inalve S.A., CEEI Nice premium 61 avenue Simone Veil 06200 Nice, France.
c Department of Energy and Process Engineering, Faculty of Engineering, Norwegian University of
Science and Technology (NTNU), NO-7491, Trondheim, Norway
*Corresponding author : marjorie-alejandra.morales@inria.fr. Tel. +33(0)492387180.
Present address: Industrial Ecology Programme, Department of Energy and Process Engineering, Faculty of Engineering, Norwegian University of Science and Technology (NTNU), NO-7491, Trondheim, Norway.
Abstract
Commercial microalgae production with conventional suspended cultures is still facing the challenge of high operational costs related to mixing and harvesting diluted biomass. Attached culture system is an emerging technology for replacing the suspended culture systems, were the biomass grows as a biofilm on a supporting belt that is continuously rotating between the liquid and gaseous phases. Immobilized culture systems have several advantages, when compared to suspended culture systems, such as higher biomass productivity and straightforward harvesting and concentration. Ready-to-use biomass with water content between 80-90% is harvested by simple scrapping, avoiding some dewatering steps. However, additional infrastructures are required increasing material and electricity demands. This study is a comparative pond to gate life cycle assessment of the environmental impacts, energetic and materials demands between the conventional Open Raceways Ponds (ORP) and Rotating Algal Biofilm (RAB), considering large-scale production of Tetraselmis suecica. Two products were analysed: microalgae biomass at 20%-DW and algae meal (protein concentrate powder). The results were also compared with the conventional protein sources, such as soymeal and fishmeal. Considering that both systems achieve the same productivity (20 g·m-2·d-1), the
environmental impacts, measured trough a single aggregated eco-point value, were 26% and 24% higher in attaching system than ORP, per kilogram of biomass at 20%-DW and protein powder (algae meal), respectively. Both solutions offer a significant environmental improvement when compared to soymeal and fishmeal. Productivities 40% higher in RAB are required to obtain lower environmental impacts than ORP system. Electrical demands reductions up to 83% and 62% per kilogram of biomass 20%-DW and kilogram of algae meal, respectively, were reached by RAB approach. If RAB can substantiate a 50% increase in productivity on the long run, then the eco-points gains will be 20%, with reductions higher than 55% in electricity requirements and around 30% in the water consumption. The efficient energy performance of RAB, and its considerable margin of improvement make it a promising alternative to conventional open raceway systems.
Keywords: Biomass productivity, Protein, Rotating Algal Biofilm, Open raceway ponds, Tetraselmis suecica, aquaculture.
1. Introduction
The constant increase in worldwide population challenges future sustainable food and feed supplies. Meeting the expected demand of food and feed requires a production increase by 70% between 2005/07 and 2050, associated to an increase in the demand of vegetables, fruits, meat and fish (FAO, 2009). To date, agricultural production, mainly livestock production, is responsible for approximately a fifth of worldwide GHG emissions (McMichael et al., 2007). Global methane emissions of this sector contributed around 2.1 Gt CO2 equivalent in 2010 (Smith et al., 2014). Methane is a natural
by-product produced by the fermentation of nutrients in the digestive tracts of animals (Roque et al., 2019). Various mitigations options have been reported, including vaccines, methane inhibitors, ionophores and tannins, which describe inconsistent results (Hristov et al., 2013).
Macroalgae have been a traditionally used as a feed supplement on livestock diet. Many studies on macroalgae as livestock feed has demonstrated to reduce methane emissions, reporting reductions over 50% (Machado et al., 2014; Roque et al., 2019). However, microalgae with high protein content could be also a promising alternative to replace the traditional protein sources for animals diets, since they contain all essential amino acids, on top of high growth rates and biomass productivities (Becker, 2007; Gross et al., 2015). The protein quality in microalgae is lower than for animal source, but higher than vegetable sources (Mata et al., 2010). In addition, microalgae provide key nutrients, which are transferred through the food chain, such as essential polyunsaturated fatty acids, sterols, vitamins and pigments (Brown, 2002). Other than a source for animal feed, microalgae have others potential applications, such as human nutrition, bio-mitigation of CO2 emissions in microalgae cultivation,
bioremediation, bioassay, biofertilizer, among others (Rizwan et al., 2018).
The high capital and operational costs related to the culture and processing of the biomass are the main challenges for the commercial production of microalgae. Improved culture technologies for microalgae culture, with low energy and materials demands, are necessary to reduce ecological impacts and increase economic benefits. To date, microalgae culture prevailing systems are suspended cell culture systems, with cell densities between 0.5 in raceways ponds to 6 g·l-1 in
photobioreactors (DOE, 2016; Gross et al., 2015).This means that less than 1% of the culture medium consists of algae. Such extremely low concentrations of microscopic-suspended microalgae cells are a heavy burden, necessitating harvesting and dewatering processes which are commonly expensive, time demanding and energy-intensive (Gross et al., 2015; Zhuang et al., 2018). Harvesting conventional suspended culture systems generally represents 20% to 30% of operational costs (Davis et al., 2011; Molina-Grima et al., 2003).
Biofilm algae cultivation system is a process in which cells grow attached on the surface of a support medium (Zhuang et al., 2018). It is a promising alternative to produce microalgae biomass at large-scale, mainly due to the high biomass concentration and productivities obtained compared to traditional cultivation technologies. Attached culture systems provide a ready-to-use feedstock, without the requirement of expensive dewatering steps, since the water content of microalgae paste is already in the range 80-90%, i.e. concentration around 200 g·l-1 (Gross et al., 2015). Harvesting an
attached culture system is simpler and cheaper by scraping down the microalgae biomass directly to obtain the algal paste (Lee et al., 2014; Liu et al., 2013).
Besides the benefits of harvesting, the attached culture system allows a better light utilization, which means more efficient microalgae productivity. Several studies (Gross et al., 2015; Lee et al., 2014; Liu et al., 2013) compare the open raceways ponds (ORP) and rotating algal biofilm (RAB) cultures systems, demonstrating the benefits in terms of biomass productivities, achieving productivities up to 700% higher in RAB than ORP, under the same geographical and meteorological conditions (Liu et al., 2013). The moving-biofilm principle where light/dark cycle management allows to improve photosynthetic activity while reducing the impact of photoinhibition (Grobbelaar et al., 1996). In
addition, other advantages of RAB systems are related to its reduced water body, which improves CO2
mass-transfer rates (Gross and Wen, 2014). The contamination by other microorganisms, such as bacteria or protozoa, usually occur in microalgae cultivation (Gonen-Zurgil et al., 1996) and must be controlled by applying doses of pesticides or antibiotics. These doses would be highly reduced due to the higher resilience to contamination in biofilms.
However, while microalgae can be identified as a new protein source alternative, there is still very limited information about the cultivation systems to achieve the lowest environmental impacts. Higher biomass productivities and concentrations are expected in RAB, but some additional structural equipment, such as the material for supporting biofilm growth are necessary. This higher technicality may affect the global environmental assessment.
Several life cycle assessment (LCA) studies of algae biomass production have been reported in recent years, concerning to the production of biodiesel (Shimako et al., 2016; Wu et al., 2019; Zhang and Kendall, 2019), butanol (Wu et al., 2019), biogas (Colzi Lopes et al., 2018; Sun et al., 2019) , bio-oil (Silva et al., 2016; Wang et al., 2017), heat (Medeiros et al., 2015) and bioactive products (Espada et al., 2020; Pérez-López et al., 2014). The main objective of this study is to measure, via LCA framework, the environmental impact of two products (microalgae biomass at 20%-DW (dry-weight) and protein concentrate powder), both produced in rotating biofilm and traditional open raceways ponds systems, at large scale. The environmental results are also compared with conventional protein powder sources, such as soybean meal and fishmeal. Finally, environmentally and energetically demanding hotspots are identified in rotating algal biofilm system, in order to suggest technological alternatives and improve its ecological performance.
2. Material and methods
2.1. LCA and scope of the study
Life Cycle Assessment is a standardized tool that provides a quantitative analysis of the environmental impacts of products and their industrial systems. The standard framework of LCA described by ISO 14040:2006 (ISO, 2006a) was selected to measure the ecological impacts. The case study considers outdoor cultivation of Tetraselmis suecica at large-scale. Production with rotating microalgae biofilm (RAB) system is compared to a reference case in a conventional open raceway (ORP) submitted to the same meteorological conditions. Ponds in both cases have identical dimensions and infrastructure materials, complying with similar limits for the system and allocation method.
Three functional units (FU) were evaluated both for feed and food application. The first functional unit (FU1) consisted in 1 kg of microalgae biomass at 20%-DW, used for animal feed. It was used to compare the culture technology before biomass processing. However there are differences between the biomass concentration (and moisture content) obtained in both culture system technologies, i.e. 20% fresh biomass (i.e. 200 g·l-1) directly obtained in rotating algal biofilm, versus 0.5% biomass
concentration (i.e. 0.5 g·l-1) obtained in raceways. Thus, raceways cultures require additional
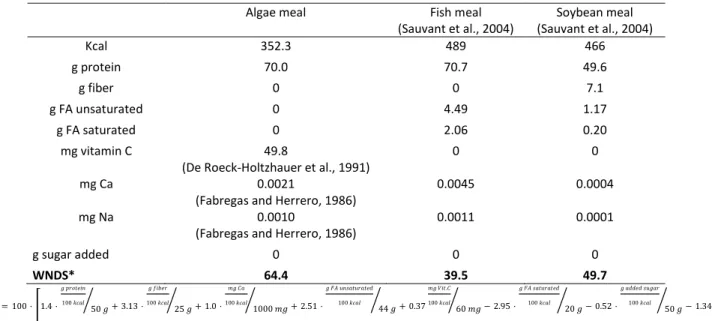
flocculation and dewatering processing steps (included in subsystem 2) (Figure 1). The second functional unit (FU2) consists in 1 kg of algae meal (also called protein concentrate) at 10% moisture. It requires additional downstream processes to get 70% of protein content, used as animal feed (mainly for aquaculture). The same technological processes are assumed for the down processing of RAB and ORP microalgae. A third functional unit (FU3), probably more relevant to account for the actual nutritional value, consists in 1000 WNDS-weighted nutrient density score. The WNDS is a nutrient score proposed by Arsenault et al. (2012) based in dietary quality, which included eight nutrient parameters contributing positively (protein, fiber, unsaturated fat, vitamin C and calcium
content) or negatively (such as sodium, saturated fat or added sugar) to nutrient value (Table 1). FU3 allows a fair comparison of algae meal with other protein sources (soybean meal and fishmeal) based on its nutrient quality as animal feed.
TABLE 1 AROUND HERE
2.2. Allocation method
When more than one product are delivered from the system processes, all system flows must be divided and weighted proportionally to either the energy content, mass or market value of the products. The procedure for the allocation method selection is described by ISO 14044:2006 (ISO, 2006b), as following:
i) allocation should be avoided by subdivision method (dividing the process into sub-process) or system expansion (expand the system to include avoided products, assumed as replaced by co-products),
ii) when allocation cannot be avoided, physical allocation should be applied, such as mass, volume or energy allocation,
iii) and when a physical relationship cannot be determined, other relationships should be used between the co-products, such as economic allocation.
The implementation of the subdivision method and system expansion were not possible, due to the lack of independence of the processes and the difficulty to identify alternatives products. Therefore, the allocation in this study was done according to masses, the advantage of this method is that does not require collection or analysis of extra data, while the economic allocation is affected by the temporal and geographical variability of economic value of co-products.
Therefore, the allocation in this study was done according to masses. The co-products in the case of algae meal (FU2) included extraction residue from centrifugation (lipids, ash, non-soluble protein, water and carbohydrates) and from ultrafiltration (lipids, starch, carbohydrates, water and negligible protein content). All these residual biomasses were accounted as one co-product of the production of protein concentrate. This co-product is considered as animal feed (15.5%- DW biomass rich in carbohydrates (44%) and lipids content (29%), but low in protein content about 3%). The microalgae biomass at 20%-DW (FU1) production does not include any co-products.
2.3. LCA methodology
SimaPro v8.5.2 (Prè-Consultants) was used for modelling the data, by using the characterization factors from ILCD 2011 Midpoint+ v1.10. This methodology is supported by ILCD Handbook - “Recommendations for Life Cycle Impact Assessment in the European context - based on existing environmental impact assessment models and factors” (ILCD, 2011). ILCD 2011 Midpoint+ methodology is considered as one of the most up-to-date and complete LCA methodology to be applied in the European context (Aymard and Botta-Genoulaz, 2017). The impact categories considered were Climate Change (CC), Ozone Depletion (OD), Human Toxicity non carcinogens (HT non-cancer), Human Toxicity carcinogens (HT cancer), Particulate matter (PM), Ionizing radiation (IR), Photochemical Oxidation formation (POF), Acidification (A), Terrestrial Eutrophication (TE), Freshwater Eutrophication (FE), Marine Eutrophication (ME), Freshwater Ecotoxicity (FET), Land Use (LU), Water Depletion (WD) and Mineral, Fossil & Renewable resources depletion (MFRD). In addition, an aggregation step was carried out to compare the different case studies by weighting the impact categories values by normalization factors of the EU-27 countries, related to the annual impacts of one European citizen in 2010. This integrated environmental impact interpretation by aggregating
quantitative values of the impact categories in one unique value, is known to facilitate decision making (Gloria et al., 2007).
2.4. System boundaries
A pond-to-gate LCA was performed. The scope of the system encompasses the production of biomass and process conversion to obtain the feed microalgae-based products: microalgae biomass and protein concentrate. The total facility surface was 1 ha, with 100 units of ponds (ORP or RAB) covered by greenhouses of 100 m2 each. The construction, dismantling and final disposal of the infrastructure
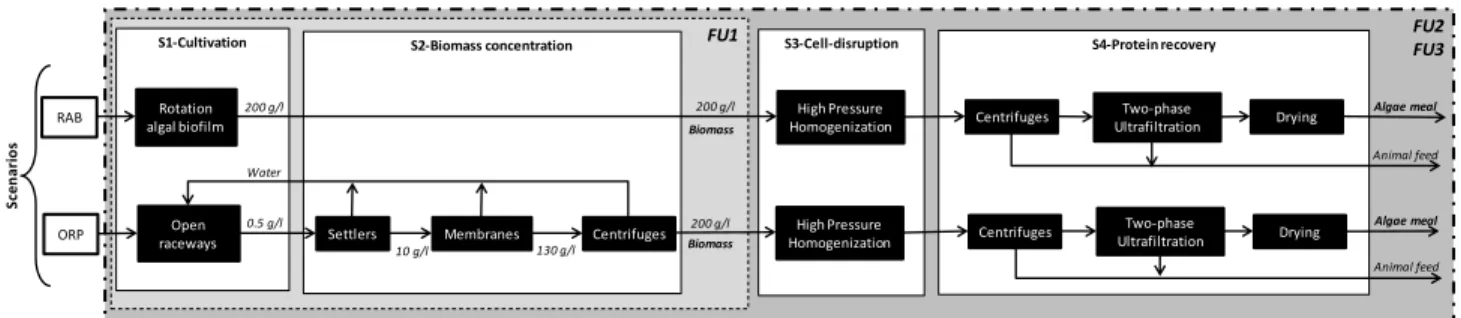
and machineries materials were also included, as well as the production of chemicals and their transport to the facility. The process is divided into four main areas, also called sub-systems. Figure 1 illustrates the general scheme of the system boundaries and subsystems. Subsystem 1 (also called Cultivation subsystem) considers rotating algae biofilm (RAB) and open raceway pond (ORP) systems for microalgae biomass production. Subsystem 2 (also called Biomass concentration) includes the de-watering process to achieve a concentration of 20% biomass-DW. Subsystem 3 (cell-disruption subsystem) considers high-pressure homogenization, which helps to disrupt microalgae cells for protein release. Subsystem 4 (also called protein recovery subsystem) includes subsequent conversion operations to obtain protein powder concentrate (also called algae meal) through centrifugation, two-phase ultrafiltration and drying.
FIGURE 1 AROUND HERE
2.4.1. Cultivation
T. suecica was grown in outdoor ORP system and in a RAB modified raceway (also called
raceway-based RAB system) at large-scale with identical dimensions and materials. The assumed biomass composition was: 24.1% protein, 36.2% carbohydrates, 21.5% lipids and 14.6% ash (Schwenzfeier et al., 2011). A pond with 96.5 m2 of surface area (15 m long, 6 m width and 0.3 m thickness,
constructed of concrete and covered by PVC liner) and 50 m3 total volume (29 m3 working volume)
was used as medium reservoir in RAB and ORP systems. The nutrient medium was the same for ORP and RAB (Table 2). Greenhouses of transparent polycarbonate cover the culture systems with 100 m2
surface area. Natural solar illumination was exclusively used for the microalgae growth. A blower system was considered (with an electrical consumption of 0.02 kWh·kg-1 CO
2) (Xu et al., 2011) and a
paddlewheel, with an electricity requirement of 0.2 W·m-2 pond to culture mixing speed of 0.25 m·s-1
(Chisti, 2016) in both system (RAB and ORP).
TABLE 2 AROUND HERE
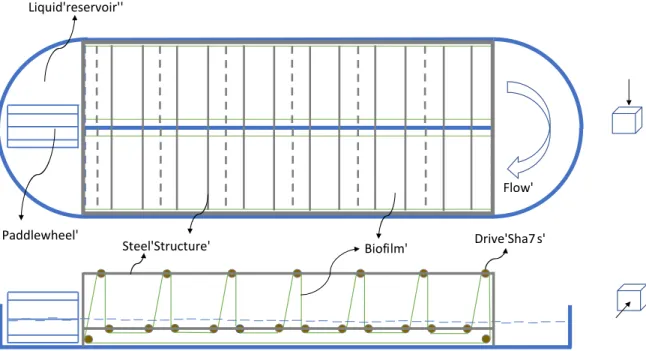
The rotating algae biofilm system consists of two major parts: the ponds (nutrient reservoir) and the flexible belt that is continuously rotating. The material of the flexible belt was polypropylene, on which the biofilm support was fixed. The dimension of each polypropylene belt was 50 m long, 6 m width and 0.008 m thickness. This flexible material, similar to a conveyor belt, was stretched around drive shafts to form a triangle configuration as illustrates Figure 2. The lowest region of the belt was submerged in a medium reservoir to supply nutrients, while the rest of the belt was exposed to the gas phase for direct access to light. Two water pumps were considered for the transport of seawater and freshwater, with an electrical consumption of 0.15 kWh·m-3 each (Rogers et al., 2014). Seawater
and freshwater are supplied to counteract water evaporation and the non-recirculate extracted water. Evaporation rates assumed were 0.12 cm·d-1 for open raceways (Davis et al., 2016) and 0.2
cm·d-1 for rotating biofilm, based on evaporation rates reported by Gross et al. (2015) for
raceways-based RAB.
FIGURE 2 AROUND HERE
The shafts were continuously driven by a 0.1 kW motor with 86% efficiency (Rulmeca, 2013), rotating the belt between the liquid and gas phases at constant rotational speed of 2 cm·s-1 in the same
direction of flow. The driving motor power (𝑃) was determined by using Equation 1 (Rulmeca, 2013), where 𝐹𝑢 is the total tangential effort around the drive drum, 𝑣 is the rotational speed and 𝜂 is the motor efficiency.
𝑃 = 𝐹𝑢∙𝑣
100∙𝜂 [𝑘𝑊] Eq.1
𝐹𝑢 was defined by the addition of tangential effort to move the section of the upper strand (𝐹𝑎) and lower strand (𝐹𝑟), determined by the equations 2-4.
𝐹𝑢 = 𝐹𝑎 + 𝐹𝑟 Eq.2 𝐹𝑎 = [𝐿𝑠∙ 𝐶𝑞∙ 𝐶𝑡∙ 𝑓 ∙ (𝑞𝑏+ 𝑞𝐺+ 𝑞𝑅𝑂)] ∙ 0.981 [𝑑𝑎𝑁] Eq.3
𝐹𝑟 = [𝐿𝑖∙ 𝐶𝑞∙ 𝐶𝑡∙ 𝑓 ∙ (𝑞𝑏+ 𝑞𝑅𝑈)] ∙ 0.981 [𝑑𝑎𝑁] Eq.4
Where,
𝐿𝑠: Length of the superior conveyor belt or non-submerged belt (m)
𝐿𝑖: Length of the inferior conveyor belt or submerged belt (m)
𝐶𝑞: Fixed resistance coefficient, as function of belt length
𝐶𝑡: Coefficient of passive resistance, as function of temperature (1 at 20°C)
𝑓: Coefficient of rotating parts friction, as function of rotational speed 𝑞𝑏: Mass per linear meter of belt (kg·m-1)
𝑞𝐺: Mass per linear meter of transported product (kg·m-1), considered negligible for biofilm
𝑞𝑅𝑂, 𝑞𝑅𝑈: Mass per linear meter of superior (𝑞𝑅𝑂) and inferior (𝑞𝑅𝑈) rotating parts as function of
width of the belt and diameter of the rotating rollers (kg·m-1)
The selection of the supporting material to grow the biofilm is a critical issue for commercial application. It should be durable, cheap, lightweight and able to retain water and algal cells for re-growth after harvesting (Liu et al., 2013). The selection of supporting material has to be tailored to microalgae species, to optimize biomass productivity (Christenson and Sims, 2012). Synthetic fabrics, with 0.001 thickness, was used as attaching material. However, other attaching materials were evaluated in the sensitivity analysis. It took around 4 days for the cells to colonize the surface-attaching material. A scraper blade for biomass harvesting was passed over the biofilm, until no more biomass was removed. The residual biomass that remained over the attaching material was used as inoculum for the next culture cycle.
2.4.2. Biomass concentration
The biomass obtained in ORP (0.05%-DW) requires being concentrated up to 20%-DW. A three-step de-watering system is considered, based on the process model developed by NREL (Davis et al., 2016).The biomass first passes through a settler pond, without external flocculants and considering negligible electricity requirements. Only electricity used for pumping the diluted biomass from the
open raceway ponds to settlers ponds (0.2 kWh·m-3) (Rogers et al., 2014) was considered. Then,
biomass at 1%-DW is injected through membranes to reach 13%-DW. Membranes use 0.04 kWh·m-3
with 99.5% efficiency (Davis et al., 2016). Finally, a centrifugation step is necessary to obtain 20%-DW, which considers 97% efficiency, by using 1.35 kWh·m-3 (Davis et al., 2016).
2.4.3. Cell disruption
A EmulsiFlex-C160 high-pressure homogenizer (Avestin, Inc., Ottawa, Canada) with 85% efficiency rupture (Clavijo Rivera et al., 2018) and feed flux capacity of 160 L·h-1 was used for cell disruption. The
electricity requirement (0.17 kWh·kg-1 biomass) was determine through Equation 5 (Roustel, 2010). T.
suecica cells were passed through the homogenizer at 1000 bar. Temperature of the homogenized
suspension was increased up to 46°C. These pressure and temperature allow a complete disruption of the cell walls and a well-solubilisation of starch and proteins, without protein denaturation (Safi et al., 2014). 𝑃 = 𝑄𝑖𝑛∙ 𝑃𝐻∙𝑃𝑖𝑛 36000∙𝜂𝑝𝑢𝑚𝑝∙𝜂𝑚𝑜𝑡𝑜𝑟[𝑘𝑊] Eq. 5 Where, 𝑄𝑖𝑛: Feed capacity (L·h-1)
𝑃𝐻: Homogenizer pressure (bar)
𝑃𝑖𝑛: Pressure of input product (1 bar)
𝜂𝑝𝑢𝑚𝑝: Pump efficiency (85%)
𝜂𝑚𝑜𝑡𝑜𝑟: Motor efficiency (95%)
2.4.4. Protein recovery
Later, the output flow from the homogenizer was centrifuged (1.35 kWh·m-3) to recycle the aqueous
extracts (supernatant). The amount of protein released to the aqueous phases after centrifugation depends on the cell rupture process and microalgae species. In the case of T. suecica, 40% to 90% of total proteins are soluble by using a high-pressure homogenizer as cell rupture process (Safi et al., 2014). A conservative 40% of the total protein in the supernatant was assumed. A two-phase ultrafiltration process was considered for protein recovery, based on the process model reported by Safi et al. (2014) for T. suecica. The supernatant passed through a first step of the ultrafiltration process with a 100-kDa membrane. 100-kDa membrane retains starch while allowing proteins and sugars to pass into permeate (Safi et al., 2014). Then, the second step uses a 10-kDa membrane in order to retain proteins while allowing sugars to be concentrated in the permeate (Safi et al., 2014).
T. suecica proteins size are between 15-50 kDa (Schwenzfeier et al., 2011), and thus a 10 kDa
membrane was used. Finally, the protein-rich (70% protein) flow was dried in a 7.4 kW drum dryer model 3P500 (Arakawa Co., Ltd, Nagoya, Japan) to obtain a protein concentrate with 10% moisture.
2.5. Data source and assumptions
Data provided by Inalve (Inalve, Nice, France) for a biofilm of T.suecica growth in Villefranche sur mer (South of France) on pilot scale were considered for infrastructure of raceways-based RAB. Assuming that RAB is installed in an ORP is a very conservative hypothesis, and a significant margin of progress is expected for this emerging technology. The downstream processes were obtained from bibliographic sources (Davis et al., 2016; Safi et al., 2014)and adapted to the study. Background data from Ecoinvent v3.4 were used for input material production such as chemical, fabric, infrastructure materials and electricity. The average electricity mix in Europe (for year 2018) was used. Three open raceway ponds with 102 m3 working volume were considered for inoculum production. Gaseous
emissions included 25% of loss emissions of CO2, while N2O and NH3 emissions were based in the
assumptions considered in the study of Collet et al. (2014). The lifetime assumed in the inventory were 30 years for infrastructure materials such as polypropylene, PVC, steel, aluminium and concrete, while the attaching material (synthetic fabrics) was changed every 4 years. Then lifetime, polypropylene and PVC based products are sent to sanitary landfill and incineration. Concrete and aluminium based materials are sent to sanitary landfill, whereas steel based products are recycled and the fabric used as attaching material is incinerated. The higher light intensity recovery by microalgae cells in RAB systems allows a higher carbohydrates content and lower lipid content in comparison to ORP systems (Gross and Wen, 2014). However to keep a conservative viewpoint, we considered a constant chemical composition for T. suecica for RAB and ORP systems, without accounting for the seasonality and cultivation methods.
2.6. Comparative cases
Based on standard measurement by Inalve S.A. and Gross et al. (2015), who achieved a maximum productivity of around 50 g·m-2·d-1 , a conservative productivity assumption of 20 g·m-2·d-1 was made
for RAB system. While productivities lower than RAB system, were assumed for ORP system, ranging between 20% and 100% of the productivity obtained in the RAB system, i.e between 4 g·m-2·d-1 and 20
g·m-2·d-1. The reference cases for protein concentrate were obtained from the Ecoinvent database
v3.4 for soybean meal (France), fish meal (protein concentrate) for Peru (world's leading producer) and an European average, obtained from Germany, Norway, Denmark and UK, complying with similar limits for the system and for the allocation (mass based allocation) of this study. The protein content in soybean meal and fishmeal and moisture content are detailed in supplementary material (Table
A1).
3. Results and discussion 3.1. Inventory
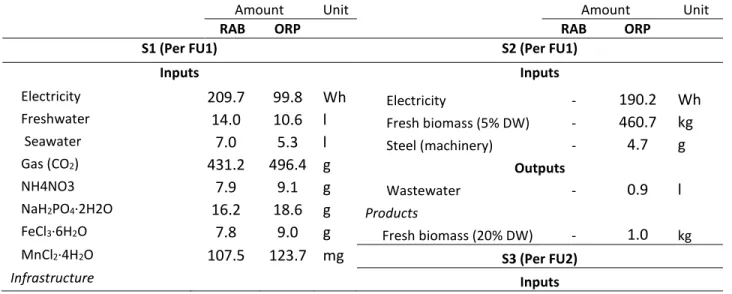
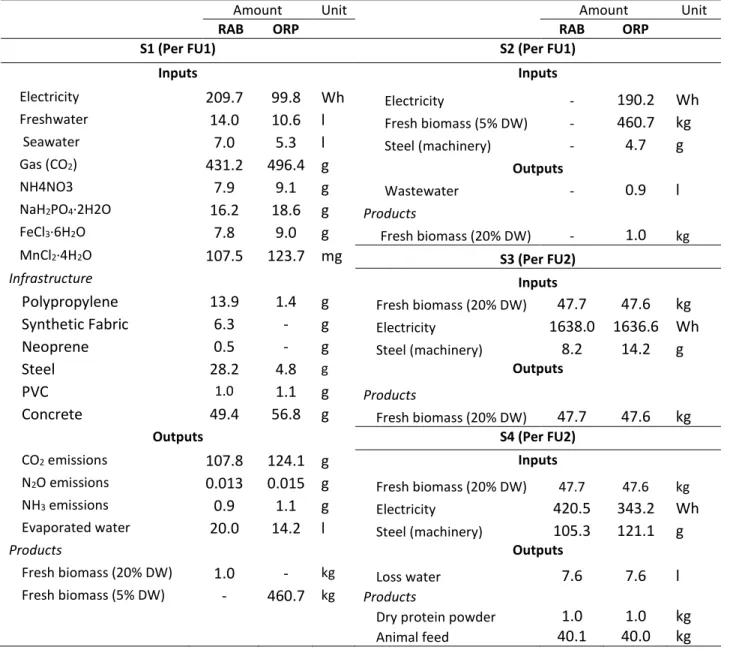
Table 3 presents the inventory for microalgae production and processing, considering equal biomass
productivity (20 g·m-2·d-1) for ORP and RAB. Table 3 was classified per inputs/outputs of each
subsystem. RAB has an extra support structure, i.e. more materials are used, such as polypropylene (used in the conveyor belt), synthetic fabrics (mesh used as attaching material), neoprene (material used in the transmission system) and steel (used in the structural frame). In addition, subsystem 2 only present in ORP demands an extra of electricity and steel (machineries). The presence of this extra subsystem in ORP system affects the global quantity of product per day (biomass or protein), due to the efficiency of each process: 90% in settlers, 99.5% in membranes and 97% in centrifuges). The global efficiency of 86.9% means 13.1% of biomass loss in subsystem 2.
TABLE 3 AROUND HERE
3.1.1. Energy balance in culture
The power requirement of paddlewheel for a 96.5 m2 ORP was 0.20 W·m-2 pond. This is lower than
RAB, in which an extra power requirement of 0.65 W·m-2 pond (0.21 W·m-2 biofilm) to rotate the
biofilm is necessary. Additional 0.22 W·m-2 pond for RAB and 0.16 W·m-2 pond for ORP are also
required for pumping off-site freshwater and seawater and blower system. Thus, the total power required in subsystem-1 (also including pumping and blower systems) amount to 0.87 W·m-2 pond
productivity (20 g·m-2·d-1). However, this benefit of ORP disappears when the dewatering processes
in ORP system are considered, which required an area-based power of 0.69 W·m-2 to achieve a
20%-dry weight biomass (FU1). Hence, when culturing and dewatering are considered, the power requirement for the ORP was around 1.05 W·m-2 pond (0.21 W·kg-1 biomass 20%-DW), this is 16.7%
higher than the power used in the RAB system (0.87 W·m-2 pond or 0.29 W·kg-1 biomass 20%-DW).
3.1.2. Water consumption
The water consumption (freshwater and seawater) in culture (subsystem 1) was 16 L·kg-1 biomass
(20%-DW) in ORP against 21 L·kg-1 biomass (20%-DW) in RAB, i.e. 31.6% higher in RAB than ORP. The
main sources of water requirements were: i) water in algal paste, ii) water in recirculation medium and iii) water evaporation rates.
Biomass concentration is much lower (400 times lower than RAB) at the end of the ORP culture subsystem. This make necessary subsystem 2 (biomass concentration) in ORP. However, in the global water balance, the recirculation flux is an important parameter demanding extra water. In our case, ORP recirculates 95.5% of water (from subsystem 2 to subsystem 1), whereby this difference in biomass concentration does not have a relevant impact in water balance. The freshwater requirement was 10.6 L·kg-1 biomass 20%-DW in ORP, recirculating the water to culture; but this
consumption increases to 469.4 L·kg-1 biomass 20%-DW, without considering the recirculation of
water. Also, a water volume of 0.1 L·m-2 cultivation surface is necessary to wet the biofilm in RAB
system, without considering evaporation loss. Nevertheless, evaporation loss is an important factor to be considered and depend of multiple factors, such as, environmental conditions (temperature, wind and humidity) and reactor/ponds design (Liu et al., 2013). Because of higher exchange surface, the biofilm doubles the evaporation rates in RAB (0.12 cm water·d-1 in ORP versus 0.2 cm water·d-1 in
RAB). More than 95% of global water requirements are due to evaporation in the biofilm system (20 m3·ton-1 biomass 20%-DW). The freshwater consumption is an important parameter for the
large-scale production. A better water evaporation control in the RAB system would be necessary to decrease the impacts related to water depletion. Such improvements are possible since medium reservoir can increase thermal inertia reducing maximal temperatures and evaporation losses. Controlling the evaporation losses in the pond could dramatically reduce this water loss.
3.2. Environmental impacts
Comparisons of environmental impacts between 1000 WNDS (FU3) of microalgae-based protein produced in a RAB, ORP and comparative standard cases are shown in Figure 3. Assuming identical biomass productivity (20 g·m-2·d-1), RAB system has a higher impact in nine of the twelve evaluated
categories in comparison to ORP, except acidification, terrestrial eutrophication and mineral, fossil and renewable resources depletion. These impacts are mainly generated in the production of the module and of the fertilizer (see supplementary material). The main sources of impacts in the production module are, in order of impact contribution: i) polypropylene, ii) synthetic fabrics and iii) steel (data not shown). The environmental impacts with RAB are remarkably lower in comparison to soybean meal and fishmeal. Soybean meal as protein source obtain the worst results, e.g. 9-times higher in climate change impacts, 7-times higher in water depletion 20-times higher in marine eutrophication and 13-times in photochemical oxidation formation categories in comparison to the environmental impacts of microalgae-based protein.
3.3. Selection of the best alternative
Figure 4 shows the aggregated environmental impacts normalized with a weighting factor (EU-27,
2010). These values express the relative importance of each impact category in one single value (single score, expressed in Eco-points, Pt), for easier comparison of the different cases study. The greatest relative importance in the single score value came from WD, FET and HT in both systems. The source of impact in FET, HT and WD were the infrastructure production and the evaporation rates of RAB. Figure 4 also presents the distribution of results by subsystem. Culture subsystem was the main subsystem affecting the weighting value followed by biomass concentration subsystem (Figure
4a and Figure 4b), for both assessed functional units. Biomass concentration contributes between
12% and 38% of the total eco-points in the production of biomass at 20%-DW in (Figure 4a) and between 12% and 33% (Figure 4b) in the protein powder production the case of ORP. The impacts from cell disruption subsystem and protein recovery are lower than 11% and 2.5% in ORP and RAB systems, respectively. More details of LCA results with the three considered functional units can be found in supplementary material.
FIGURE 4 AROUND HERE
The paddlewheel in ORP maintains a uniform density in the reactor, reducing the residence time of cells in the dark regime (Rogers et al., 2014). However, the presence of the paddlewheel to maintain a constant mixing is a questionable issue in biofilm systems. The conveyor belt movement is likely to produce the necessary turbulence for maintaining homogeneous dissolved concentrations in the aqueous medium. Thus, two scenarios for RAB system were evaluated (Figure 4), presence and absence of paddlewheel. The presence of paddlewheel in RAB system increases 12% the single score, from 61.3 to 69.6 µPt·kg-1 biomass 20%-DW and from 71 to 80.8 µPt·kg-1 algae meal, mainly due to
the increase in the electricity demand. Considering equivalent productivity (20 g·m-2·d-1), the
eco-points obtained in RAB without paddlewheel is 26% and 24% higher than ORP, per kilogram of biomass at 20%-DW and protein powder, respectively. However, the single value obtained for RAB at 20 g·m-2·d-1 is lower than ORP for productivities lower than 12 g·m-2·d-1, i.e. productivities 20% higher
in RAB are necessary to obtain lower environmental impacts than ORP system. Nevertheless, 20 g·m -2·d-1 is a lower bound for productivity in a RAB system, while it is rarely achieved for ORP. Some
examples of rotating biofilm system and open raceways, at the same environmental and technical conditions, have been reported, e.g. Liu et al. (2013) reported productivities for RAB system 400% - 700% higher than ORP. Other studies also reports productivities higher for RAB in comparison to ORP systems: 2.8 times higher (Lee et al., 2014) and 3.8 times higher (Gross et al., 2015).
Physical aspects and operational efficiencies limit the maximal biomass productivity in raceways and photobioreactors. The maximum biomass productivity reported in ORP and photobioreactors are lower than 40 g·m-2·d-1 (Brennan and Owende, 2010), but productivities up to 50-80 g·m-2·d-1 has been
reported for biofilm systems (Liu et al., 2013). Microalgae could be more productive in RAB due to the more efficient light utilization and/or CO2 transfer efficiency (Zhuang et al., 2018). The light
availability for growth needs to be described in terms of the light flux available per cell. The well-organized form of the biofilm in comparison to a suspended culture and the periodic light supply allows a better light distribution for every cell. The most important requirements for an efficient light fluxes utilization per cell are related to short light/dark cycles (Grobbelaar et al., 1996) coupled with short light-path (Qiang et al., 1998). When microalgae cells are exposed to a long time high illumination it affect growth due to photo-saturation or even photo-inhibition (Grenier et al., 2019). The rotating biofilm dilutes light along time due to the alternation of light and dark sequences,
mitigating the risk of photo-inhibition produced by over-dosed light (Liu et al., 2013). Short light/dark cycles increase the photosynthetic activity, which in turns increase the biomass productivity (Grenier et al., 2019; Grobbelaar et al., 1996) found that productivity of the moving biofilm system increase two-fold compared to the non-moving system. The effect of light-depth on productivity is not clear, but could be related to the decrease of background turbidity (Martínez et al., 2018). The background turbidity induces light extinction due to all non-microalgae components. The loss of photons due to background turbidity decreases when depth of culture decreases. Qiang et al. (1998) showed the effect of light-path on productivity, when reducing 27-fold the depth of the culture (i.e. from 200 mm to 7.5 mm) the productivity was almost doubled. In addition, CO2 transfer efficiency is higher in RAB
than in ORP, due to CO2 diffusion through a thin liquid interface before its consumption by microalgae
cells (Zhuang et al., 2018).
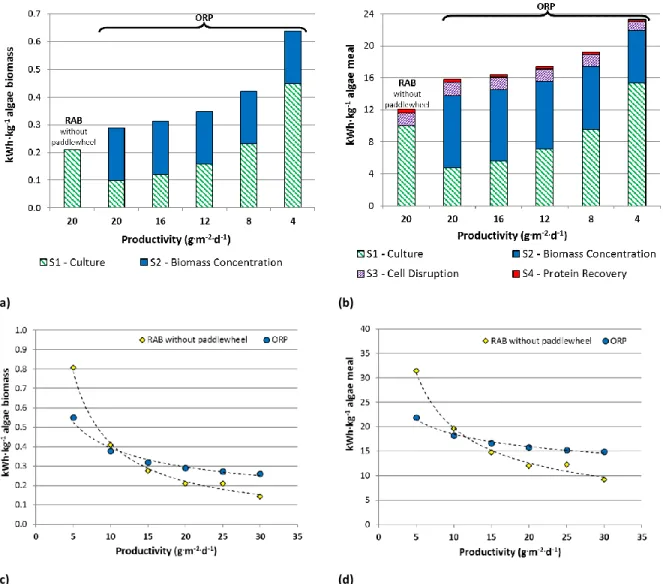
Regarding the electricity consumption, Figure 5A and Figure 5B illustrate the source of contribution by subsystem. The S1-culture and S2-biomass concentration subsystems have the main electricity demands. However, this electricity consumption is variable and depends on productivity, e.g. subsystem 2 represents between 30% -66% and 28%-57% for the pond to wheel production of FU1 and FU2, respectively. Figure 5C and Figure 5D illustrate the difference in the electricity requirement between ORP and RAB at different biomass productivities. The comparison in energetic performance depends on the assumed productivity. Productivities higher than 10 g·m-2·d-1 are necessary to obtain
lower electricity in RAB system then ORP. The difference in the electricity requirement increases as biomass productivity increases, reaching reductions of 83% and 62% in the electrical demands per kilogram of biomass 20%-DW and kilogram of protein, respectively, by using RAB rather than ORP at 30 g·m-2·d-1.
FIGURE 5 AROUND HERE
Figure 6 presents the relation between productivity and greenhouse gases (GHG) emissions and
single score. The tendency for GHG and single score is the same for RAB and ORP, but assuming identical productivities, the values obtained for ORP are lower than RAB. However, these differences decrease as productivities increase. It is worth noting that microalgae-based protein offer significant reductions in climate change and single score compared to most of the traditional sources of protein concentrates, such as soybean meal and fishmeal. If productivities above 10 g·m-2·d-1 are reached by
RAB, then climate change impact is only the third of the one for fishmeal. Productivities higher than 10 g·m-2·d-1 are required to obtain a single score lower than fishmeal.
FIGURE 6 AROUND HERE
RAB system are expected to achieve biomass productivities twofold higher than suspended-based systems, under identical meteorological conditions. Thus, for a fair comparison, we assumed biomass productivities of 15 g·m-2·d-1 and 30 g·m-2·d-1 for ORP and RAB systems, respectively. Figure 7
illustrates the resulting efficiency in the use of water and energy, greenhouse gas emissions and resulting single score. Reductions around 30% in water consumption and 20% in single score values were achieved in RAB, but negligible variations were observed in climate change in both evaluated functional units. The most remarkable reduction was in the electricity consumption, 55% and 45% lower in RAB per 1 kg microalgae biomass (FU1) and per 1 kg algae meal (FU2), respectively.
3.4. Sensitivity analysis
More environmentally optimized scenarios were evaluated for rotating algal biofilm systems, through a sensitivity analysis. Based on the LCA results and environmental hotspots identified, the sensitivity analysis is based on the analysis of optimized scenarios. These scenarios are focused on the biomass productivity, evaporation rates, module structure, fertilizer compound, velocity of flux provided by paddlewheel and downstream processes (homogenization efficiency and cell disruption technology):
The biomass productivity is one of the main benefits for RAB system, with strong dependency of LCA results to productivity assumptions. The productivities evaluated in the sensitivity analysis are lower (10 g·m-2·d-1) and higher (30 g·m-2·d-1) than the base case (20 g·m-2·d-1).
Two values of the evaporation rates have been evaluated: 0.3 cm water·d-1 and 0.1 cm
water·d-1 (similar to raceways ponds evaporation).
Flow velocity of the liquid reservoir determines the paddlewheel power (Chisti, 2016): two flow velocities were analysed 0.2 m·s-1 and 0.3 m·s-1, corresponding to energy consumptions
of 0.10 W·m-2 and 0.35 W·m-2, respectively.
Modifications in support material (nylon and cotton replacing the synthetic fabrics). Fabric timelife (4 years, 2 years and 1 year).
Fertilizer (NaNO3 replace NH4NO3).
Modification in the downstream process of cell disintegration (Bead mills replace high pressure homogenization). Bead mill model DYNO-MILL KD 6 (Willy A. Bachofen AG Maschinenfabrik, Muttenz, Switzerland) was considered. The grinding chamber was filled with 65% v/v of ceramic beads with 0.5 mm diameter. 100% efficiency of rupture and 22.5% of the total proteins in the supernatant after centrifugation were assumed (Schwenzfeier et al., 2011) and electrical consumption of 0.63 kW·kg-1 biomass.
Improvements in downstream process leading to the highest reported fraction of extracted soluble protein in the high pressure homogenizer (usually between 40% to 90% (Safi et al., 2014)). An optimistic 90% protein soluble present in supernatant after centrifugation was thus considered.
Figure 8 shows the main parameters affecting climate change and single score. Climate change is
mainly affected by the biomass productivity and fertilizer source, while single score is highly affected by biomass productivity and cell disruption technology. A higher productivity will clearly benefit to reduction in climate change and single score value. The high-pressure homogenization, synthetic fabrics (as fabric support for biofilm, with a frequency of change of 4 years) and ammonium nitrate as N-fertilizer was the most environmentally promising scenario to produce microalgae protein powder. Evaporation rate and velocity of the paddlewheel are the main operational parameters to be controlled, together with higher biomass productivity, they lead to significant reduction in the environmental impacts.
FIGURE 8 AROUND HERE 4. Conclusions
This work assesses the environmental impacts of the production of microalgae biomass and protein concentrate from a large-scale rotating biofilm system and a conventional open raceway pond. When comparing to conventional ORP system at same biomass productivity, the RAB system presents higher environmental impacts and evaporation loss. The production module followed by the fertilizer source, were environmental hotspots in the biofilm system. However, energetic calculation shows
that RAB system can be more efficient than ORP system at productivities higher than 10 g·m-2·d-1,
with net energy requirements reductions higher than 13%. RAB system is expected to achieve biomass productivities two-fold higher than suspended-based systems, which in turn lower the water consumption (30% lower) and environmental impacts (20% lower) per unit of product (microalgae biomass or algae meal). Higher biomass productivity, more efficient energy performance and low energy harvesting method place this system as a promising alternative compared to conventional biomass production. Maintaining evaporation at a similar rate as in open raceways rates and increasing biomass productivity, e.g. through faster rotational velocity of the biofilm, will highly improve the global environmental performance of RAB.
Funding
This work was supported by the ADEME Phyto´Recolte project. O. Bernard benefited from a grant from Enersense at NTNU for his sabbatical stay.
5. References
Arsenault, J., Fulgoni, V., Hersey, J., Muth, M., 2012. A Novel Approach to Selecting and Weighting Nutrients for Nutrient Profiling of Foods and Diets. J. Acad. Nutr. Diet. 112(12), 1968-1975. Aymard, V., Botta-Genoulaz, V., 2017. Normalisation in life-cycle assessment: consequences of new European factors on decision-making. Supply Chain Forum: An International Journal 18(2), 76-83.
Becker, E., 2007. Micro-algae as a source of protein. Biotechnol. Adv. 25(2), 207-210. Brennan, L., Owende, P., 2010. Biofuels from microalgae—a review of technologies for
production, processing, and extractions of biofuels and co-products. Renew. Sustain. Energy Rev. 14(2), 557-577.
Brown, M., 2002. Nutritional value and use of microalgae in aquaculture, in: Cruz-Suarez, L., Ricque-Marie, D., Tapia-Salazar, M., Gaxiola-Cortés, M., Simoes, N. (Eds.), Avances en Nutrición Acuicola VI. Memorias del VI Simposium International de Nutricion Acuicola. Cancun, Mexico, pp. 281-292.
Chisti, Y., 2016. Large-Scale Production of Algal Biomass: Raceway Ponds, in: Bux, F., Chisti, Y. (Eds.), Algae Biotechnology: Products and Processes. Springer International Publishing, Cham, Switzerland, pp. 21-40.
Christenson, L., Sims, R., 2012. Rotating algal biofilm reactor and spool harvester for wastewater treatment with biofuels by-products. Biotechnol Bioeng 109(7), 1674-1684.
Clavijo Rivera, E., Montalescot, V., Viau, M., Drouin, D., Bourseau, P., Frappart, M., Monteux, C., Couallier, E., 2018. Mechanical cell disruption of Parachlorella kessleri microalgae: Impact on lipid fraction composition. Bioresour. Technol. 256, 77-85.
Collet, P., Lardon, L., Hélias, A., Bricout, S., Lombaert-Valot, I., Perrier, B., Lépine, O., Steyer, J.-P., Bernard, O., 2014. Biodiesel from microalgae – Life cycle assessment and recommendations for potential improvements. Renew. Energy 71, 525-533.
Colzi Lopes, A., Valente, A., Iribarren, D., González-Fernández, C., 2018. Energy balance and life cycle assessment of a microalgae-based wastewater treatment plant: A focus on alternative biogas uses. Bioresour. Technol. 270, 138-146.
Davis, R., Aden, A., Pienkos, P., 2011. Techno-economic analysis of autotrophic microalgae for fuel production. Appl. Energy 88(10), 3524-3531.
Davis, R., Markham, J., Kinchin, C., Grundl, N., Tan, E., Humbird, D., 2016. Process Design and Economics for the Production of Algal Biomass: Algal Biomass Production in Open Pond Systems
and Processing Through Dewatering for Downstream Conversion. National Renewable Energy Lab. (NREL), Golden, CO, USA.
De Roeck-Holtzhauer, Y., Quere, I., Claire, C., 1991. Vitamin analysis of five planktonic microalgae and one macroalga. J. Appl. Phycol. 3(3), 259-264.
DOE, 2016. National Algal Biofuels Technology Review, in: Barry, A., Wolfe, A., English, C., Ruddick, C., Lambert, D. (Eds.). Deparment of Energy, Office of Energy Efficiency and Renewable Energy, Bioenergy Technologies Office, Washington DC, USA.
Espada, J.J., Pérez-Antolín, D., Vicente, G., Bautista, L.F., Morales, V., Rodríguez, R., 2020.
Environmental and techno-economic evaluation of β-carotene production from Dunaliella salina. A biorefinery approach. Biofuel Bioprod. Biorefin. 14(1), 43-54.
Fabregas, J., Herrero, C., 1986. Marine microalgae as a potential source of minerals in fish diets. Aquaculture 51, 237-243.
FAO, 2009. How to feed the world in 2050, Proceeding of the Expert Meeting on How to Feed the World in 2050. Food and Agriculture Organization of the United Nations, Economic and Social Development Department, Rome, Italy, pp. 1-35.
Gloria, T., Lippiatt, B., Cooper, J., 2007. Life cycle impact assessment weights to support environmentally preferable purchasing in the United States. Environ. Sci. Technol 41(21), 7551-7557.
Gonen-Zurgil, Y., Carmeli-Schwartz, Y., Sukenik, A., 1996. Selective effect of the herbicide DCMU on unicellular algae—a potential tool to maintain monoalgal mass culture of Nannochloropsis. J. Appl. Phycol. 8(4-5), 415-419.
Grenier, J., Bonnefond, H., Lopes, F., Bernard, O., 2019. The impact of light supply to moving photosynthetic biofilms. Algal Res. 44, 101674.
Grobbelaar, J., Nedbal, L., Tichý, V., 1996. Influence of high frequency light/dark fluctuations on photosynthetic characteristics of microalgae photoacclimated to different light intensities and implications for mass algal cultivation. J. Appl. Phycol. 8(4-5), 335-343.
Gross, M., Mascarenhas, V., Wen, Z., 2015. Evaluating algal growth performance and water use efficiency of pilot‐scale revolving algal biofilm (RAB) culture systems. Biotechnol Bioeng 112(10), 2040-2050.
Gross, M., Wen, Z., 2014. Yearlong evaluation of performance and durability of a pilot-scale revolving algal biofilm (RAB) cultivation system. Bioresour. Technol. 171, 50-58.
Hristov, A.N., Oh, J., Firkins, J., Dijkstra, J., Kebreab, E., Waghorn, G., Makkar, H., Adesogan, A., Yang, W., Lee, C., 2013. Special topics—Mitigation of methane and nitrous oxide emissions from animal operations: I. A review of enteric methane mitigation options. J. Anim. Sci. 91(11), 5045-5069.
ILCD, 2011. ILCD Handbook: International Reference Life Cycle Data System. Recommendations for Life Cycle Impact Assessment in the European context- based on existing environmental impact assessment models and factors, First ed. Joint Research Centre, European Commission and Institute for Environment and Sustainability, Luxembourg, Luxembourg.
ISO, 2006a. 14040:2006. Environmental management. Life Cycle Assessment. Principles and Framework. Geneva, Switzerland.
ISO, 2006b. 14044:2006. Environmental management - Life cycle assessment - Requirements and guidelines. Geneva, Switzerland.
Lee, S.-H., Oh, H.-M., Jo, B.-H., Lee, S.-A., Shin, S.-Y., Kim, H.-S., Lee, S.-H., Ahn, C.-Y., 2014. Higher biomass productivity of microalgae in an attached growth system, using wastewater. J. Microbiol. Biotechnol 24(11), 1566-1573.
Liu, T., Wang, J., Hu, Q., Cheng, P., Ji, B., Liu, J., Chen, Y., Zhang, W., Chen, X., Chen, L., 2013. Attached cultivation technology of microalgae for efficient biomass feedstock production. Bioresour. Technol. 127, 216-222.
Machado, L., Magnusson, M., Paul, N.A., de Nys, R., Tomkins, N., 2014. Effects of marine and freshwater macroalgae on in vitro total gas and methane production. PLoS One 9(1).
Martínez, C., Mairet, F., Bernard, O., 2018. Theory of turbid microalgae cultures. J. Theor. Biol 456, 190-200.
Mata, T., Martins, A., Caetano, N., 2010. Microalgae for biodiesel production and other applications: A review. Renew. Sustain. Energy Rev. 14(1), 217-232.
McMichael, A., Powles, J., Butler, C., Uauy, R., 2007. Food, livestock production, energy, climate change, and health. The lancet 370(9594), 1253-1263.
Medeiros, D.L., Sales, E.A., Kiperstok, A., 2015. Energy production from microalgae biomass: carbon footprint and energy balance. J. Clean. Prod. 96, 493-500.
Molina-Grima, E., Belarbi, E.-H., Fernández, F., Medina, A., Chisti, Y., 2003. Recovery of microalgal biomass and metabolites: process options and economics. Biotechnol. Adv. 20(7-8), 491-515. Pérez-López, P., González-García, S., Ulloa, R.G., Sineiro, J., Feijoo, G., Moreira, M.T., 2014. Life cycle assessment of the production of bioactive compounds from Tetraselmis suecica at pilot scale. J. Clean. Prod. 64, 323-331.
Qiang, H., Zarmi, Y., Richmond, A., 1998. Combined effects of light intensity, light-path and culture density on output rate of Spirulina platensis (Cyanobacteria). Eur. J. Phycol. 33(2), 165-171.
Rizwan, M., Mujtaba, G., Memon, S., Lee, K., Rashid, N., 2018. Exploring the potential of microalgae for new biotechnology applications and beyond: A review. Renew. Sustain. Energy Rev. 92, 394-404.
Rogers, J., Rosenberg, J., Guzman, B., Oh, V., Mimbela, L., Ghassemi, A., Betenbaugh, M., Oyler, G., Donohue, M., 2014. A critical analysis of paddlewheel-driven raceway ponds for algal biofuel production at commercial scales. Algal Res. 4, 76-88.
Roque, B.M., Salwen, J.K., Kinley, R., Kebreab, E., 2019. Inclusion of Asparagopsis armata in lactating dairy cows’ diet reduces enteric methane emission by over 50 percent. J. Clean. Prod. 234, 132-138.
Roustel, S., 2010. Homogénéisation à haute pression des dispersions alimentaires liquides, Editions T.I. ed. Techniques de l'ingénieur Saint-Denis, France, pp. 1-16.
Rulmeca, 2013. Moving ahead, Informations techniques. Paramètres à prendre en compte pour l'étude et la conception des convoyeurs à bande. Rulmeca France S.A.S., Avelin, France, pp. 18-44. Safi, C., Liu, D., Yap, B., Martin, G., Vaca-Garcia, C., Pontalier, P.-Y., 2014. A two-stage
ultrafiltration process for separating multiple components of Tetraselmis suecica after cell disruption. J. Appl. Phycol. 26(6), 2379-2387.
Sauvant, D., Perez, J., Tran, G., 2004. Composition and nutritives values of feeds materials.Pigs, poultry, cattle, sheep, goats, rabbits, horses and fish. Wageningen Academic Publishers, Wageningen, Netherlands.
Schwenzfeier, A., Wierenga, P., Gruppen, H., 2011. Isolation and characterization of soluble protein from the green microalgae Tetraselmis sp. Bioresour. Technol. 102(19), 9121-9127. Shimako, A.H., Tiruta-Barna, L., Pigné, Y., Benetto, E., Navarrete Gutiérrez, T., Guiraud, P., Ahmadi, A., 2016. Environmental assessment of bioenergy production from microalgae based systems. J. Clean. Prod. 139, 51-60.
Silva, C., Ferreira, A., Dias, A., Costa, M., 2016. A comparison between microalgae virtual
biorefinery arrangements for bio-oil production based on lab-scale results. J. Clean. Prod. 130, 58-67.
Smith, P., Bustamante, M., Ahammad, H., Clark, H., Dong, H., Elsiddig, E.A., Haberl, H., Harper, R., House, J., Jafari, M., 2014. Agriculture, forestry and other land use (AFOLU), Climate change 2014: mitigation of climate change. Contribution of Working Group III to the Fifth Assessment Report of the Intergovernmental Panel on Climate Change. Cambridge University Press, Cambridge, United Kingdom and New York, NY, USA, pp. 811-922.
Sun, C., Xia, A., Liao, Q., Fu, Q., Huang, Y., Zhu, X., 2019. Life-cycle assessment of biohythane production via two-stage anaerobic fermentation from microalgae and food waste. Renew. Sustain. Energy Rev. 112, 395-410.
Wang, X., Guo, F., Li, Y., Yang, X., 2017. Effect of pretreatment on microalgae pyrolysis: Kinetics, biocrude yield and quality, and life cycle assessment. Energy Convers. Manag. 132, 161-171. Wu, W., Lei, Y.-C., Chang, J.-S., 2019. Life cycle assessment of upgraded microalgae-to-biofuel chains. Bioresour. Technol. 288, 121492.
Xu, L., Brilman, D., Withag, J., Brem, G., Kersten, S., 2011. Assessment of a dry and a wet route for the production of biofuels from microalgae: energy balance analysis. Bioresour. Technol. 102(8), 5113-5122.
Zhang, Y., Kendall, A., 2019. Effects of system design and Co-product treatment strategies on the life cycle performance of biofuels from microalgae. J. Clean. Prod. 230, 536-546.
Zhuang, L., Yu, D., Zhang, J., Liu, F., Wu, Y., Zhang, T., Dao, G., Hu, H., 2018. The characteristics and influencing factors of the attached microalgae cultivation: A review. Renew. Sustain. Energy Rev. 94, 1110-1119.
TABLES
Table 1. Nutritional values for microalgae-based protein and comparatives cases (per 100 g)
Algae meal Fish meal
(Sauvant et al., 2004) Soybean meal (Sauvant et al., 2004) Kcal 352.3 489 466 g protein 70.0 70.7 49.6 g fiber 0 0 7.1 g FA unsaturated 0 4.49 1.17 g FA saturated 0 2.06 0.20 mg vitamin C 49.8
(De Roeck-Holtzhauer et al., 1991)
0 0
mg Ca 0.0021
(Fabregas and Herrero, 1986)
0.0045 0.0004
mg Na 0.0010
(Fabregas and Herrero, 1986)
0.0011 0.0001 g sugar added 0 0 0 WNDS* 64.4 39.5 49.7 ∗𝑊𝑁𝐷𝑆 = 100 ·[1.4 · 𝑔 𝑝𝑟𝑜𝑡𝑒𝑖𝑛 100 𝑘𝑐𝑎𝑙 50 𝑔 ⁄ + 3.13 · 𝑔 𝑓𝑖𝑏𝑒𝑟 100 𝑘𝑐𝑎𝑙 25 𝑔 ⁄ + 1.0 · 𝑚𝑔 𝐶𝑎 100 𝑘𝑐𝑎𝑙 1000 𝑚𝑔 ⁄ + 2.51 · 𝑔 𝐹𝐴 𝑢𝑛𝑠𝑎𝑡𝑢𝑟𝑎𝑡𝑒𝑑 100 𝑘𝑐𝑎𝑙 44 𝑔 ⁄ + 0.37 𝑚𝑔 𝑉𝑖𝑡.𝐶 100 𝑘𝑐𝑎𝑙 60 𝑚𝑔 ⁄ − 2.95 · 𝑔 𝐹𝐴 𝑠𝑎𝑡𝑢𝑟𝑎𝑡𝑒𝑑 100 𝑘𝑐𝑎𝑙 20 𝑔 ⁄ − 0.52 · 𝑔 𝑎𝑑𝑑𝑒𝑑 𝑠𝑢𝑔𝑎𝑟 100 𝑘𝑐𝑎𝑙 50 𝑔 ⁄ − 1.34 · 𝑚𝑔 𝑁𝑎 100 𝑘𝑐𝑎𝑙 2400 𝑚𝑔 ⁄ ] Source: (Arsenault et al., 2012).
Table 2. Medium composition Compound kg·kg-1 biomass CO2 2.16 NH4NO3 0.24 NaH2PO4 x 2H2O 0.081 FeCl3 x 6H2O 0.039 MnCl2 x 4H2O 0.0005
Table 3. Life cycle inventory for 1 ha for 1 kg microalgae biomass (FU1) and 1 kg algae meal (FU2)
(Biomass productivity: 20 g·m-2·d-1). RAB-rotational algae biofilm, ORP-open raceway ponds.
Amount Unit Amount Unit
RAB ORP RAB ORP
S1 (Per FU1) S2 (Per FU1)
Inputs Inputs
Electricity 209.7 99.8 Wh Electricity - 190.2 Wh
Freshwater 14.0 10.6 l Fresh biomass (5% DW) - 460.7 kg
Seawater 7.0 5.3 l Steel (machinery) - 4.7 g
Gas (CO2) 431.2 496.4 g Outputs
NH4NO3 7.9 9.1 g Wastewater - 0.9 l
NaH2PO4·2H2O 16.2 18.6 g Products
FeCl3·6H2O 7.8 9.0 g Fresh biomass (20% DW) - 1.0 kg
MnCl2·4H2O 107.5 123.7 mg S3 (Per FU2)
Infrastructure Inputs
Polypropylene 13.9 1.4 g Fresh biomass (20% DW) 47.7 47.6 kg
Synthetic Fabric 6.3 - g Electricity 1638.0 1636.6 Wh
Neoprene 0.5 - g Steel (machinery) 8.2 14.2 g
Steel 28.2 4.8 g Outputs
PVC 1.0 1.1 g Products
Concrete 49.4 56.8 g Fresh biomass (20% DW) 47.7 47.6 kg
Outputs S4 (Per FU2)
CO2 emissions 107.8 124.1 g Inputs
N2O emissions 0.013 0.015 g Fresh biomass (20% DW) 47.7 47.6 kg
NH3 emissions 0.9 1.1 g Electricity 420.5 343.2 Wh
Evaporated water 20.0 14.2 l Steel (machinery) 105.3 121.1 g
Products Outputs
Fresh biomass (20% DW) 1.0 - kg Loss water 7.6 7.6 l
Fresh biomass (5% DW) - 460.7 kg Products
Dry protein powder 1.0 1.0 kg
FIGURES CAPTIONS
Figure 1. Microalgae life cycle system boundaries. Scenarios of microalgae production: RAB-rotating
algae biofilm, ORP-open raceway ponds, FU1: 1 kg microalgae biomass 20%-DW, FU2: 1 kg algae meal, FU3: 1000 WNDS.
Figure 2. Basic schematic of raceway-based rotating algae biofilm (RAB)
Figure 3. Relative contribution of environmental impacts per 1000 WNDS of protein produced. Note: The impacts of microalgae-based protein were set as 1.
Figure 4. Environmental impact of FU1: 1 kg biomass and FU2: 1 kg protein powder. Note: µPt:
micropoint (Eco-points, 1 Pt: annual impact of one European citizen in 2010). RAB-rotating algae biofilm, ORP-open raceway ponds
Figure 5. Energetic requirements. Electricity consumption per subsystem per FU1: 1 kg biomass (a)
and FU2: 1 kg protein powder (b) in RAB and ORP system. Comparison electricity consumption of RAB and ORP at different biomass productivities per FU1: 1 kg biomass (c) and FU2: 1 kg protein powder (d). RAB-rotating algae biofilm, ORP-open raceway ponds
Figure 6. Comparison of greenhouse gases emission and environmental impacts (as single score) for
RAB-rotating algae biofilm and ORP-open raceway ponds at different biomass productivities. Note: µPt: micropoint (Ecopoints, 1 Pt: annual impact of one European citizen in 2010).
Figure 7. Comparison of water consumption, electricity consumption, greenhouse gases emission and
environmental impacts (as single score) for RAB-rotating algae biofilm (Productivity: 30 g·m-2·d) and
ORP-open raceway ponds (Productivity: 15 g·m-2·d). (a) Per FU1-1 kg microalgae biomass at 20%-DW.
(b) Per FU2- 1 kg algae meal. Note: µPt: micropoint (Ecopoints, 1 Pt: annual impact of one European citizen in 2010).
Figure 8. Sensitivity analysis for climate change and single score, FU: 1 kg algae meal production in a
rotating biofilm culture system.
Scenario base: productivity biomass: 20 g·m-2·d-1, evaporation rate: 0.2 cm water·d-1, synthetic fabrics as attaching material, frequency of
change of support material: 4 years, fertilizer: NH4NO3, cell disruption technology: high-pressure homogenization, extraction protein-soluble
efficiency in homogenizer: 40%, velocity flux providing by paddlewheel: 0.25 m·s-1 (0.2 W·m-2).
Table 1. Nutritional values for microalgae-based protein and comparatives cases (per 100 g)
Algae meal Fish meal [39] Soybean meal [39]
Kcal 352.3 489 466 g protein 70.0 70.7 49.6 g fiber 0 0 7.1 g FA unsaturated 0 4.49 1.17 g FA saturated 0 2.06 0.20 mg vitamin C 49.8 [40] 0 0 mg Ca 0.0021 [41] 0.0045 0.0004 mg Na 0.0010 [41] 0.0011 0.0001 g sugar added 0 0 0 WNDS* 64.4 39.5 49.7 ∗𝑊𝑁𝐷𝑆 = 100 ·[1.4 · 𝑔 𝑝𝑟𝑜𝑡𝑒𝑖𝑛 100 𝑘𝑐𝑎𝑙 50 𝑔 ⁄ + 3.13 · 𝑔 𝑓𝑖𝑏𝑒𝑟 100 𝑘𝑐𝑎𝑙 25 𝑔 ⁄ + 1.0 · 𝑚𝑔 𝐶𝑎 100 𝑘𝑐𝑎𝑙 1000 𝑚𝑔 ⁄ + 2.51 · 𝑔 𝐹𝐴 𝑢𝑛𝑠𝑎𝑡𝑢𝑟𝑎𝑡𝑒𝑑 100 𝑘𝑐𝑎𝑙 44 𝑔 ⁄ + 0.37 𝑚𝑔 𝑉𝑖𝑡.𝐶 100 𝑘𝑐𝑎𝑙 60 𝑚𝑔 ⁄ − 2.95 · 𝑔 𝐹𝐴 𝑠𝑎𝑡𝑢𝑟𝑎𝑡𝑒𝑑 100 𝑘𝑐𝑎𝑙 20 𝑔 ⁄ − 0.52 · 𝑔 𝑎𝑑𝑑𝑒𝑑 𝑠𝑢𝑔𝑎𝑟 100 𝑘𝑐𝑎𝑙 50 𝑔 ⁄ − 1.34 · 𝑚𝑔 𝑁𝑎 100 𝑘𝑐𝑎𝑙 2400 𝑚𝑔 ⁄ ] Source: [18]
Table 2. Medium composition
Compound kg·kg-1 biomass CO2 2.16 NH4NO3 0.24 NaH2PO4 x 2H2O 0.081 FeCl3 x 6H2O 0.039 MnCl2 x 4H2O 0.0005
Table 3. Life cycle inventory for 1 ha for 1 kg microalgae biomass (FU1) and 1 kg algae meal (FU2)
(Biomass productivity: 20 g·m-2·d-1). RAB-rotational algae biofilm, ORP-open raceway ponds.
Amount Unit Amount Unit
RAB ORP RAB ORP
S1 (Per FU1) S2 (Per FU1)
Inputs Inputs
Electricity 209.7 99.8 Wh Electricity - 190.2 Wh
Freshwater 14.0 10.6 l Fresh biomass (5% DW) - 460.7 kg
Seawater 7.0 5.3 l Steel (machinery) - 4.7 g
Gas (CO2) 431.2 496.4 g Outputs
NH4NO3 7.9 9.1 g Wastewater - 0.9 l
NaH2PO4·2H2O 16.2 18.6 g Products
FeCl3·6H2O 7.8 9.0 g Fresh biomass (20% DW) - 1.0 kg
MnCl2·4H2O 107.5 123.7 mg S3 (Per FU2)
Polypropylene 13.9 1.4 g Fresh biomass (20% DW) 47.7 47.6 kg
Synthetic Fabric 6.3 - g Electricity 1638.0 1636.6 Wh
Neoprene 0.5 - g Steel (machinery) 8.2 14.2 g
Steel 28.2 4.8 g Outputs
PVC 1.0 1.1 g Products
Concrete 49.4 56.8 g Fresh biomass (20% DW) 47.7 47.6 kg
Outputs S4 (Per FU2)
CO2 emissions 107.8 124.1 g Inputs
N2O emissions 0.013 0.015 g Fresh biomass (20% DW) 47.7 47.6 kg
NH3 emissions 0.9 1.1 g Electricity 420.5 343.2 Wh
Evaporated water 20.0 14.2 l Steel (machinery) 105.3 121.1 g
Products Outputs
Fresh biomass (20% DW) 1.0 - kg Loss water 7.6 7.6 l
Fresh biomass (5% DW) - 460.7 kg Products
Dry protein powder 1.0 1.0 kg
FIGURES
Figure 1. Microalgae life cycle system boundaries. Scenarios of microalgae production: RAB-rotating
algae biofilm, ORP-open raceway ponds, FU1: 1 kg microalgae biomass 20%-DW, FU2: 1 kg algae meal, FU3: 1000 WNDS.
FU2 FU3 FU1
S1-Cultivation S2-Biomass concentration S3-Cell-disruption S4-Protein recovery
Open raceways Rotation algal biofilm
Settlers Membranes Centrifuges
High Pressure Homogenization High Pressure Homogenization Centrifuges Two-phase Ultrafiltration Drying ORP RAB Centrifuges Two-phase Ultrafiltration Drying Sc en ar io s 0.5 g/l 200 g/l 200 g/l Biomass Biomass Algae meal Animal feed Algae meal Animal feed Water 200 g/l 130 g/l 10 g/l
Figure 2. Basic schematic of raceway-based rotating algae biofilm (RAB) Biofilm' Liquid'reservoir'' Paddlewheel' Flow' Drive'Sha7 s' Steel'Structure'
Figure 3. Relative contribution of environmental impacts per 1000 WNDS of protein produced. Note: The impacts of microalgae-based protein were set as 1.
(a)
(b)
Figure 4. Environmental impact of FU1: 1 kg biomass and FU2: 1 kg protein powder. Note: µPt:
micropoint (Eco-points, 1 Pt: annual impact of one European citizen in 2010). RAB-rotating algae biofilm, ORP-open raceway ponds
(a) (b)
(c) (d)
Figure 5. Energetic requirements. Electricity consumption per subsystem per FU1: 1 kg biomass (a)
and FU2: 1 kg protein powder (b) in RAB and ORP system. Comparison electricity consumption of RAB and ORP at different biomass productivities per FU1: 1 kg biomass (c) and FU2: 1 kg protein powder (d). RAB-rotating algae biofilm, ORP-open raceway ponds
Figure 6. Comparison of greenhouse gases emission and environmental impacts (as single score)
for RAB-rotating algae biofilm and ORP-open raceway ponds at different biomass productivities. Note: µPt: micropoint (Ecopoints, 1 Pt: annual impact of one European citizen in 2010).
(a) (b)
Figure 7. Comparison of water consumption, electricity consumption, greenhouse gases emission and
environmental impacts (as single score) for RAB-rotating algae biofilm (Productivity: 30 g·m-2·d) and
ORP-open raceway ponds (Productivity: 15 g·m-2·d). (a) Per FU1-1 kg microalgae biomass at 20%-DW.
(b) Per FU2- 1 kg algae meal. Note: µPt: micropoint (Ecopoints, 1 Pt: annual impact of one European citizen in 2010).

![Table 1. Nutritional values for microalgae-based protein and comparatives cases (per 100 g) Algae meal Fish meal [39] Soybean meal [39]](https://thumb-eu.123doks.com/thumbv2/123doknet/13409491.407000/22.918.318.580.756.903/table-nutritional-values-microalgae-protein-comparatives-algae-soybean.webp)