Vol. 7(8), pp. 310-316, August 2013 DOI: 10.5897/AJPS12.119
ISSN 1996-0824 ©2013 Academic Journals http://www.academicjournals.org/AJPS
African Journal of Plant Science
Full Length Research Paper
Test modeling of the growth of self-fertilized embryos
of Phaseolus vulgaris L. and Phaseolus coccineus L.
genotypes
Pamphile NGUEMA NDOUTOUMOU
1*, Gino BOUSSIENGUI BOUSSIENGUI
1, Albert NGAKOU
2,
Yves BROSTAUX
3, André TOUSSAINT
3and Jean Pierre BAUDOIN
31Institut National Supérieur d’Agronomie et de Biotechnologies (INSAB), Université des Sciences et Techniques de Masuku, B. P. 99 Poto-Poto Franceville, Gabon.
2Département des Sciences Biologiques, Faculté des Sciences, Université de N’Gaoundéré, B. P. 454 N’Gaoundéré, Cameroun.
3
Unité de Phytotechnie Tropicale et Horticulture, Gembloux Agro Bio Tech, Université de Liège, Passage des Déportés, 2, B-5030, Gembloux, Belgique.
Accepted 28 June, 2013
Biologists usually rely on modelling tools as well as simulation to try to understand the behaviour of biological phenomena theories. In this research study, we focus on the development and study of mathematical models from environmental problems about genotypes of Phaseolus coccineus L. (NI16 and NI1108) and Phaseolus vulgaris L. (NI637 and X707). Interspecific crosses and histological sections were performed; thereafter, samples were fixed, followed by rinsing and dehydrating in an increasing gradient of ethyl alcohol. After staining procedure, microscope slides of blades were coated with one to three drops of mounting medium DPX (BDH360294H). Analysis of variance (ANOVA I) was conducted, followed by Tukey’s test at a significance level of 95%. All statistical analyses were performed using the software MINITAB Release 14. Results reveal divergence of growth rates and thus embryo development between the two species (P. coccineus and P. vulgaris) and between parental and embryos hybrid [P.
vulgaris (♀) × P. coccineus]. In this model, a common law of evolution for the different types of embryos was established; it describes the interactions between the length of the embryo, the number of days after pollination and stage of embryo development. Thus, the individualized modeling growth in length of inbred and hybrid embryos margin fluctuations and extrinsic individual responses must be attributed to the plant, which better reflect the embryo development.
Key words: Modelling, plant embryos, Phaseolus, growth, inter-specific hybridizations.
INTRODUCTION
Growth of the embryo refers to quantitative changes especially as it applies to increased dimensions by
operating auxèse and also by cell merese. At one point, it is the result of a balance between endogenous growth
*Corresponding author. E-mail: [email protected]. Tel: +241 07 711 001. Fax: +241 671 734.
Abbreviations: DAP, Days after pollination; HEMA, 2-Hydrxyethyl Methacrylate; NI, introduction number; X, number of pending
processes and the influence of environmental factors. Analysis of this growth can reveal the intrinsic charac-teristics of the mode of development of the genotype, and by extension of the species. It can thus translate the nature and sequence of the process of morphogenetic activity of the embryo. The length of the embryo is an important parameter because it is one of the main criteria for defining morphological stages during embryogenesis and identification of physiological activities of plant embryos (Monnier, 1976). For this reason, previous knowledge of the growth model of self-fertilized embryos of Phaseolus is an important step for improving the protocols in vitro culture in terms of difficulty of rescuing hybrid embryos obtained by natural methods (Barikissou and Baudoin, 2011; Nguema et al., 2013). Thus, with a growth model embryo length, it is possible to predict the likely evolution of the embryos of the same genotype and by extension the embryos of future generations, if we accept the hypothesis that the processes that regulate the growth phenomenon (climate, substrate fertility, etc.) remain the same (El Abdllaoui, 2004). From time tracking data, we can build models of evolution on past phenol-menon. For example, we can determine the equations of dynamics of growth of a tree of a given species. Thus, using our model of growth of a tree, we can predict the likely evolution of a population for years to come, and optimize intervention dates.
On the other hand, one can quote the model centred on the individual. These models seek to describe the pro-cess starting from the individual and the introduction of biological, behavioural parameters specific to each individual. Thus, they describe changes in populations as a result of changes in individuals. These models are mostly so complicated that an analytical study is impos-sible and only a numerical implementation can be applied to them. There is, in fact, an almost continuous range of possible models between minimum and all-individual models. The models represent a continuum of complexity from simple to complex response curves marine sequen-ces of aquatic food chains (Kremer and Nixon, 1976; Steele and Henderson, 1993; Steele, 2006; Szallasi and Stelling, 2006). Current knowledge of the people that make any model necessarily involves a mixture of laws observed, experimentally quantified and phenomenolo-gical terms. For example, inter-personal relationships are often ignored and cannot be described from a phenome-nological point of view. Models can be explanatory or predictive. A first step in modelling is the definition of the objectives of the study. These objectives will determine not only the scope of the model but also the type of model used and the type of results that will be searched. The same construction model of a complex system is used to identify the "simple" system components and describe the interactions between these components and external variables of the system and between the com-ponents themselves (Franks et al., 1986). The models that will be considered and studied in this work are illus-
Ndoutoumou et al. 311
trative and are used to test different scenarios and progress when confronted with data. Understanding the functioning of an ecosystem (Murray, 1990) is a major challenge for the management of resources and the envi-ronment. However, this goal remains elusive for the complexity of natural systems, especially in the aquatic environment where many processes interact with all kinds of living organisms (O’Malley and Dupré, 2005).
Several interesting questions can be asked about ecosystems (Pielou, 1977):
1) What are the factors that influence the stability of an ecosystem?
2) What are the factors controlling the variability of abundance of different components of the ecosystem, including its structure?
3) What is the impact of spatial heterogeneity on the interactions between people and the behaviour of the ecosystem?
4) What are the changes in abundance due to natural or anthropogenic changes in the environment?
To answer these questions, different methodological approaches exist, which include direct observation of the environment, experiments in vitro and in situ, mathe-matical and computer modelling. This research is aimed towards the development and study of mainly theoretical and mathematical models. Mathematical modelling is primarily the expression of an effort to explain relations in phenomena involving relationship between the abun-dances of several populations; it provides a theoretical system capable of combining these quantities according to known or assumed mechanisms. Some have probably chosen this path for a portion of their careers. The study and understanding of forest biological processes such as photosynthesis, growth, competition between trees of the same species or different species was required to build and optimize the management methods of the stands you will need to use. Currently, researchers have developed models of increasing complexity, which facilitate the pre-diction of stand development, enable better management and respond more effectively to the expectations of production, public reception and conservation.
First, we must distinguish between the quantitative data (speed, height, etc) with the often more difficult to study qualitative data (results of social surveys). So, any simplified representation of reality is referred to as a model. Relations between variables highlighted by the analysis of data are often more complex than a simple comparison of means, and are often represented by curves or mathematical functions. Thus, it can be said to be a model of the relationship between these two varia-bles. For example, the allometric relationship between the circumference and height of a tree can be modelled by a parabolic curve (Fisher and Henziger, 2007). Again, data analysis is the first step that leads to the construction of a model. The model will then be adjusted
312 Afr. J. Plant Sci. 0 500 1000 1500 2000 2500 3000 3500 4000 4500 5000 5500 6000 0 5 10 15 L e n g th o f th e e m b ry o (µ m )
Number of days after pollination
Mesures Equation 0 500 1000 1500 2000 2500 3000 3500 4000 4500 5000 5500 6000 0 5 10 15 L e n g th o f th e e m b r y o (µ m )
Number of days after pollination
Mesures Equation Measures 0 500 1000 1500 2000 2500 3000 3500 4000 4500 5000 5500 6000 0 5 10 15 L e n g th o f th e e m b ry o (µ m )
Number of days after pollination
Mesures EquationEquation
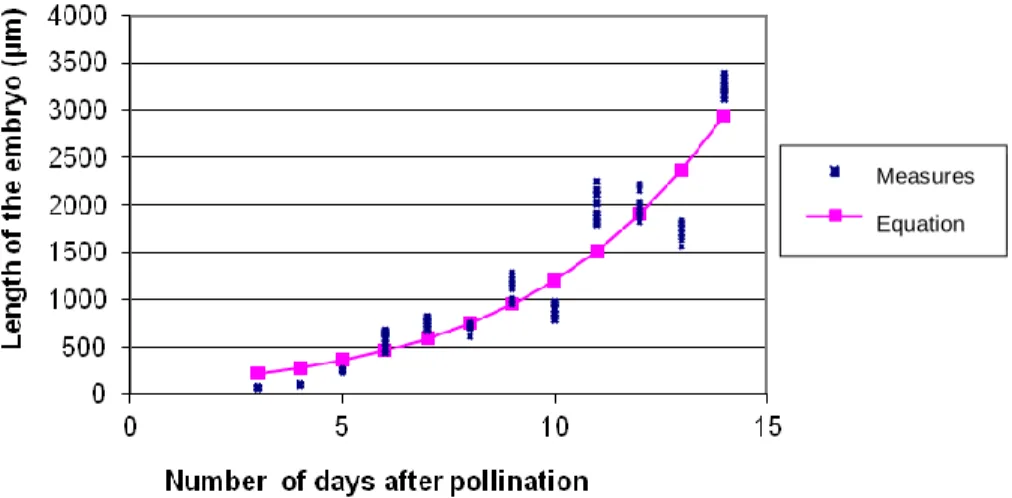
Figure 1. Growth curves and modeling of the average length of embryos in the NI637 cv of P.
vulgaris, depending on the number of DAP.
on a first set of data, which is, computing the values of the model parameters that best fit the observed data. Finally, to test this research hypothesis, the model needs to be validated, that is, its effectiveness to reproduce the real world needs to be measured by comparing it to another independent data set.
MATERIALS AND METHODS
The genotypes used are NI16 and NI1108 for Phaseolus coccineus L. and NI637 and X707 for Phaseolus vulgaris L. These cultivars except NI1108 are identified by their Introduction Number (NI), number or waiting (X) in the National Botanic Garden of Belgium. The culture conditions are identical to those described by Nguema et al. (2013). Interspecific crosses are performed according to the method of Buishand (1956). The histological sections were performed following the proposed firm Technovit™ protocol, inspired by Ruzin (1999), described and improved by Toussaint et al. (2002). The main steps in this protocol are fixing the samples followed by rinsing and dehydration in an increasing gradient of ethyl alcohol. This results in a penetration of objects in resin and then coating of the objects. The semi-thin sections (3 to 5 μm) are made to the rotary microtome. After staining procedure according to Guttman (1995) for the general observation of structures, micro-scope slides of blades are coated with one to three drops of mounting medium DPX (BDH360294H). The sections were observed using a Nikon microscope (Model Eclipse E800). The images, taken by a colour type JVC 3-CCD (model KY-F58) camera, are captured by the Archive Plus 4.1 software, using the contrast Gamma. The length of the embryo (microns) is measured between the base of the suspensor (micropylar side) and the apex point of the embryo proper (chalazal side). We conducted an analysis of variance (ANOVA I) followed by Tukey's test at a signi-ficance level of 95%.
All statistical analyses were performed using the software MINITAB Release 14. We have begun to model the growth in length of parental embryos. Growth curves and models are mathe-matical functions representing generally changing parameters (height, weight, etc.) of an organism or organ over time. They are useful in this context to explain the dynamics of embryogenesis. The choice of a model asymmetric curve is required in this case because of the pace of growth varied rhythms of a genotype to
another or to another genotypic combination. Nelder (1961, 1962) model seems appropriate for our study because of its simplicity and ability to represent various types of growth. The mathematical formulation as follows:
y = M / {1 + n exp[-(x-a)/b]}1/n
The parameters of the equation and its benefits have been defined in the first part of this work. It is useful to redefine "n" as a dimen-sionless parameter involved in models of variable shape. The parameters (a, b and M) were calculated using the Excel Solver XP Professional, in accordance with the law of least squares between the experimental and calculated values. These variables a, b and M respectively express the inflection point of the curve (point of maximum growth in DAP), point spread of the phenomenon of exponential growth on the x-axis in DAP (associated with growth rate) and the extreme value which is towards the final size of the embryo (in microns). Calculation of the average growth rate can guide the interpretation of results, to complete comparisons bet-ween genotypes. The main variable (a, b, M) curves of growth in length of embryos derived from crosses between P. vulgaris and P.
coccineus were obtained according to the mathematical model of
Nelder (1961, 1962):
y = M/{1+n.exp[-(x-a)/b]}1/n, of n = 1
The calculation was done using Solver (Excel XP Pro) and following the law of least squares between the experimental and calculated values.
RESULTS
Changing the length of parental modelling and embryos (P. vulgaris and P. coccineus)
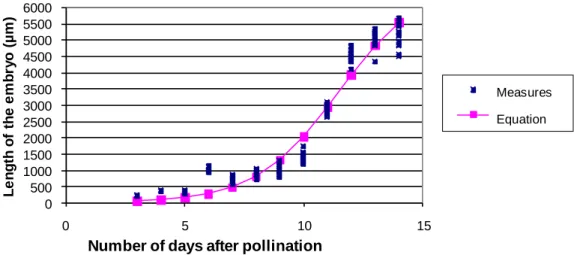
Figures 1, 2, 3 and 4 illustrate the evolution of length of self-fertilized embryos and the modelling of the geno-types NI637, X707, NI16 and NI1108 respectively.
The modelling of their growth in length was done bet-ween 3 and 14 days after pollination (DAP). The growth in length of self-fertilized embryos of P. vulgaris (NI637
Ndoutoumou et al. 313 0 500 1000 1500 2000 2500 3000 3500 4000 4500 5000 5500 6000 0 5 10 15 L e n g th o f th e e m b r y o (µ m )
Number of days after pollination
Mesures Equation Measures 0 500 1000 1500 2000 2500 3000 3500 4000 4500 5000 5500 6000 0 5 10 15 L e n g th o f th e e m b ry o (µ m )
Number of days after pollination
Mesures EquationEquation
Figure 2. Growth curves and modeling of the average length of embryos in the X707 cultivar of P.
vulgaris depending on the number of DAP.
0 500 1000 1500 2000 2500 3000 3500 4000 4500 5000 5500 6000 0 5 10 15 L e n g th o f th e e m b r y o (µ m )
Number of days after pollination
Mesures Equation Measures 0 500 1000 1500 2000 2500 3000 3500 4000 4500 5000 5500 6000 0 5 10 15 L e n g th o f th e e m b ry o (µ m )
Number of days after pollination
Mesures EquationEquation 0 500 1000 1500 2000 2500 3000 3500 4000 4500 5000 5500 6000 0 5 10 15 L e n g th o f th e e m b r y o (µ m )
Number of days after pollination
Mesures Equation Measures 0 500 1000 1500 2000 2500 3000 3500 4000 4500 5000 5500 6000 0 5 10 15 L e n g th o f th e e m b ry o (µ m )
Number of days after pollination
Mesures EquationEquation
Figure 3. Growth curves and modeling of the average length of embryos in cv NI16 of P.
coccineus, depending on the number of DAP.
0 500 1000 1500 2000 2500 3000 3500 4000 4500 5000 5500 6000 0 5 10 15 L e n g th o f th e e m b r y o (µ m )
Number of days after pollination
Mesures Equation Measures 0 500 1000 1500 2000 2500 3000 3500 4000 4500 5000 5500 6000 0 5 10 15 L e n g th o f th e e m b ry o (µ m )
Number of days after pollination
Mesures EquationEquation
Figure 4. Growth curves and modeling of the average length of embryos in the genotype
314 Afr. J. Plant Sci. 0 500 1000 1500 2000 2500 3000 3500 4000 4500 5000 5500 6000 0 5 10 15 L e n g th o f th e e m b ry o (µ m )
Number of days after pollination
Mesures Equation Measures 0 500 1000 1500 2000 2500 3000 3500 4000 4500 5000 5500 6000 0 5 10 15 L e n g th o f th e e m b ry o (µ m )
Number of days after pollination
Mesures EquationEquation
Figure 5. Growth curves and modeling of the average length of hybrid embryos [NI637
(♀) × NI16], depending on the number of DAP.
0 500 1000 1500 2000 2500 3000 3500 4000 4500 5000 5500 6000 0 5 10 15 L e n g th o f th e e m b r y o (µ m )
Number of days after pollination
Mesures Equation Measures 0 500 1000 1500 2000 2500 3000 3500 4000 4500 5000 5500 6000 0 5 10 15 L e n g th o f th e e m b ry o (µ m )
Number of days after pollination
Mesures EquationEquation
Figure 6. Growth curves and modeling of the average length of hybrid embryos
[NI637 (♀) × NI1108], depending on the number of DAP.
and X707) is progressive. The curve representing the increase is sigmoidal in shape. This curve consists of three phases defined as the adaptation phase (or latency period) during which the embryo adapts to its new environment and mechanisms are put in place for growth. On average, self-fertilized embryos of P. vulgaris reach the stage of development in hickory young at that time. Cell divisions continue and cotyledon initiation begins. This phase ends after two to three days on average to make way for the second phase which is characterized by an exponential growth in the size of the embryo. This is the time during which the embryo is in full possession of its abilities for growth. There is a synergy of activities specific to the ovule and embryo structure for growing the latter. The physiological activity relates to the formation of cotyledons at the beginning of the accumulation of lipid products and storage of organic elements. The stationary phase begins around 12 DAP in the X707 genotype and later in the genotype NI637. It corresponds to the storage capacity of the embryo in its environment without
resor-ting to heavy intake of nutrients. It precurses maturation, desiccation and dormancy of the embryo before ger-mination. These curves of growth in length of self-fertili-zed embryos of P. coccineus genotypes (NI16 and NI1108) are also sigmoid shaped. However, due to the short period during which the observations were made, it is not possible to graphically represent the last phase of this development (stationary phase).
Ripening and drying were observed to occur in embryos of P. coccineus beyond 14 DAP, unlike the embryos of P. vulgaris, which has a time limit of 12 DAP on the average.
Changes in length and modelling of growth in length of hybrid embryos
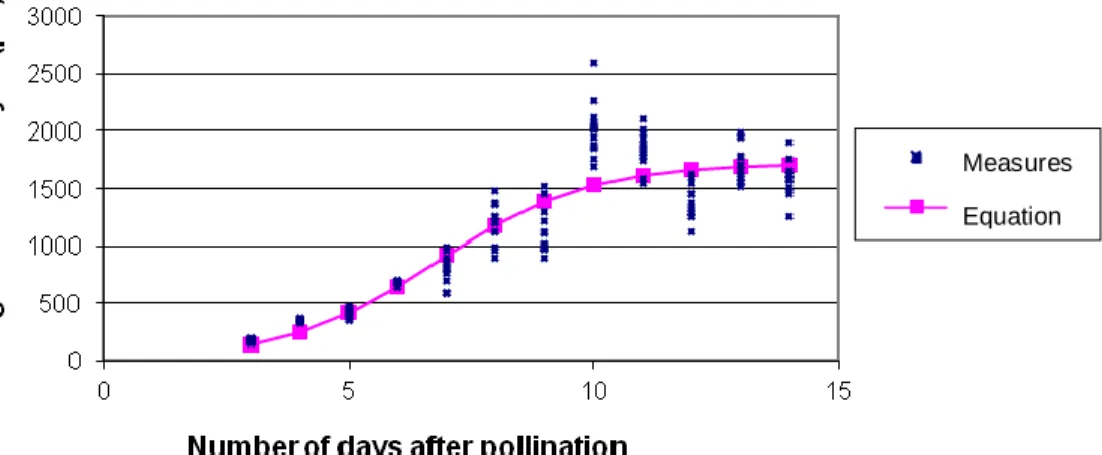
Figures 5, 6 and 7 show the growth curves and modelling of hybrid embryos in crosses [NI637 (♀) x NI16], [NI637 (♀) x NI1108] and [X707 (♀) x NI16], respectively. The modeling corresponds to the changes in length of the
Ndoutoumou et al. 315 0 500 1000 1500 2000 2500 3000 3500 4000 4500 5000 5500 6000 0 5 10 15 L e n g th o f th e e m b r y o (µ m )
Number of days after pollination
Mesures Equation Measures 0 500 1000 1500 2000 2500 3000 3500 4000 4500 5000 5500 6000 0 5 10 15 L e n g th o f th e e m b ry o (µ m )
Number of days after pollination
Mesures EquationEquation
Figure 7. Growth curves and modeling of the average length of hybrid embryos [X707 (♀)
× NI16], depending on the number of DAP.
Table 1. Calculated values of the parameters a, b and M from the growth curves of self-fertilized embryos (P. vulgaris and P.
coccineus) and hybrid [P. vulgaris (♀) × P. coccineus].
Species and crosses Genotypes and genotypic combinations Parameter
M (µm) a (DAP) b (DAP) mv (µm/DAP)
P. vulgaris NI637 6826 11.5 1.7 669.2 X707 1721 6.8 1.5 191.2 P. coccineus NI16 20121 21.1 4.0 838.4 NI1108 22419 20.5 3.2 1167.7 P. vulgaris (♀) x P. coccineus NI637 × NI16 21263 15.9 2.4 1476.6 NI637 × NI1108 20048 27.4 3.3 1012.5 X707 × NI16 5601 12.6 2.3 405.9
M = Maximum value towards the final length of the embryo; a = inflection point of the curve (growth point in maximum length i n DAP); b = spreading phenomenon of exponential growth in the x-axis DAP (associated with the growth rate); mv = average speed of growth of the embryo.
hybrid embryos P. vulgaris (♀) x P. coccineus between 3 and 14 days after pollination. In parental genotypes, the growth curve of the length of the embryo is positive. By way of comparison, during hybridization, growth slowed between 4 and 5 DAP, including genotypic combination, NI16 × NI637. This is a critical moment in embryogenesis during which the abortion process of the hybrid embryo would be triggered. Table 1 summarizes the calculated values of inflection point of the curves (a) and spreading phenomenon of exponential growth in the x-axis DAP (b). The values of the variable ‘M’ are higher for genotypes of
P. coccineus. This behaviour corresponds to the intrinsic
phenotypic traits (size and length) of seeds genotypes. Under the parameter "a", the embryo requires more time in the species P. coccineus to achieve maximum growth rate. Finally, the growth phenomenon lasts less than two days in P. vulgaris genotype, 3 and 4 days, respectively in P. coccineus (NI1108 and NI16). In hybrids, P. vulgaris (♀) × P. coccineus, the parameter "a" shows intermediate
values to those of the parental genotypes. Comparison of the parameters a, b and M in the supposed descendants hybrid, P. vulgaris (♀) × P. coccineus, reveals that the growth in length of the hybrid embryos differs from each other by the size of the variable M (final length toward which the embryo) and the parameter (a) that expresses the day growth is the most important. For comparison, the number of days during which the maximum growth spreads (b) is close between the three genotypic com-binations. It ranges between 2 and 3 DAP.
DISCUSSION
The pattern of growth in length of embryos developed in this work reveals the divergence of growth rates and thus embryo development between the two species (P.
coccineus and P. vulgaris), on one hand, and between
316 Afr. J. Plant Sci.
on the other hand. This model establishes a common law evolution for these different types of embryos. It des-cribes the interactions between the length of the embryo, the number of days after pollination and stage of embryo development. This may account, in the case of failure of embryo development, for the differences observed bet-ween the modelled size and growth of the embryo actually measured. The growth in length of hybrid em-bryos P. coccineus (♀) × P. vulgaris does not follow the model proposed by this law. This singularity is related to the heterogeneity of the average measured values reflec-ting abnormal development of these hybrid embryos. This observation supports the hypothesis of a post-zygotic incompatibility pronounced in crosses P. coccineus (♀) ×
P. vulgaris according to Barikissou and Baudoin (2011).
Modelling the growth in length of embryos can be a complement to the traditional method of determining the stage of embryo development by the number of days after pollination. Its use can lead to the rescue of hybrid embryos through in vitro culture because it determines the characteristic moments of acceleration and decelera-tion of the growth of the embryo. This is an important indication of the type of definition of nutrients required by the embryo, since we know the specific physiological activity of the embryo at each stage of development. It can thus be a useful tool for decision in anticipation of rescue of hybrid embryos in interspecific crosses in the genus Phaseolus.
The exact time for the embryo to reach a critical stage of development is difficult to determine. The results obtained using the model of growth curves developed by Nelder (1961, 1962) were used to estimate the time required by the embryo to reach a phase of significant growth and the number of days affected by this growth. The results clearly indicate that no embryo reaches its maximum speed of development before 6 DAP. Further-more, the duration of the exponential phase of growth in length of the embryo does not exceed 4 days. Changes in the size of suspensor of the embryo and cotyledons can also be modeled and provide additional parameters to estimate the critical period of embryonic development in species P. coccineus and P. vulgaris, and by extension in the hybrid P. coccineus × P. vulgaris. The main reason for the difficulty in modeling the growth in length of hybrid embryos P. coccineus (♀) × P. vulgaris is the variability of measures relating to embryos from this cross. Modeling should not, however, seem simplistic and deprive the representation of the dynamics of embryogenesis and synergy of genetic, physiological and hormonal parame-ters that control. Therefore, we must give the indivi-dualized modelling growth in length of inbred and hybrid embryos margin fluctuations and extrinsic individual res-ponses to the plant, which better reflect the embryonic development. It thus appears interesting to analyze the data and model to highlight the control periods of growth and the role embryonic development can play in impro-ving the understanding of post-zygotic incompatibility
phenomena within the genus Phaseolus.
REFERENCES
Barikissou E, Baudoin JP (2011). Refinement of an in vitro culture technique for the rescue of globular embryos using microcutting for P.
vulgaris L. and P. coccineus L. Tropicultura 29(4):218-224.
Buishand TJ (1956). The crossing of beans (Phaseolus sp.). Euphytica 5:41-50.
El Abdllaoui A (2004). Mathematical modeling study of some problems of population dynamics. Mohammed V University Agdal, Faculty of Science, Rabat, Morocco, PhD thesis. p.195.
Gutmann M (1995). Improved staining procedures for photographic documentation of phenolic deposits in semi-thin sections of plant tissue. J. Microsc. 179(3):277-281.
Fisher J, Henziger T (2007). Executable Cell Biology. Nat. Biotechnol. 25(11):1239-1249.
Franks PJS, Wroblewski JS, Flierl GR (1986). Prediction of phytoplankton growth in response to the frictional decay of a warm-core ring. J. Geophys. Res. Oceans 91(C6): 7603–7610.
Guttman M (1995). Improved staining procedures for photographic documentation of phenolic deposits in semithin sections of plant tissue. J. Microsc.179:277-281.
Kremer P, Nixon S (1976). Distribution and abundance of the ctenophore, Mnemiopsis leidyi in Narragansett Bay. Estuar. Coast. Mar. Sci. 4(6):627-639.
Monnier M (1976). Culture in vitro de l'embryon immature de Capsella
Bursa-pastoris Moench. Rev. Cyt. Biololgie Végétale 39:1-120.
Murray JD (1990). Mathematical Biology. Springer-Verlag. New York. Nelder JA (1961). The fitting of a generalization of the logistic curve.
Biom. 17:89-110.
Nelder JA (1962). An alternative form of generalized logistic equation. Biom. 18:614-616.
Nguema NP, Toussaint A, Baudoin JP (2013). Etude histologique des embryons avortés lors des croisements entre Phaseolus vulgaris L. et Phaseolus coccineus L. Int. J. Biol. Chem. Sci. 7(1) :213-224. O’Malley M, Dupré J (2005). Fundamental Issues in Systems Biology.
BioEssays 27: 1270-1276.
Pielou EC (1977). Mathematical Ecology. John Wiley and Sons, New York.
Ruzin SE (1999). Plant microtechnique and microscopy. USA, Cover design.
Steele JH, Henderson EW (1993). The significance of interannual variability. In: Towards a Model of Ocean Biogeochemical Processes. Eds. G.T. Evans and M.J .R. Fasham. Springer-Verlag, pp.237-260. Steele JH (2006). Are there eco-metrics for fisheries? Fish. Res. 77:1–3 Szallasi Z, Stelling J (2006). System modelling in cellular biology.
Lavoisier Paris. p .448.
Toussaint A, Geerts P, Clément F, Mergeai G, Baudoin JP (2002). Regeneration of Phaseolus vulgaris L. and Phaseolus polyanthus Greenm. from immature embryos for their interspecific hybridization. VIIIth Scientific Days - AUF. Marrakech (Morocco).
![Figure 6. Growth curves and modeling of the average length of hybrid embryos [NI637 (♀) × NI1108], depending on the number of DAP](https://thumb-eu.123doks.com/thumbv2/123doknet/5921031.145335/5.918.222.712.436.680/figure-growth-curves-modeling-average-length-embryos-depending.webp)