HAL Id: hal-01285402
https://hal.sorbonne-universite.fr/hal-01285402
Submitted on 9 Mar 2016HAL is a multi-disciplinary open access archive for the deposit and dissemination of sci-entific research documents, whether they are pub-lished or not. The documents may come from teaching and research institutions in France or abroad, or from public or private research centers.
L’archive ouverte pluridisciplinaire HAL, est destinée au dépôt et à la diffusion de documents scientifiques de niveau recherche, publiés ou non, émanant des établissements d’enseignement et de recherche français ou étrangers, des laboratoires publics ou privés.
When riverine dissolved organic matter (DOM) meets
labile DOM in coastal waters: changes in bacterial
community activity and composition
Marine Blanchet, Olivier Pringault, Christos Panagiotopoulos, Dominique
Lefèvre, Bruno Charrìère, Jean-François Ghiglione, Camila Fernandez, Fran L.
Aparicio, Cèlia Marrasé, Philippe Catala, et al.
To cite this version:
Marine Blanchet, Olivier Pringault, Christos Panagiotopoulos, Dominique Lefèvre, Bruno Charrìère, et al.. When riverine dissolved organic matter (DOM) meets labile DOM in coastal waters: changes in bacterial community activity and composition. Aquatic Sciences - Research Across Boundaries, Springer Verlag, 2017, 79 (1), pp.27-43. �10.1007/s00027-016-0477-0�. �hal-01285402�
Aquatic Sciences
DOI: 10.1007/s00027-016-0477-0
When riverine dissolved organic matter (DOM) meets labile DOM in
coastal waters: changes in bacterial community activity and composition
Marine Blanchet1, Olivier Pringault2, Christos Panagiotopoulos3, Dominique Lefèvre3, Bruno
Charrière3†, Jean-François Ghiglione1, Camila Fernandez1, Fran L. Aparicio4, Cèlia Marrase4,
Philippe Catala1, Louise Oriol1, Jocelyne Caparros1, Fabien Joux1*
1 Sorbonne Universités, UPMC Univ Paris 06, CNRS, Laboratoire d'Océanographie Microbienne (LOMIC), Observatoire Océanologique, F-66650, Banyuls/mer, France
2 UMR5119 Ecologie des systèmes marins côtiers (ECOSYM), CNRS, IRD, UM2, UM1; Université Sciences et Techniques du Languedoc Montpellier 2. F-34095 Montpellier Cedex 5, France
3 Aix Marseille Université, Mediterranean Institute of Oceanography (MIO), 13288, Marseille, cedex 09, Université du Sud-Toulon-Var, 83587, CNRS-INSU/IRD UM 110, France
4 Institut de Ciències del Mar (CSIC), Passeig Marítim de la Barceloneta, 37, 08003 Barcelona, Spain
† present adress: Centre de Formation et de Recherche sur l’Environnement Méditerranéen (CEFREM, UMR CNRS 5110), Bât. U, Université de Perpignan, Via Domitia (UPVD), 66860 Perpignan, France
*corresponding author: Phone: 33(0)4 6888 7342 ; email: [email protected]
Abstract
Heterotrophic bacterial communities in marine environments are exposed to a heterogeneous mixture of dissolved organic compounds with different bioreactivity that may control both their activity and composition. The coastal environment is an example of a mixing area where recalcitrant allochthonous organic matter from rivers can encounter labile organic matter from marine phytoplanktonic blooms. The objective of this study was to explore the effects of mixed qualities of dissolved organic matter (DOM) on bacterial community activity (BCA) and bacterial community composition (BCC) and to test for a priming effect when DOM sources are added in combination. Coastal marine bacterial communities were incubated separately with a mixture of amino acids and with natural riverine DOM or with both sources together for 42 days. Addition of amino acids alone or in combination with riverine DOM led to a similar stimulation of BCA compared to control condition, whereas addition of riverine DOM alone did not modify BCA compared to the control. On the contrary, BCC analyzed by 16S rRNA gene pyrosequencing was not affected by the addition of amino acids alone, but changed dramatically with riverine DOM alone or in combination with amino acids. Our
results show that changes in BCA and BCC can be driven by different types of DOM, but that these changes are not necessarily coupled. Moreover, the addition of labile DOM did not modify the microbial decomposition of riverine DOM, nor the BCC, suggesting that a priming effect did not occur under these experimental conditions.
Keywords: dissolved organic matter, biodegradation, coastal waters, bacterial community
composition, priming effect.
Introduction
Marine dissolved organic matter (DOM) is the largest reservoir of reduced carbon in the oceans estimated at 662 Gt C (1 Gt = 1x10¹⁵ g) (Hansell et al. 2009) which is equivalent to that present as atmospheric CO2 or in the terrestrial biota (Druffel et al. 1992, Hedges and
Benner 1997). The bulk DOM pool in the oceans is composed of multiple compounds that exhibit a spectrum of reactivities and turnover times, from labile to ultra refractory molecules (Carlson and Hansell 2015). The adjective recalcitrant is employed to characterize DOM that accumulates in the environment and is resistant to removal, without specifying its reactivity. Recalcitrant DOM is taken as the opposite of labile DOM, the latter being removed on timescales of heterotrophic microbial growth rates such that it does not accumulate in the environment (Hansell 2013). Primary production at the surface of the oceans contributes ~48.5 Gt C yr-1 (Field et al. 1998). This fresh organic matter is rapidly cycled through the food web in the upper ocean and up to 50% of the primary production is processed by heterotrophic bacteria (Cole et al. 1988). On the other hand, the riverine DOM reaching the
oceans (~0.2 Gt C yr-1, Raymond and Spencer 2015) is a complex and heterogeneous mix of
compounds of diverse origin (terrestrial and aquatic), chemical properties and reactivity. Much of the organic matter discharged by larger rivers appears to be soil-derived, composed of highly degraded, nitrogen-poor compounds (Hedges and Benner 1997) and characterized by a high concentration of humic substances, comprising 50-80% of total DOM in freshwater (Aiken et al. 1985).
The knowledge of the mechanisms controlling the global pool of recalcitrant DOM in the oceans is a crucial question because changes in this pool could cause major perturbations of atmospheric CO2 and the radiation balance of Earth (Dittmar 2015). For instance, the fate of
riverine organic matter in the ocean is still unclear (Hedges and Benner 1997) due to conflicting studies. Whereas biodegradation experiments showed riverine DOM to be
minimally bioreactive (Søndergaard and Middelboe 1995), field studies showed the contribution of riverine organic matter to global burial flux to be low (i.e. 50% of riverine organic matter introduced to the ocean must be completely remineralized ; Hedges and Benner 1997). These contrasting results can be explained by strong seasonal and regional differences in biodegradability of riverine DOM, photo-degradation processes and flocculation with increased salinity (Hedges and Benner 1997).
The concept of DOM recalcitrance in aquatic ecosystems has been recently challenged (Dittmar 2015). Kellerman et al. (2015) showed that intrinsic properties of DOM influence its persistence, largely constraining the effects of extrinsic controls such as environmental conditions on DOM processing. Additionally, Arrieta et al. (2015) present experimental evidence showing that low concentrations rather than recalcitrance preclude consumption of a substantial fraction of DOM in the deep ocean. It was also proposed that a priming effect (PE) may participate to the sink of recalcitrant DOM in aquatic ecosystems (Guenet et al. 2010). The PE is a process where addition of labile organic matter modifies (generally increases) the microbial degradation of recalcitrant DOM (Blagodatskaya and Kuzyakov 2008). Whereas the PE has been repeatedly observed in soil ecosystems reports in aquatic ecosystems occurred later (see Table 1). The mechanisms involved in the PE are not well understood but may be driven by multiple factors such as chemical structure and availability of organic carbon, nutrient availability, stoichiometry and microbial composition (Fontaine and Barot 2005, Guenet et al. 2010, Kuzyakov 2010). The river plume has been hypothesized to be a favorable location for a priming effect (PE) because riverine recalcitrant organic matter can encounter labile organic matter released during a phytoplanktonic bloom (Bianchi 2011). If confirmed in marine environments, the PE could help explain the “missing” terrestrial DOC in the oceans (Bianchi 2011).
Linking the changes in bacterial diversity and composition (BCC) to the bacterial community functioning in response to changes in environmental conditions, including the DOM composition, is of fundamental importance in microbial ecology. This question has been recently explored by considering the combined addition of DOM with variable bioreactivity in different aquatic ecosystems (Jones et al. 2009, Fonte et al. 2013, Attermeyer et al. 2014, 2015, Wagner et al. 2015). These studies reported that the mixture of different DOM sources generally i) increased the efficiency of carbon use by bacteria, supporting the PE hypothesis, and ii) led to a shift in BCC compared to the addition of single sources, knowing that organic matter uptake and degradation is taxa-specific even if some generalist species exist (Carlson and Hansell 2015). To our knowledge, the effects of a combination between riverine DOM
and labile DOM produced during a phytoplanktonic bloom on PE and BCC have never been studied in the context of coastal environment.
In this study, we explored the response of a coastal marine bacterial community to the additions of 1) recalcitrant DOM (riverine DOM, R treatment), 2) labile DOM (amino acids, L treatment) and 3) a complex mixture of recalcitrant and labile DOM (riverine DOM and amino acids, LR treatment). During a 42-day incubation, we analyzed the degradation of DOM in parallel to the changes in bacterial community activity (BCA, by measuring bacterial production and respiration) and in bacterial community composition (BCC, by 16S rRNA pyrosequencing). We hypothesize that the presence of labile DOM (i.e. amino acids) modifies the degradation of riverine and coastal DOM by stimulating a part of the bacterial community and we expect an increase in bacterial diversity when DOM sources are combined due to increased diversity in organic molecules to degrade. This experimental study was conducted in the Gulf of Lion, one the most productive areas of the Mediterranean Sea, which is influenced by large inputs from the Rhône River (Durrieu de Madron et al. 2011). The annual total organic carbon (TOC, particulate and dissolved organic matter) input from the Rhône
River is 1.7×10¹⁰ moles C and represents ~1% of the standing stock of TOC in the Gulf of
Lion (Panagiotopoulos et al. 2012), which is much higher than the average reported for the World Ocean (Smith and Hollibaugh 1993), and highlights the main role played by the Rhône River in the Mediterranean carbon cycle (Sempéré et al. 2000).
Table 1. Results of priming effect (PE) experiments in aquatic ecosystems. RDOM
recalcitrant dissolved organic matter, LDOM labile dissolved organisc matter, MCP Microbial carbon pump, BP Bacterial production, BR Bacterial respiration, BGE Bacterial growth efficiency.
Aquatic ecosystem
Incubation
time RDOM LDOM
Nutrients addition Parameter used for PE determinati on PE (±) Reference Arthrobact er strain (shallow lake)
10 days Fulvic acids Benzoate No
Fulvic acids, bacterial growth + de Haan (1977) Mesotrophi c lake 8–12 h Monosubstituted
phenols Amino acids No
Compound respiration + Shimp and Pfaender (1985) Oligotrophi c Sargasso Sea
1–2 months Natural RDOM Glucose Yes DOC + (sugge
sted)
Carlson et al. (2002) Coastal
lagoon 5 days Natural RDOM
Macrophyte
leachate Yes BR, BGE +
Farjalla et al. (2009)
Aquatic ecosystem
Incubation
time RDOM LDOM
Nutrients addition Parameter used for PE determinati on PE (±) Reference Headwater
stream 42 days Leaf litter Diatoms Yes
Leaf litter mass + Danger et al. (2013) Coastal lagoon Marine sediment 5 days 21 days Humic substances Natural RDOM Algal extract 13C algal DOC Yes No DOC, BGE CO2, 13C CO2 + − Fonte et al. (2013) Gontikaki et al. (2013) Freshwater
marsh 35 days Plant litter
Periphytic algal exudates No Bacterial and fungal growth + (suggeste d) Kuehn (2014) Eutrophic lake 12 days
13C leaf leachate Phytoplankton DOM and
exudates
Yes DOC, BGE +
Attermeyer et al. (2014) Hyporheic microbial community (biofilm)
21 days 13C willow DOM Glucose/algal
extract Yes 13C DOC, BR No Bengtsson et al. (2014) Lake water 40 days Soil organic matter 13C glucose Yes 13C DOC,
CO2 + Guenet et al. (2014) Rivers (Midwester n and western USA) 3–5 days Natural riverine RDOM/soils/humat e extract Glucose/algal
leachate Yes DOC
+ (Bayesian model) Hotchkiss et al. (2014) Coastal water (Antarctic Sea) 734 days Refractory compounds generated by MCP
13C glucose Yes 13C DOC No Koch et al.
(2014) Coastal
lagoon (Med. Sea)
22 days Natural RDOM Jellyfish
DOM No DOC No Blanchet et al. (2014) Oligo-meso and eutrophic lakes
5 weeks Natural RDOM Glucose/acetate/cellobiose Yes DOC No Catalan et al. (2015)
Culture medium
Acinetobac ter strain
12.5 days Litter leachate
13C trehalose, 13C algal DOC Yes
13C CO 2, DOC + Bianchi et al. (2015) Coastal water (Med. Sea)
42 days Riverine DOM Amino acids Yes DOC, BR,
Material and methods
Preparation of the dissolved organic matter sources
Water was collected at the Observatory station of the Rhône River in Arles (SORA), which is located near the Compagnie Nationale du Rhône (CNR; http://www.cnr.tm.fr/fr/) gauging station. Samples (~ 40-50 L) were collected on 2nd May 2013 using automatic samplers installed at the station (Panagiotopoulos et al. 2012) and 10-20 L Nalgene carboys that were previously cleaned with detergent and soaked in 2% of HCl for one week. The sampling date corresponded to a high flood event in the Rhône River (4,150 m3 s-1). Water was centrifuged
on site, transferred to the lab, and further filtered through 5 µm filters (similar molecular sieves used for phytoplankton filtering). River samples were left to stand for 7-10 days at ambient temperature to allow labile organic matter to be degraded and filtered again on on a Polycap filter (0.2 µm) using a peristaltic pump, which was previously cleaned with copious amounts of Milli-Q water. The collected dissolved phase was then frozen and freeze-dried. For this experiment, approximately 19.2 L of Rhône water were lyophilized resulting in a powder with a mass of 4.42 g. Then, ~996 mg of the lyophilized dissolved organic matter (DOM) was re-dissolved in 1050 mL of Milli-Q water which was acidified with a few drops of HCl solution to dissolve DOM and the associated salts. The resuspended DOM was then distributed in different microcosms (see below). This addition decreased by 0.4 unit the pH in the seawater microcosms at the start of the experiment.
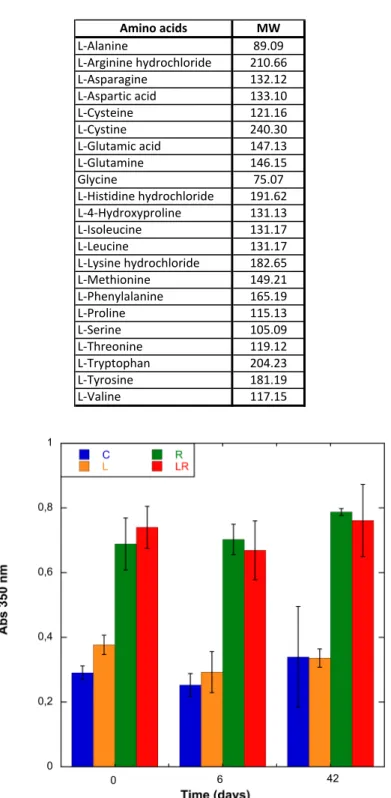
A solution of twenty-one L-amino acids (Sigma, 09416-1EA) was prepared in Milli-Q water (see list of amino acids in Table S1). Each amino acid was added at the same molar concentration in the solution.
Experimental setup
Surface water was collected in July 2013 from a coastal station in the NW Mediterranean Sea (SOLA station, in the Bay of Banyuls-sur-Mer, France, [42°29′N, 3°08′E], 250 km away from the Rhone River mouth. The influence of the Rhone River on this coastal station is not impossible, but the high salinity measured at the surface during the sampling period (37.05‰) indicated no dilution by fresh water. The sample was filtered by gravity on a 25-µm mesh (Nytex) to remove large zooplankton and phytoplankton although phytoplankton biomass measured at this period was low (i.e., 0.165 µg Chl a L-1 measured two days before the sampling). Twelve pre-combusted (450°C, 6 h) 4 L Erlenmeyer flasks (hereafter refereed as microcosms) were filled with filtered seawater and supplied with a single or combined DOM
source. Three microcosms received 150-mL of the above-mentioned resuspended DOM originating from the Rhône River (R treatment), corresponding to the addition of 15 µmol L-1
dissolved organic carbon (DOC). Three microcosms were inoculated with 100 µL of amino acids solution (L treatment), corresponding to the addition of 9 µmol L-1 DOC. Three microcosms received the combined addition of DOM originated from Rhône River and the amino acids solution (LR treatment). The last three microcosms did not receive any addition and were kept as controls (C treatment, DOC ~65 µmol L-1). To avoid nitrogen or phosphorus limitation, NH4+ and PO43- were added to all the microcosms at 16 µmol L-1 and 1 µmol L-1
final concentrations, respectively. The microcosms were closed with a cellulose stopper which permitted passive aeration and were incubated in the dark at 18°C under magnetic agitation. The microcosms were periodically sampled during 42 days for chemical and microbial analyses with a focus on short term (after 6 days) and mid-term (after 42 days) changes.
Chemical analysis
Samples (20 mL in duplicate) for nitrate (NO3-), nitrite (NO2-) and phosphate (PO43-) were
stored at -20°C and analyzed within 1 month of collection by colorimetry using a nutrient autoanalyzer (SEAL Analytical AA3HR) (Aminot and Kérouel 2007). Samples (40 mL in duplicate) for ammonium (NH4+) were analyzed immediately according to Holmes (1999)
with a fluorometer (Jasco FP-2020). Samples (16 mL) for DOC were filtered through 2 precombusted (450°C, 6 h) 25-mm GF/F filters (~0.7 µm), and transferred into precombusted glass tubes, poisoned with 85% H3PO4 (final pH=2). Tubes were closed with Teflon lined
screw caps and stored in the dark at room temperature until analysis (less than 2 months after sampling). DOC was analyzed using the high temperature catalytic oxidation (HTCO) technique (Cauwet 1994) with a Shimadzu TOC-V analyzer. Before starting analyses and between sets of samples, deep seawater reference samples (provided by D. Hansell; Univ. Miami) were run daily (43.5 µM C, CV = 2–3%, n = 4) to check the accuracy of the DOC analysis and its stability over time.
Samples for dissolved organic nitrogen (DON) and phosphorus (DOP) were filtered through 2 pre-combusted 25-mm GF/F filters (Whatman). Samples were collected directly in Teflon bottles and immediately frozen (-20°C) and stored for later analyses. DON and DOP were simultaneously determined by the wet oxidation procedure (Pujo-Pay and Raimbault 1994).
DON (±0.1 µmol L-1) and DOP (±0.02 µmol L-1) concentrations were determined by sample
respectively.
All chemical parameters were measured at T0, T6 and T42 days.
CDOM absorbance and excitation-emission matrices
Samples for determining the absorbance and fluorescence of chromophoric dissolved organic matter (CDOM) were filtered through 2 precombusted 25-mm GF/F filters (Whatman) in 100 mL precombusted glass bottles and stored at -20°C until analysis. CDOM absorption was determined with a Varian Cary spectrophotometer using a 10-cm quartz cuvette. Spectral scans were acquired between 250 and 700 nm. Absorbance was measured against Milli-Q water as the blank. Absorption coefficients a350 (m-1) were calculated as a350=2.303 D/L,
where D is the absorbance at 350-nm wavelength after subtraction of the average absorbance between 600 and 750 nm and L is the pathlength of the absorbance cell in meters. Excitation-emission matrices (EEM) were obtained using a Perkin Elmer LS55 luminescence spectrometer equipped with a xenon discharge lamp equivalent to 20 kW for a 8-µs duration. The running instructions for the machine were set as follows: scan speed at 250 nm min-1 and
slit widths for the excitation and emission wavelengths at 10 nm. Measurements were performed at a constant room temperature of 20 ºC in a 1 cm quartz fluorescence cell. The Ex/Em wavelengths used for single measurements were those established by Coble (1996), thus: Ex/Em 280 nm/350 nm (peak-T) as an indicator of protein-like substances, Ex/Em 320 nm/410 nm (peak-M) as an indicator of marine humic-like substances, Ex/Em 340 nm/440 nm (peak-C) as an indicator of terrestrial humic-like substances and Ex/Em 250 nm/435 nm (peak-A) as an indicator of a group of humic substances with different origins. Milli-Q water was used as a reference blank for fluorescence analyses. The correction for the Raman scatter was implemented by subtracting from each sample the Milli-Q blank spectra. Accordingly, fluorescence measurements were expressed in Raman Units (R.U.) by normalization to the integral water Raman scattering band of ultrapure Milli-Q water freshly generated, according to Lawaetz and Stedmon (2009). Manufacturer supplied correction factors were applied for both, lamp excitation and emission biases. The correction procedures for both, primary and secondary inner filter effects (IFE) described in Murphy et al. (2010, 2013) and Kothawala et al. (2012, 2013) studies were not applied for this case as all absorbance values measured for the different experimental times and conditions were always lower than 0.04 cm-1. CDOM was analysed at T0, T6 and T42 days.
Bacterial abundance and activities
Hereafter, the term bacteria will be used for heterotrophic prokaryotes (including Bacteria and Archaea). Bacterial abundance was determined by flow cytometry. Samples (3 mL) were preserved in cryovials with 0.2-µm-filtered formalin (2% final concentration). The samples were gently mixed and left in the dark at room temperature for 10 min before quick-freezing in liquid nitrogen and storage at -80°C. The samples were later thawed at room temperature, stained with SYBR Green I (final concentration 0.025% (v/v) of the commercial solution; Molecular Probes Inc., OR) for at least 15 min at 20°C in the dark and analysed on a flow cytometer (FACScan, Becton Dickinson, San Jose, CA) equipped with a 488 nm, 15 mW argon laser. Bacteria were detected on a plot of green fluorescence (515-545 nm) versus right angle light scatter (SSC), using the green fluorescence as threshold parameter. Fluorescent beads (1.0 µm; Polysciences Inc., Warrington, PA) were added to each sample as standards.
Bacterial production (BP) was measured by 3H-thymidine incorporation applying the
centrifugation method (Smith and Azam 1992). Samples (1 mL in triplicate) were incubated in the dark at 18°C for 1 h with 20 nmol L-1 [3H]-thymidine (specific activity 83.2 Ci mmole
-1, Perkin Elmer) in 2-mL microtubes. Incorporations were terminated by the addition of
trichloroacetic acid (TCA) to a final concentration of 5%. One killed control was prepared for each assay by the addition of TCA, 15 min before the addition of 3H-thymidine. Samples were stored for at least 1 h at 4°C and then centrifuged for 15 min at 12,000 g. The precipitate was rinsed twice with 5% TCA. The precipitates were resuspended in 1.0 mL of liquid scintillation cocktail (FilterCount, Perkin Elmer) and radioactivity determined by a liquid scintillation counter (LS 5000CE Beckman). Thymidine incorporation rates were converted into carbon production using the conversion factors of 2.108 cells produced per mole of thymidine incorporated and 20 fg C per cell (Ducklow and Carlson 1992).
Bacterial respiration (BR) was measured at each time point using an oxygen microelectrode (Briand et al. 2004). The microprobes (Unisense, Denmark) are designed with an exterior guard cathode, which results in extremely low oxygen consumption by the electrodes (4.7–47 × 10−7 µmol O2 h−1). Probes have a response time shorter than 1 s and a precision of 0.05%.
Bacterial respiration was measured in the dark over 4 h to 24 h in duplicate samples for each microcosm, placed in microchambers (2 mL) and immersed in a water bath with controlled temperature (18°C). A specific measurement of the dissolved O2 concentration was carried
out a minimum of 4 times during incubation in microchambers. BR was estimated from the
linear regression established on these points of measurement. BR were expressed in mgC m-3
(BGE, %) was calculated from the following equation BGE= BP/(BP+BR). We assume here that respiration measured came only from heterotrophic bacteria. However, because the water was not filtered before measurements to remove other heterotrophic organisms, BR could be overestimated and BGE underestimated. Bacterial abundances, production and respiration were measured at T0, T1, T2, T3, T6, T9, T15, T22, T29 and T42 days.
Bacterial diversity by pyrosequencing
DNA extraction was performed by using the AllPrep mini kit (Qiagen) on 0.2 µm filters after filtration of 500 mL of pre-filtered (3 µm) seawater, as previously described (Ghiglione et al. 2009). The V1-V3 hypervariable regions of bacterial 16S rRNA genes were amplified using primers 27F-519R, as recommended by Dowd et al. (2008). Tag-encoded FLX amplicons were sequenced using the Roche 454 FLX with Titanium reagents, and procedures were performed following manufacturer’s guidelines (www.mrdnalab.com, Shallowater, TX, US). Sequences were analyzed using the Mothur software version 1.33 (Schloss et al. 2009) with default settings excluding sequences <200 bp. Sequences were denoised using the Mothur implementation of PyroNoise (Schloss et al. 2011) and chimeras were removed using Chimera Slayer (Haas et al. 2011). The resulting clean sequences were clustered into operational taxonomic units (OTUs) at a 97% sequence identity level using the UCLUST algorithm (Edgar 2010) and a representative sequence from each OTU was classified using the Ribosomal Database Project (RDP) classifier (Wang et al. 2007) using the SILVA 119 training set. To enable beta-diversity comparisons between samples, samples were rarefied to the same sequencing depth as the sample with the fewest sequences (5,774 sequences per sample) (Ghiglione and Murray 2012). All further analyses were performed on the randomly re-sampled OTU tables. Bacterial diversity were analysed at T0, T6 and T42 days.
Statistical analyses and estimation of the microbial diversity
Statistical analyses of treatment effects on chemical and biological parameters were performed using a one-way analysis of variance (ANOVA) and post-hoc Tukey tests with repeated measures (i.e. microcosms). Statistical analyses were performed using XLSTAT 2014.2 software (Addinsoft) and employed an alpha level of 0.05.
To study how treatments affected bacterial community composition over time, a non-metric multidimensional scaling (nMDS) plot was produced, based on Bray-Curtis similarities between OTU relative abundance. At T6, samples were categorized in relation to the addition
of riverine DOM: samples that received riverine DOM addition (R and LR, n=4); samples that did not receive riverine DOM addition (C and L, n=4) were respectively grouped together. Differences between these categories were tested by analysis of similarity (ANOSIM). Similarity percentage analysis (SIMPER, Clarke and Gorley 2006) was performed to identify which individual OTUs contributed most to the dissimilarity between grouped samples over-time. The Chao (richness) and inverse Shannon (diversity) indices were calculated using the Mothur software.
Results
Changes in chemical parameters
The initial concentration of DOC in the control microcosms was 64.8 ± 5.5 µmol L-1 (C treatment) (Fig. 1a). Microcosms were enriched with different sources of DOM, providing respectively 9.5 ± 3.0 µmol L-1 DOC in the microcosms enriched in amino acids (L
treatment), 15.5 ± 4 µmol L-1 DOC in those enriched with riverine DOM (R treatment) and
26.7 ± 7 µmol L-1 DOC in the microcosms that received the combination of both amino acids
and riverine DOM (LR treatment). After 6 days, DOC concentrations in L, R and LR conditions showed a significant decrease (ANOVA, p<0.05) by 15.6 µmol L-1, 5.5 µmol L-1 and 15.2 µmol L-1, respectively, whereas DOC in control treatment remained constant (ANOVA, p>0.05). At the end of the experiment, the DOC had decreased by 6.8, 17.8, 12.9 and 10.7 µmol L-1 in C, L, R and LR treatments, respectively. The concentration of DOC between C and L treatments and between R and LR treatments did not differ significantly at T6 and T42 (p>0.05), suggesting that addition of amino acids did not enhance the DOM degradation from the coastal water and the river.
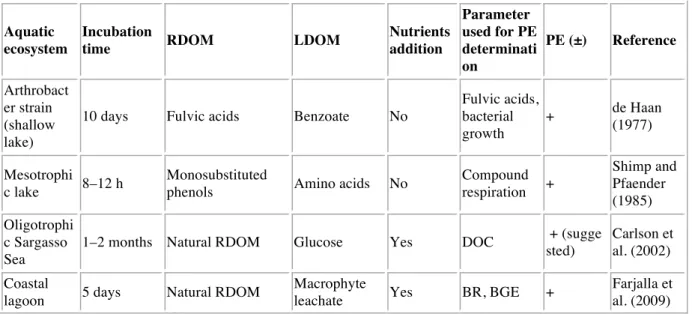
Fig. 1. Changes in dissolved organic carbon (DOC; a), nitrogen (DON; b) and phosphorus
(DOP; c) concentrations. Mean values ± SD of replicate microcosms are shown for each time point. C: control, L: addition of amino acids, R: addition of riverine DOM, L+R: addition of amino acids and riverine DOM.
Addition of amino acids and riverine DOM led to an enrichment of DON in L and R conditions by 1.4 µmol L-1 and 5.3 µmol L-1, respectively, compared to the C condition where DON was undetectable (Fig. 1b). As expected, the LR condition showed a slightly higher but
not significantly different DON concentration (6.3 µmol L-1) compared to the R condition. After 6 days, an important increase of DON concentration was observed in all conditions,
with similar concentrations between C and L treatments (17 µmol L-1) and between R and LR
conditions (24 µmol L-1). After 42 days, the DON concentrations measured in the different treatments were close to those measured at the start of the experiment. The high concentration of NH4+ measured at T0 for all conditions (i.e., 23 µmol L-1) came from the enrichment
performed (16 µmol L-1) and the natural concentration present in the coastal water (7 µmol L
-1) (Fig. 2c). NH
4+ was actively consumed at the same rate in all conditions and reached 5
µmol L-1 at T6, and less than 0.1 µmol L-1 at T42. The addition of riverine DOM led to an
important increase in NO3- (10 µmol L-1) in treatments R and LR, whereas NO3- concentration
was undetectable in conditions C and L (Fig. 2a). NO3- concentrations remained high in
conditions R and LR throughout the experiment and a small increase was detectable in conditions C and L (3 µmol L-1) at the end of the experiment. NO2- remained undetectable at
T0 and T6 for all conditions, before reaching a high and similar concentration by the end of the experiment in all conditions (17 µmol L-1) (Fig. 2b). In conclusion, the different forms of
nitrogen were highly dynamic during the experiment, shifting from a dominance of NH4+ at
Fig. 2. Changes in nitrate (a), nitrite (b), ammonium (c) and phosphate (d) during the
incubation experiment. Mean values ± SD of replicates microcosms are shown for each time point. See Fig. 1 legend for the abbreviations C, L, R, LR.
The DOP concentrations remained low over the experiment in the different treatments with no significant difference between the treatments except in the L treatment after 6 days (ANOVA, p<0.05), with a higher concentration of DOP compared to the other treatments (Fig. 1c). The concentration of PO4 was similar for all conditions at T0 (1.3 µmol L-1) and this was mainly
due to the enrichment (i.e., 1 µmol L-1) (Fig. 2d). PO4 concentrations decreased slightly in all
conditions by the end of experiment with the exception of LR.
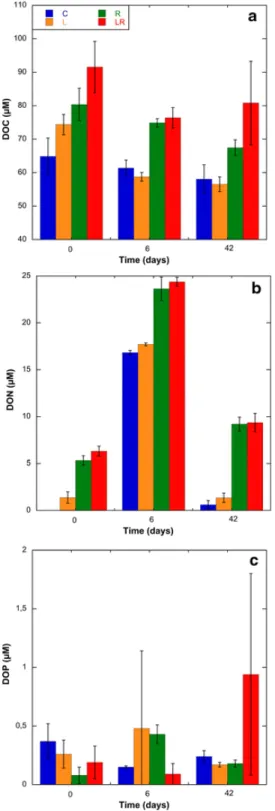
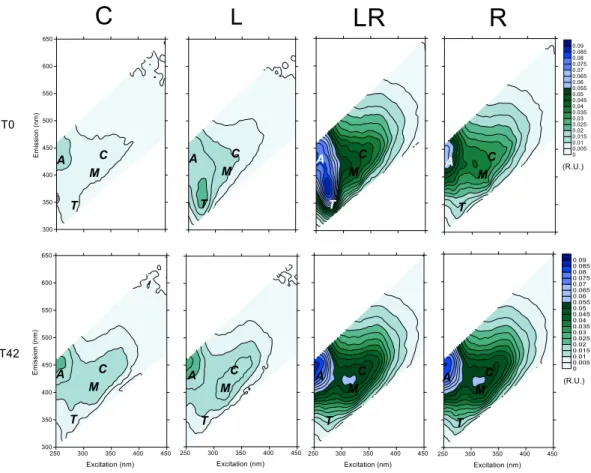
CDOM was followed by its optical properties of absorbance and fluorescence. The addition of riverine DOM led to an increase of absorbance at 350 nm in treatments R and LR (0.69-0.74 m-1) compared to the treatments C and L (0.29-0.38 m-1) (Fig. S1). The values did not change significantly during the experiment (ANOVA, p>0.05) (Fig. S1). Excitation-emission matrices were used to identify major fluorophore groups (Fig. S2). The addition of riverine DOM increased the humic peaks A, C and M by a factor 4 to 5 compared to the control and L treatments (Fig. 3 a,b,c). The fluorescence intensities of humic peaks remained almost constant during the experiment underlying the refractory property of these compounds. The addition of amino acids (L treatment) and riverine DOM (R treatment) contributed to the increase in the T peak (protein-like substances) by a factor 3.4 and 1.7, respectively, compared to the C treatment (Fig. 3d). After 6 days, the T peak decreased in L and LR treatments to reach respectively the values measured in the control and the R treatments. Subsequently, no additional changes were observed until 42 days.
Fig. 3. Changes in normalized fluorescence peaks A (UVC like, a), C (UVA
humic-like, b), M (UVA marine humic-humic-like, c) and T (protein-humic-like, d) during the incubation experiment. Mean values ± SD of replicate microcosms are shown for each time point. See Fig. 1 legend for the abbreviations C, L, R, LR.
Changes in bacterial abundance and metabolism
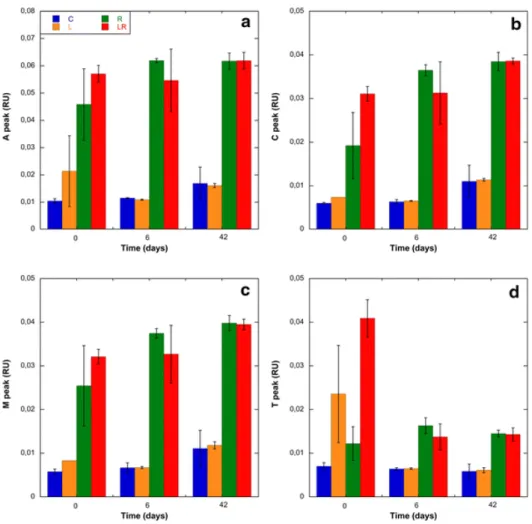
Bacterial abundance (BA) increased during the first three days in all treatments by a factor of 1.7 (Fig. 4). At T2, BA was slightly but significantly higher in L and LR treatments compared to the control and R treatments (ANOVA, p<0.05). BA decreased sharply in all treatments between T3 and T6 and was following by an increase at T9 in the microcosms enriched in amino acids. Then, it remained almost constant until the end of experiment and no significant differences were observed between treatments (ANOVA, p>0.05).
Fig. 4. Changes in bacterial abundance during the incubation. Mean values ± SD of replicate
microcosms are shown for each time point. See Fig. 1 legend for the abbreviations C, L, R, LR.
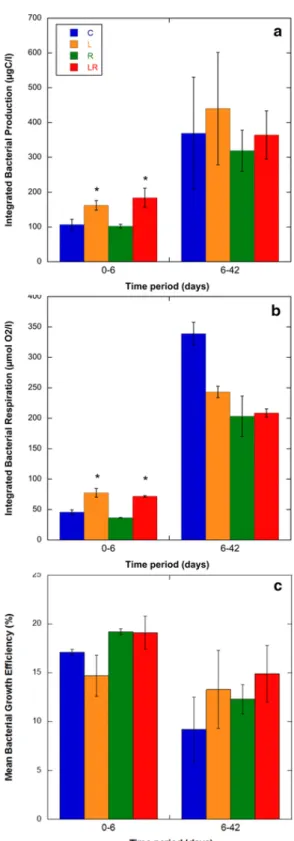
Discrete measurements of bacterial production (BP) and bacterial respiration (BR) (Fig. S3) were used to calculate the integrated values of both activities during two periods: 0-6 days (5 measurements) and 6-42 days (6 measurements) (Fig. 5a,b). During the first period, integrated BP and BR were similar between C and R treatments (ANOVA, p>0.05). In contrast, we measured similar and significantly higher integrated BP and BR in L and LR conditions (ANOVA, p<0.05). For those treatments, the values increased by a factor of 1.5 to 1.7 compared to the values measured in the control treatment. During the second period, no significant differences were measured between the treatments for both integrated BP and BR (ANOVA, p>0.05). The mean BGE was also calculated for the two periods considered (Fig. 5c). The values did not differ between treatments for both periods and ranged from 14.7% to 19.2% for the first period and from 9.2% to 14.9% for the second period. When the different treatments were combined, the mean BGE values measured during the first period appeared slightly higher than those measured during the second period (17.5% and 12.4%, respectively).
Fig. 5. Changes in integrated bacterial production (a), integrated respiration (b) and bacterial
growth efficiency (c) during two periods of the experiment. Mean values ± SD of replicate microcosms are shown for each time point. See Fig. 1 legend for the abbreviations C, L, R, LR. * indicates significant differences with the control treatment (C) (p<0.05).
Changes in bacterial community composition and diversity
Bacterial community composition (BCC) was analyzed in duplicate microcosms for each treatment after 6 days of incubation (T6) and at the end of the experiment (T42). After trimming and quality checking, a total of 17,3163 partial 16S rRNA gene sequences were obtained, with an average of 10,822 (5,774-15,418) sequences per sample. The sequences were clustered into a total of 2,105 OTUs at >97% similarity (singletons included).
nMDS plot based on Bray-Curtis similarities between samples, revealed a pattern in which bacterial communities were driven by the sampling time and according to the treatments (Fig. 6). Three main clusters that were defined by >40% Bray-Curtis similarity between samples were identified (solid lines, Fig. 6). The first cluster grouped the samples at T0 and T6. Within this cluster, treatments C and L were clearly separated from treatments R and LR (dotted lines, Fig. 6). After 42 days of incubation, treatments L, R and LR grouped together (solid lines, Fig. 6) and were dissimilar at 60% compared to the controls.
Fig. 6. Non-metric multidimensional scaling (nMDS) plot based on Bray-Curtis similarities
between 16S rRNA gene OTU relative abundance obtained for the different treatments at T0, 6 and 42 days. Bray-Curtis threshold of 40 and 60% similarity are indicated by solid and dotted circles, respectively. See Fig. 1 legend for the abbreviations C, L, R, LR.
To study if the difference observed at T6 between the treatments R/LR and C/L was significant, the samples with added riverine DOM (R and LR, n=4) and other treatments (C and L, n=4) were respectively grouped together. ANOSIM test indicated a significant difference between those two categories (R=1; p<0.05).
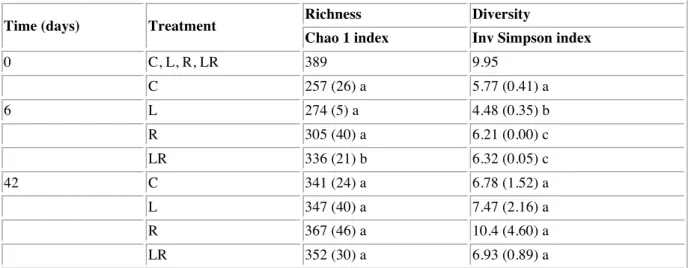
The taxonomic richness estimated by the Chao1 index was high at the beginning of the experiment (389), and decreased for all conditions at T6 (range: 257-336) before increasing at the end of the incubation (range: 341-367) (Table 2). At T6, the richness was significantly higher in the LR treatment compared to the other conditions (ANOVA, p<0.05). At T42, the different treatments did not show any significant differences in richness (ANOVA, p>0.05). The diversity, based on the inverse Simpson index, that includes both richness and evenness, decreased between T0 and T6 for all treatments. At T6, the L treatment showed a lower diversity compared to the control, while R and LR treatments showed a higher diversity (ANOVA, p<0.05). At T42, no differences in diversity were observed between the treatments (ANOVA, p>0.05).
Tab. 2 Richness and diversity indices of bacterial communities estimated from randomly
picked OTUs normalized to 5,774 sequences.
Time (days) Treatment Richness Diversity
Chao 1 index Inv Simpson index
0 C, L, R, LR 389 9.95 C 257 (26) a 5.77 (0.41) a 6 L 274 (5) a 4.48 (0.35) b R 305 (40) a 6.21 (0.00) c LR 336 (21) b 6.32 (0.05) c 42 C 341 (24) a 6.78 (1.52) a L 347 (40) a 7.47 (2.16) a R 367 (46) a 10.4 (4.60) a LR 352 (30) a 6.93 (0.89) a
Standard deviation between the replicates is shown in brackets. Different letters (a, b, c) denote that the
treatment was significantly different (p < 0.05) and the same letter denote that the treatment was not significantly different (p > 0.05) at a specific time of the experiment
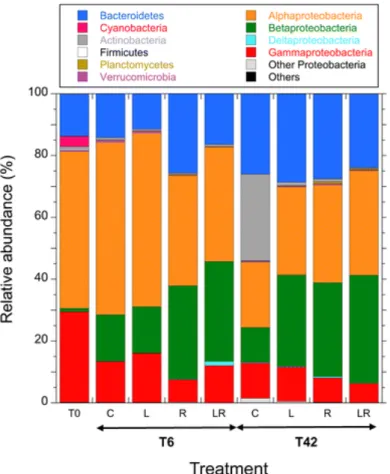
The BCC was further investigated by comparing the relative abundance of the major phyla and proteobacterial subclasses (Fig. 7). At T0 the bacterial community was dominated by
Alphaproteobacteria (51%) with a high proportion of clade SAR11 (30%), followed by Gammaproteobacteria (29%) and Bacteroidetes (14%). As indicated by the clustering of
samples (Fig. 6), the major differences observed at T6 were found between clusters of (C – L) treatments and (R – LR) treatments. For the latter group, there were more Betaproteobacteria (30%) and fewer Alphaproteobacteria (35%) than in the C and the L treatments (15% and 52%, respectively). At T42 the main differences were observed between the enriched microcosms and the control microcosms. A high proportion of Actinobacteria (28%) was detected in the control microcosms while this phylum accounted for less than 2% of total sequences in the enriched microcosms. Conversely, a higher Betaproteobacteria abundance was observed in the enriched microcosms (L, R, LR) (30%) compared to the control (10%). We also observed a substantially higher proportion of Alphaproteobacteria in the enriched microcosms (31%) compared to the control (21%).
Fig. 7. Relative abundance of major bacteria phyla and Proteobacteria subclasses expressed as
the duplicate microcosms for each treatment and sampling time. See Fig. 1 legend for the abbreviations C, L, R, LR.
To explore the response of the bacterial community to the different treatments at T6, we first represented the 720 OTUs identified at this sampling time on a Venn diagram (Fig. S4). The four treatments, including the control, shared 12.9% of these OTUs. Only 1.9% was shared by the three treatments with a DOM enrichment (i.e. L, R and LR). When the treatments were compared two-by-two, the treatments C and L shared the lowest number of OTUs (16.9%) while the treatments R and LR shared the highest number of OTUs (23.0%).
The OTUs that responded to riverine DOM addition and contributed most to the dissimilarities between the two conditions were identified using the similarity percentage analysis (SIMPER). The 33 OTUs explaining more than 80% of dissimilarity between the two conditions and their taxonomic affiliation are represented in Table 3. The dissimilarity induced by the addition of riverine DOM was of 40.6% and the changes in BCC were explained mainly by two OTUs. The OTU SAR11 was less abundant in the treatments with riverine DOM (R, LR = 21.7%) compared to the treatments without addition (C, L = 40.7%), whereas OTU OM43 belonging to Methylophilaceae, was more abundant after riverine DOM addition (R, LR = 31.0%) than without (C, L = 14.8%).
Tab. 3 SIMPER analysis showing the contribution and taxonomic affiliation of OTUs
explaining 50% of the dissimilarity between treatments after 6 days of incubation (T6). The average abundance of OTUs is expressed as the percentage of total sequences obtained for each treatment. The percentages of dissimilarity between two conditions are indicated at the bottom of the table.
Discussion
The first objective of this study was to assess the effects of different qualities of DOM on bacterial community activity (BCA) and bacterial community composition (BCC) using single or combined additions. The second objective was to explore the possibility of a priming effect on the degradation of riverine DOM in the presence of bioavailable compounds (i.e., free amino acids) that may be produced by phytoplankton.
Uncoupling of bacterial community activity and composition changes after DOM additions
Numerous examples of coupling between community structure and heterotrophic activity, together with the related importance of nutrient availability have been reported in aquatic ecosystems (Cottrel and Kirchman 2000). Here, we observed an unusual response of the bacterial community with a decoupling between the changes observed in BCA and BCC according to the composition of DOM. While the addition of labile DOM resulted in changes in BCA but not in BCC, the addition of riverine DOM resulted in changes in BCC but not in
BCA. The combination of both DOM resulted in changes in BCA identical to those observed with the labile DOM alone and in BCC closely identical to those observed with the riverine DOM alone.
The lability of the free amino acids was confirmed by the rapid decrease in DOC concentration after 6 days, the disappearance of the T peak in FDOM and the stimulation of the BCA (L treatment). The higher recalcitrance of riverine DOM was confirmed by the slow decrease in DOC concentration over the experiment, the maintenance of the humic peaks in FDOM and the absence of BCA stimulation (R treatment). Surprisingly, the bacterial growth efficiency (BGE) remained similar between the different conditions tested when higher BGE was expected after addition of labile DOM compared to allochthonous DOM (del Giorgio and Cole, 1998). The lowering of BGE in all treatments in the second period of the experiment can be explained by the decrease of the bioavailability of DOM along the experiment. The combination of both DOM sources (LR condition) did not lead to higher BCA or BGE compared to single DOM addition. In contrast to our results, Fonte et al. (2013) and Attermeyer et al. (2014) observed a synergistic effect of mixed DOM sources after 4-12 days of incubation on BGE in freshwater and coastal lagoon, respectively.
One important point of our experimental design is the addition of DOM to an undiluted natural bacterial community. Riverine DOM was added after aging to ensure that most of the labile DOM was consumed. Riverine DOM was also lyophilized to reduce the change in salinity in microcosms that would be responsible for modifications in bacterial community activity (BCA) and/or bacterial community composition (BCC) (Sjöstedt et al. 2012). A recent study showed that lyophilization had small effects on DOM composition as determined by Fourier-transform ion cyclotron resonance mass spectrometry (FT-ICR-MS) but these modifications had no effects on the BCA nor the BCC during the biodegradation compared to the addition of concentrated riverine DOM by tangential-flow ultrafiltration (Herlemann et al. 2014). Most biodegradation experiments are based on regrowth experiments where the bacterial assemblage is diluted (e.g., 1:10) in 0.2-µm-filtered natural water. Generally, the dilution of the bacterial community induces a rapid bacterial growth during the first days of incubation and can affect the BCC (Fuchs et al. 2000). A dominance of Gammaproteobacteria is rapidly observed under these conditions due to their high growth rate and their ability to exploit DOM when available (Fuchs et al. 2000, Sjöstedt et al. 2012, Herlemann et al. 2014). The converse was observed in our study, since the relative proportion of Gammaproteobacteria tended to decrease during the experiment in the controls and none of the OTUs overwhelmed the others (Fig. 7). By maintaining the natural concentrations of
bacteria and grazers at the start of the experiment, we certainly limited the artifactual overgrowth of some opportunistic OTUs.
Interestingly, BCC was modified by the addition of riverine DOM but not by adding amino acids. One consequence of the addition of riverine DOM is the decreasing relative number of SAR11 sequences per sample at T6 (21.7% in R and LR vs 40.7% in C and L, Table 3). SAR11 clade is ubiquitously distributed throughout the ocean and typically account for 15-35% of all bacterioplankton (Morris et al. 2002). The high abundance of SAR11 in oligotrophic environments might in part be due to efficient genome streamlining conferring advantages to grow at low substrate concentrations (Giovannoni et al. 2005). SAR11 is adapted to oxidize a variety of monomeric substrates, including amino acids, glucose, ATP, and one-carbon compounds (Sun et al. 2011). The inability of SAR11 to use high molecular weight DOM present in riverine water can explain the decrease in R and LR conditions, even if this clade has been already reported in estuaries (Campbell and Kirchman 2013).
The second major effect was the increase in the abundance of OTUs belonging to the
Betaproteobacteria clade OM43 that is commonly found in productive coastal ocean
ecosystems and freshwater environments (Rappé et al. 2000). The OM43 clade is related to Type I methylotrophs of the family Methylophilaceae (Lidstrom 2001). They are aerobic, obligate methylotrophs that cannot oxidize methane, but can use C1 compounds (methanol, methylamine, formate) as their sole source of carbon and energy (Anthony 1982, Giovanonni et al. 2008, Sowell et al. 2011). The abundance of OM43 clade is usually low in the marine environment, rarely exceeding 2% of cells (Morris et al. 2006, Sowell et al. 2011). In this study, we measured up to 31% OTUs belonging to OM43 in the treatments R and LR at T6 whereas they represented only 14.8% in the other treatments. The bloom of OM43 when riverine DOM was added can be explained by high concentrations of C1 compounds naturally present in the Rhone River or produced during the storage of the water sample before the lyophilization step (see Material and methods). This suggest that humic acids were not necessary the main component within riverine DOM which drove the BCC in this experiment. It was previously reported that Alphaproteobacteria is the main group stimulated when humic acids are specifically added to a marine bacterial community (Rocker et al. 2012).
The combination of DOM sources led to a higher bacterial richness compared to the single addition at T6 hence confirming our hypothesis. However, Simpson index was similar between R and LR treatments. The use of batch cultures with single additions of DOM at the start of the experiment could present some limitations to observe a synergy in the BCC changes for the use of two DOM sources with contrasted turnover. Future experiments should
consider the use of flow-through cultures to promote the development of a specific BCC when labile and refractory DOM are mixed.
No evidence of a priming effect
We tested the possibility of a priming effect (PE) by comparing the degradation of DOM and the bacterial activities between the different treatments. In case of a positive PE, DOM degradation and/or the bacterial activities measured in the treatment where both DOM sources are combined, are expected to be higher than those measured in the treatments where each DOM source was added separately. We never observed such a situation in our experiment (i.e., no significant differences were observed in DOC concentration between C and L treatments and between R and LR treatments at T6 and T42). Different hypotheses can be proposed to explain the absence of a positive PE in the experimental conditions used:
(1) A low concentration of nutrients is necessary to trigger a PE. We performed our experiments with the additions of PO4 and NH4 in order to avoid any limitation by nitrogen or
phosphorus. The concentrations of phosphorus remained in excess during the experiment whereas ammonium was completely used (Fig. 2). However, the net release of DON at T6 and NO3 and NO2 at T42 suggests that nitrogen was not limiting in the different treatments. In
soils, the stimulation of DOM degradation by the simple addition of inorganic nutrients (especially mineral N) was sometimes considered as a PE (Kuzyakov et al. 2000). In this study, we restricted the PE to the observation of any stimulation in DOM degradation after the addition of labile DOM aside from N and P limitations. However, by supplying bacteria with inorganic N and P nutrients, the PE may not be measurable. Indeed, when available forms of inorganic nutrients are limited, bacteria can invest in the production of extracellular enzymes to break down more recalcitrant DOM and liberate N and P, a strategy known as “nutrient mining” (Kuzyakov et al. 2010). However, recently Catalán et al. (2015) demonstrated the absence of a positive PE in lake water microcosms with or without nutrient additions (Table 1), thus suggesting that nutrients are not necessarily a key factor for PE occurrence in aquatic systems.
(2) A sustained addition of labile DOM is necessary to trigger PE. In our experiment, the single addition of labile DOM at the beginning of the experiment was rapidly consumed during the first 6 days (see above). In the coastal environment, labile DOM is delivered during the entire phytoplankton bloom and can favor the adaptation of bacteria for the degradation of recalcitrant riverine DOM by fueling continuous energy. A PE has been previously observed after a single addition of labile DOM (e.g., glucose) in microcosms
containing freshwater and soils (Guenet et al. 2014). However, in this case the concentration of labile DOM added was several magnitudes higher than concentrations observed in aquatic ecosystems (10,000 µmol L-1 DOC versus 9 µmol L-1 in our study) leading to an unrealistic
situation.
(3) The presence of residual semi labile riverine DOM in our experiment could have interfered with the PE process by delaying the attack of more recalcitrant riverine DOM, therefore rendering inefficient the addition of labile DOM. However, Koch et al. (2014)
observed that the addition of glucose (~170 µmol L-1 C) in two-year-old aged seawater did
not promote the degradation of background DOC.
(4) The addition of labile DOM as dissolved free amino acids (direct substrates) could be inadequate to trigger the PE. By adding bioavailable but more complex organic substrates requiring extracellular enzymes for degradation (e.g., proteins or polysaccharides), the simultaneous degradation of riverine DOM degradation may be stimulated. However, this hypothesis was not confirmed in a recent study where proteinaceous organic matter from jellyfish did not favor the degradation of recalcitrant DOM from a coastal lagoon during 22 days (Blanchet et al. 2015). In addition, Catalán et al. (2015) did not observe a PE whatever the complexity of the labile DOM added.
(5) The determination of the elemental composition of DOM (i.e., DOC, DON, DOP) and FDOM proxies may not be sufficiently sensitive to demonstrate the occurrence of a PE. These bulk parameters are exposed to both degradation and production processes. Different studies have demonstrated that bacteria can produce recalcitrant DOM (i.e. microbial carbon pump) (Jiao et al. 2010) and FDOM (Romera-Castillo et al. 2011). This re-working of DOM complicates the observation of a PE (Bengtsson et al. 2014). 13C or 15N labeled organic molecules have been frequently used for PE studies in soils and aquatic systems to follow more precisely the degradation of recalcitrant or labile material (Bengtsson et al. 2014, Guenet et al. 2014). This approach offers a high sensitivity for tracking the degradation of specific substrates but requires the use of model molecules that do not reflect the complexity of natural DOM.
Conclusion
We did not observe in this study a relationship between changes in BCC and BCA after the addition of different DOM qualities. BCA was influenced by the addition of labile DOM (amino acids solution) while BCC was driven by the addition of more recalcitrant DOM (riverine DOM). Despite the clear stimulation of bacteria after the addition of amino acids,
and the selection of bacterial species by the riverine DOM, the combination of both DOM sources did not induce a PE. To date, results from the literature concerning the PE in aquatic ecosystems are conflicting (Table 1). PE studies must be pursued for a better understanding of this potential important process in marine environments by favoring biodegradation experiments using DOM labeling and continuous cultures. The description of BCC in PE experiments could help to understand which parameters trigger the PE in aquatic ecosystems by identifying the responsive species during this process.
Acknowledgements
This research was funded by the French program EC2CO/CNRS-INSU through the IMPEC project. Rhône River discharge data were provided by MOOSE (Mediterranean Oceanic Observing System on Environment) with the support of the “Agence de l'Eau Rhône-Méditerranée et Corse”. MB was supported by a PhD grant from the French Ministry of Research. C.M. and F.L. Aparicio received support from Ministerio de Economía y Competititvidad (DOREMI project, CTM2012-34294). The authors thank Nyree West for language improvements. We thank Ingrid Obernosterer for helpful discussions and two anonymous reviewers for their constructive comments that improved the manuscript. We are grateful to the BIO2MAR platform (http://bio2mar.obs-banyuls.fr) for providing technical support and access to instrumentation.
References
Aiken GR, McKnight DM, Wershaw RL, MacCarthy P (1985) (eds) Humic substances in soil, sediment, and water. Wiley, New York
Aminot A, Kérouel R (2007) Dosage automatique des nutriments dans les eaux marines : méthodes en flux continu. Ed. Ifremer, Méthodes d’analyse en milieu marin, 188p.
Anthony C (1982) The biochemistry of methylotrophs. London, UK: Academic Press
Arrieta JM, Mayol E, Hansman RL, Herndl GJ, Dittmar T, Duarte CM (2015). Dilution limits dissolved organic carbon utilization in the deep ocean. Science 348:331-333
Attermeyer K, Hornick T, Kayler ZE, Bahr A, Zwirnmann E, Grossart H-P, Premke K (2014) Enhanced bacterial decomposition with increasing addition of autochthonous to allochthonous carbon without any effect on bacterial community composition. Biogeosciences 11:1479–1489
Attermeyer K, Tittel J, Allgaier M, Frindte K, Wurzbacher C, Hilt S, Kamjunke N, Grossart H-P (2015) Effects of light and autochthonous carbon additions on microbial turnover of allochthonous organic carbon and community composition. Microb Ecol 69:361–371
Bengtsson MM, Wagner K, Burns NR, Herberg ER, Wanek W, Kaplan LA, Battin TJ (2014) No evidence of aquatic priming effects in hyporheic zone microcosms. Sci Rep 4:5187
paradigm and the priming effect. Proc Natl Acad Sci USA 108:19473–19481
Bianchi TS, Thornton DCO, Yvon-Lewis SA, King GM, Eglinton TI, Shields MR, Ward ND, Curtis J (2015) Positive priming of terrestrial derived dissolved organic matter in a freshwater microcosm system. Geophys Res Lett 42:5460–5467
Blagodatskaya Е, Kuzyakov Y (2008) Mechanisms of real and apparent priming effects and their dependence on soil microbial biomass and community structure: critical review. Biol Fertil Soils 45:115–131
Blanchet M, Pringaut O, Bouvy M, Catala P, Oriol L, Caparros J, Ortega E, Intertaglia L, West N, Agis M, Got P, Joux F (2015) Changes in bacterial community metabolism and composition during the degradation of dissolved organic matter from the jellyfish Aurelia aurita in a Mediterranean coastal lagoon. Environ Sci Poll Res 22:13638–13653
Briand E, Pringault O, Jacquet S, Torréton J-P (2004) The use of oxygen microprobes to measure bacterial respiration for determining bacterioplankton growth efficiency. Limnol Oceanogr Methods 2:406–416
Campbell BJ, Kirchman DL (2013) Bacterial diversity, community structure and potential growth rates along an estuarine salinity gradient. ISME J 7:210–220
Carlson CA, Giovannoni SJ, Hansell DA, Goldberg SJ, Parsons R, Otero MP, Vergin K, Wheeler BR (2002) Effect of nutrient amendments on bacterioplankton production, community structure, and DOC utilization in the northwestern Sargasso Sea. Aquat Microb Ecol 30:19–36
Carslon CA, Hansell DA (2015) DOM sources, sinks, reactivity, and budget. In: Biogeochemistry of marine dissolved organic matter. (Eds., Hansell DA, Carslon CA). 2nd edition, Academic Press, San Diego. 65-126.
Catalán N, Kellerman AM, Peter H, Carmona F, Tranvik LJ (2015) Absence of a priming effect on dissolved organic carbon degradation in lake water. Limnol Oceanogr 60:159-168
Cauwet G (1994) HTCO method for dissolved organic carbon analysis in seawater: influence of catalyst on blank estimation. Mar Chem 47:55–64
Clarke K, Gorley R (2006) Primer v6: User Manual/Tutorial In. Ltd, P.-E. (ed). Plymouth, UK. Coble PG (1996) Characterization of marine and terrestrial DOM in seawater using excitation-emission matrix spectroscopy. Mar Chem 51:325–346
Cole JJ, Findlay S, Pace ML (1988) Bacterial production in fresh and saltwater ecosystems: a cross-system overview. Mar Ecol Prog Ser 43:1–10
Danger M, Cornut J, Chauvet E, Chavez P, Elger A, Lecerf A (2013) Benthic algae stimulate leaf litter decomposition in detritus-based headwater streams: a case of aquatic priming effect? Ecology 94:1604–1613
de Haan H (1977) Effect of benzoate on microbial decomposition of fulvic acids in Tjeukemeer (the Netherlands). Limnol Oceanogr 22:38–44
del Giorgio PA, Cole JJ (1998) Bacterial growth efficiency in natural aquatic systems. Ann Rev Ecol System 29:503–541
Dittmar T (2015) Reasons behind the long-term stability of dissolved organic matter. In: Biogeochemistry of marine dissolved organic matter. (Eds., Hansell DA, Carslon CA). 2nd edition, Academic Press, San Diego. 65-126.
Dowd SE, Callaway TR, Wolcott RD, Sun Y, McKeehan T, Hagevoort RG, Edrington TS (2008) Evaluation of the bacterial diversity in the feces of cattle using 16S rDNA bacterial tag-encoded FLX amplicon pyrosequencing (bTEFAP). BMC Microbiol 8:125
Druffel ERM, Williams PM, Bauer JE, Ertel JE (1992) Cycling of dissolved and particulate organic matter in the open ocean. J Geophys Res 97:15639–15659
Ducklow HW, Carlson CA (1992) Oceanic bacterial production. In: Marshall KC (ed) Advances in Microbial Ecology. Springer US, p. 113–181
Durrieu de Madron X., et al. (2011) Marine ecosystems’ responses to climatic and anthropogenic forcings in the Mediterranean. Progr Oceanogr 91:97–166
Edgar RC (2010) Search and clustering orders of magnitude faster than BLAST. Bioinformatics 26:2460–2461.
Farjalla VF, Marinho CC, Faria BM, Amado AM, Esteves F de A, Bozelli RL, Giroldo D (2009) Synergy of fresh and accumulated organic matter to bacterial growth. Microb Ecol 57:657–666
Field CB, Behrenfeld MJ, Randerson JT, Falkowski P (1998) Primary production of the biosphere: integrating terrestrial and oceanic components. Science 281:237–240
Fontaine S, Barot S (2005) Size and functional diversity of microbe populations control plant persistence and long-term soil carbon accumulation. Ecol Lett 8:1075–1087
Fonte ES, Amado AM, Meirelles-Pereira F, Esteves FA, Rosado AS, Farjalla VF (2013) The combination of different carbon sources enhances bacterial growth efficiency in aquatic ecosystems. Microb Ecol 66:871–878
Fuchs BM, Zubkov MV, Sahm K, Burkill PH, Amann R (2000) Changes in community composition during dilution cultures of marine bacterioplankton as assessed by flow cytometric and molecular biological techniques. Environ Microbiol 2:191–201
Ghiglione JF, Conan P, Pujo-Pay M (2009) Diversity of total and active free-living vs. particle-attached bacteria in the euphotic zone of the NW Mediterranean Sea. FEMS Microb Lett 299:9–21 Ghiglione JF, Murray AE (2012) Pronounced summer to winter differences and higher wintertime richness in coastal Antarctic marine bacterioplankton. Environ Microbiol 14:617–629
Giovannoni SJ, Hayakawa DH, Tripp HJ, Stingl U, Givan SA, Cho JC et al. (2008) The small genome of an abundant coastal ocean methylotroph. Environ Microbiol 10: 1771–1782
Giovannoni SJ, Tripp HJ, Givan S, Podar M, Vergin KL, Baptista D, Bibbs L, Eads J, Richardson TH, Noordewier M, Rappé MS, Short JM, Carrington JC, Mathur EJ (2005) Genome streamlining in a cosmopolitan oceanic bacterium. Science 309:1242–1245
Gontikaki E, Thornton B, Huvenne VAI, Witte U (2013) Negative priming effect on organic matter mineralization in NE Atlantic slope sediments. PlosOne 8:e67722
Guenet B, Danger M, Abbadie L, Lacroix G (2010) Priming effect: bridging the gap between terrestrial and aquatic ecology. Ecology 91:2850–2861
Guenet B, Danger M, Harrault L, Allard B, Jauset-Alcala M, Bardoux G, Benest D, Abbadie L, Lacroix G (2014) Fast mineralization of land-born C in inland waters: first experimental evidences of aquatic priming effect. Hydrobiologia 721:35–44
Haas BJ, Gevers D, et al (2011) Chimeric 16S rRNA sequence formation and detection in Sanger and 454-pyrosequenced PCR amplicons. Genome Res 21:494–504
Hansell DA (2013) Recalcitrant dissolved organic carbon fractions. Annu Rev Mar Sci 5:421–45 Hansell DA, Carslon CA, Repeta DJ, Schlitzer R (2009) Dissolved organic matter in the ocean: new insights stimulated by a controversery. Oceanography 22:52–61
Hedges J.I., R.G. Keil, R. Benner (1997) What happens to terrestrial organic matter in the ocean? Org Geochem 27:195–212
Herlemann DPR, Manecki M, Meeske C, Pollehne F, Labrenz M, Schulz-Bull D, Dittmar T, Jürgens K (2014) Uncoupling of bacterial and terrigenous dissolved organic matter dynamics in decomposition experiments. PLoS ONE 9: e93945
Holmes RM, Aminot A, Kérouel R, Hooker BA, Petersen BJ (1999) A simple and precise method for measuring ammonium in marine and freshwater ecosystems. Can J Fis Aquat Sci 56:1801–1808 Hotchkiss ER, Hall Jr. RO, Baker MA, Rosi-Marshall EJ, Tank JL (2014) Modeling priming effects on microbial consumption of dissolved organic carbon in rivers. J Geophys Res Biogeosci 119:982-995
Jiao N, Herndl GJ, Hansell DA, Benner R, Kattner G, et al. 2010. Microbial production of recalcitrant dissolved organic matter: long-term carbon storage in the global ocean. Nat Rev Microbiol 8:593–99 Jones SEG, Newton RJ, MacMahon DD (2009) Evidence for structuring of bacterial community composition by organic carbon source in temperate lakes. Environ Microbiol 1:2463–2472
Kellerman AM, Kothawala DN, Dittmar T, Tranvik LJ (2015). Persistence of dissolved organic matter in lakes related to its molecular characteristics. Nature Geosciences 8:454-457
Koch BP, Kattner G, Witt M, Passow U (2014) Molecular insights into the microbial formation of marine dissolved organic matter: recalcitrant or labile? Biogeosciences 11:4173–4190
Kothawala D.N., Murphy K.R., Stedmon C.A., Weyhenmeyer G.A., Tranvik L.J. (2013) Inner filter correction of dissolved organic matter fluorescence. Limnol Oceanogr Methods 11:616–630
Kothawala D.N., von Wachenfeldt E., Koehler B., Tranvik L.J. (2012) Selective loss and preservation of lake water dissolved organic matter fluorescence during long-term dark incubations. Sci Total Environ 433:238–246
Kuzyakov Y, Friedel JK, Stahr K (2000) Review of mechanisms and quantification of priming effects. Soil Biol Biochem 32:1485–1498
Lawaetz AJ, Stedmon CA (2009) Fluorescence intensity calibration using the Raman scatter peak of water. Appl Spectr 63:936–940
Lidstrom, M. (2001) Aerobic, methylotrophic prokaryotes. In The Prokaryotes. Stackebrandt, E. (ed.). New York, USA: Springer-Verlag.
Morris RM, Rappé MS, Connon SA, Vergin KL, Siebold WA, Carlson CA, Giovannoni SJ (2002) SAR11 clade dominates ocean surface bacterioplankton communities. Nature 420:806–810
Morris, R.M., Longnecker, K., Giovannoni S.J. (2006) Pirellula and OM43 are among the dominant lineages identified in an Oregon coast diatom bloom. Environ Microb 8:1361–1370
Murphy K.R., Butler K.D., Spencer R.G.M., Stedmon C.A., Boehme J.R., Aiken G.R. (2010) Measurement of dissolved organic matter fluorescence in aquatic environments: an interlaboratory comparison. Environ Sci Technol 44:9405–9412
Murphy K.R., Stedmon C.A., Graeber D., Bro R. (2013) Fluorescence spectroscopy and multi-way techniques. PARAFAC. Anal Methods 5:6557-6566
Panagiotopoulos C, Sempéré R, Para J, Raimbault P, Rabouille C Charrière B (2012) The composition and flux of particulate and dissolved carbohydrates from the Rhone River into the Mediterranean Sea, Biogeosciences 9:1827–1844
Pujo-Pay M, Raimbault P (1994) Improvement of the wet oxidation procedure for simultaneous determination of particulate organic nitrogen and phosphorus collected on filters. Mar Ecol Prog Ser 105:203–207
Rappe MS, Vergin K, Giovannoni SJ (2000). Phylogenetic comparisons of a coastal bacterioplankton community with its counterparts in open ocean and freshwater systems. FEMS Microbiol Ecol 33: 219–232
Raymond PA, Spencer RGM (2015) Riverine DOM. In: Biogeochemistry of marine dissolved organic matter (Eds., Hansell DA, Carslon CA). 2nd edition, Academic Press, San Diego. 509-577.
Rocker D, Brinkhoff T, Grüner N, Dogs M, Simon M (2012) Composition of humic acid-degrading estuarine and marine bacterial communities. FEMS Microb Ecol 80:45-63