Design and Evaluation of Path Planning Decision Support
for Planetary Surface Exploration
J. J. Marquez∗ and M. L. Cummings†
Massachusetts Institute of Technology, Cambridge, MA, 02139
DOI: 10.2514/1.26248
Human intent is an integral part of real-time path planning and re-planning, thus any deci-sion aiding system must support human-automation interaction. The appropriate balance between humans and automation for this task has previously not been adequately studied. In order to better understand task allocation and collaboration between humans and automa-tion for geospatial path problem solving, a prototype path planning aid was developed and tested. The focus was human planetary surface exploration, a high risk, time-critical domain, but the scenario is representative of any domain where humans path plan across uncertain terrain. Three visualizations, including elevation contour maps, a novel visualization called levels of equal costs, and a combination of the two were tested along with two levels of automation. When participants received the lower level of automation assistance, their path costs errors were less than 35% of the optimal, and they integrated manual sensitivity anal-ysis strategies. When participants used the higher level of automation assistance, path costs errors were reduced to a few percentages, and they saved on average 1.5 minutes in the task. However, this increased performance came at the price of decreased situation awareness and automation bias.
Nomenclature
df degrees of freedom F F-test value M mean N sample number p p-value SD standard deviation Z Z-ratio valueθ relative azimuth angle, θsun− θobserver
θsun azimuth angle of the sun
Received 29 June 2006; revision received 18 December 2007; accepted for publication 2 January 2008. Copyright 2008 by J.J. Marquez and M.L. Cummings. Published by the American Institute of Aeronautics and Astronautics, Inc., with permission. Copies of this paper may be made for personal or internal use, on condition that the copier pay the $10.00 per-copy fee to the Copyright Clearance Center, Inc., 222 Rosewood Drive, Danvers, MA 01923; include the code 1542-9423/08 $10.00 in correspondence with the CCC.
∗Human Systems Integration Division, NASA Ames Research Center, M/S 262-2, Moffett Field, CA 94035, AIAA Member. ([email protected])
†Assistant Professor, Dept. of Aeronautics and Astronautics, 77 Massachusetts Ave, 33-305, Cambridge, MA 02139, AIAA Associate Fellow.
θobserver azimuth angle of the observer, direction of travel
φ relative elevation angle, φsun− φobserver
φsun elevation angle of the sun
φobserver elevation angle of the observer, slope of terrain
χ2 chi-square value
I.
Introduction
B
ALANCING task allocation between humans and computers is crucial to the development of effective decision support systems. In many domains, real-time path planning and re-planning is a vital task in which the involve-ment of both humans and computers are required. For example, military and commercial pilots plan trajectories during flight with varying degrees of automated support. Ground-based soldiers constantly revise their paths over the ground to accommodate dynamic changes in situations and resources. Similarly, unmanned air vehicle (UAV) operators also re-plan routes in response to emergent threats and targets. In these cases, human geospatial problem solving is an integral part of the operator’s interaction with the automation.In part due to the recent national attention on space exploration and humans returning to the Moon,1 we have focused on path planning in the domain of human planetary surface exploration, where future astronauts will have to conduct real-time traversal re-planning under time pressure to adapt to unexpected environmental and operational scenarios. Optimizing a planetary extravehicular activity (EVA, or sortie) in real-time is a difficult task requiring integration of terrain models, physiological models, life support and other operational constraints, as exemplified by the many challenges faced by Apollo astronauts during their planetary traverses. From a path planning perspective, Apollo 14’s second EVA illustrates the limitations astronauts faced in re-planning their traversal.2,3The astronauts’ challenge was to re-plan their path based on all relevant factors with only a laminated, paper map to assist them. As a result during the traversal, the astronauts had poor situation awareness of their location, exacerbated by inadequate surface contrast, sun position, and the monochromatic terrain (i.e., lighting conditions). Additionally, the path under-taken resulted in high metabolic consumption rates and increased heart rates, necessitating extra rest stops which made the astronauts fall behind schedule. Consequently, the EVA goal of reaching Cone Crater’s rim was abandoned in favor of accomplishing other mission objectives. Undoubtedly, future manned missions to the Moon will take advantage of the technological advantages of the last 35 years, providing astronauts and mission controllers with automated decision support tools for EVA planning and re-planning.
With such a large problem space and resultant complex optimizations, humans will have to leverage automation through decision support tools, thus it is important that we begin to understand human-automation interactions in terms of automated path planners. Methods for generating paths, or trajectories, for autonomous systems have been extensively studied within the computer science field in order to develop faster and more robust algorithms; yet, little attention has been given to how humans optimize trajectories with automated assistance. This trend is not surprising considering that one strength of automation is its repeatable, precise, and speedy computations,4 ideal for computer-generated path optimization when the state of all variables is known and pre-determined. However, automation can be inflexible, and unable to adapt to changing situations. Conversely, humans’ strengths are their abilities to improvise, learn, and reason inductively.4which are precisely the skills required to adapt to unexpected circumstances. This type of problem solving is called knowledge-based reasoning.5 during which humans make decisions under novel and uncertain situations. These decisions are not based on a predetermined set of rules, but rather leverage past experiences and judgment to solve a problem. Any automated path planning aid must be flexible enough to support astronauts’ knowledge-based reasoning, particularly as “the unexpected” is inherent to space exploration, yet it must take advantage of the strength of automation computation to produce adequate path solutions in high-risk and time-critical domains.
In order to better understand task allocation and collaboration between humans and automation for geospatial problem solving, a prototype path planning aid was developed and tested. An experiment was designed to investigate how humans conduct optimization of path planning and how their performance is affected by increasing automated assistance. In this investigation, there were two independent variables under consideration: 1) Two different visual-izations and 2) the level of automated assistance. This paper describes the design of the path planner, the experiment
with the prototype, and lastly, the results of the impact of these two independent variables on human-computer path planning.
II.
Background
While the use of automation is generally a requirement for tasks that involve human judgment within large, complex problems spaces, there can be automation effects that are detrimental to human task performance. For instance, humans can rely on automated solutions without realizing the solution may be erroneous or sub-par, unwilling to search for contradictory information. These effects, automation bias6,7and complacency,8may lead to poor task performance. Even if the automation is working as expected, humans may still perform poorly due to mode awareness errors9and decreased situation awareness.10,11(SA).
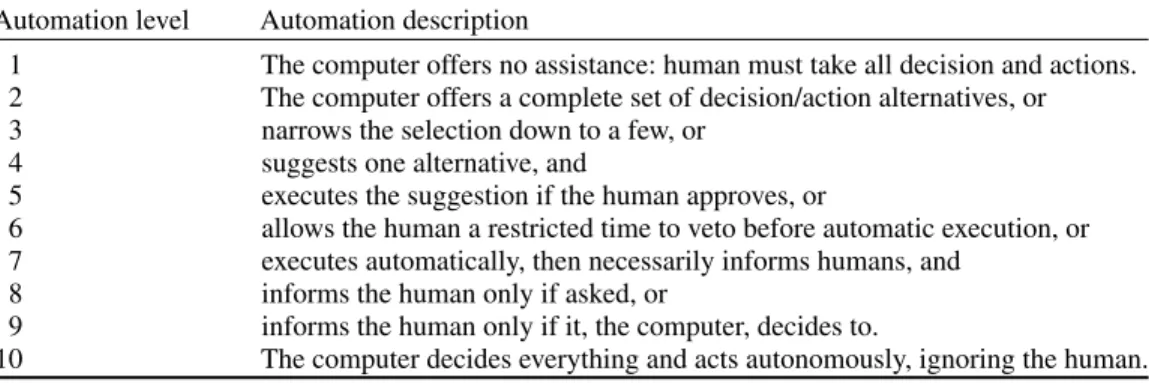
These effects vary in severity, often due to role allocation and the degree of automation within the decision making process. There are several classifications that describe human-automation functional task allocations, and one of the most common is Sheridan and Verplank’s levels of automation12 (LOA). The levels have evolved to a list of ten13 (Table 1) that range from one extreme, where the human makes all the decisions and actions, to another, where only the automation decides and acts. At the lower levels, the human takes a more active role in the decision making process, from finding a solution (or decision) to sorting through possible alternatives suggested by the computer. At level 5, the automation begins to take an active role in decisions, and subsequently, the human is only required to accept or veto solutions presented to him/her. At the higher levels, the human is taken out of the decision-making loop.
Within the field of human-computer path planning or re-planning, there are only three reported studies that have investigated the effects of various automation levels on human task performance.14−16These focused on the domain of aviation decision making, in particular, flight trajectories, as opposed to ground route planning, but the same lessons learned apply to this investigation.
Layton et al.16developed and tested a prototype en-route flight planner which required pilot participants’ to re-plan an aircraft flight trajectory in order to adapt to a change in environmental conditions. Three versions of the planner were explored, each version differing in the amount of automation assistance provided. The lowest automation level possible allowed participants to “sketch” flight trajectories on the computer map, i.e., the human planner sketched paths and the computer filled in trajectory details such as arrival times. At the highest level, the computer interface, without prompting by the participant, provided a solution to the flight trajectory conflict; this would be analogous to LOA 5. In the middle, equivalent to LOA 4, the participant could ask the computer to provide a flight path solution based on selected constraints. The main result was that participants tended to over-rely on the computer-generated solutions, selecting sub-optimal paths. A possible reason was that participants did not explore the problem space as much when presented with a solution.
Chen and Pritchett14evaluated a prototype computer aid for emergency aircraft trajectory generation (for wave-off conditions), simulating both plan and execution of new trajectories by pilots. The task was to create a new trajectory, under an emergency scenario, that minimized time to land and did not violate constraints, i.e., weather, airspace
Table 1 Levels of automation. Automation level Automation description
1 The computer offers no assistance: human must take all decision and actions. 2 The computer offers a complete set of decision/action alternatives, or 3 narrows the selection down to a few, or
4 suggests one alternative, and
5 executes the suggestion if the human approves, or
6 allows the human a restricted time to veto before automatic execution, or 7 executes automatically, then necessarily informs humans, and
8 informs the human only if asked, or
9 informs the human only if it, the computer, decides to.
10 The computer decides everything and acts autonomously, ignoring the human.
regulations, and aircraft limits. The authors tested three conditions: re-planning with no aid (only charts), with aid, and aid with pre-loaded plans. These conditions are comparable to LOAs 1, 2 and 4, respectively. Performance was measured by time to land and workload. The worse performance was seen in the condition where there was an aid, but no pre-loaded plan. The best performance was achieved when pilots adopted the pre-loaded plans, though there was no significant difference with the test condition of no aid. The authors, however, favored the pre-loaded aid since in a few instances, pilots were unable to create and evaluate a satisfactory trajectory. This study also presented evidence for automation bias, as some pilots did not improve upon the sub-optimal, pre-loaded plan, as well as over-reliance which occurred when pilots accepted erroneous information presented by the automated aid.
In the third study, Johnson et al.15investigated the effects of time pressure and automation on a route re-planning task. Participants were asked to make new paths that would first, satisfy mission constraints (avoid threat areas and arrive at targets within an acceptable time-to-target and sufficient fuel), and second, minimize route cost (time spent in hazard zones and deviations from time-to-targets). Six time pressures were imposed on the scenarios, ranging from 20 to 125 seconds. There were four automation level variants; “no automation” condition with no assistance in route selection provided to the participant, while “full automation” provided a sub-optimal path that met the constraints (time-to-target and fuel restrictions) and avoided hazard zones. Intermediate automation assistance only provided routes that met either the constraints or the hazard avoidance. While the first two conditions are akin to LOA 2 and 4, the latter two conditions fall somewhere in between. Performance was measured by route cost and constraint violation. Based on their experiment, the authors concluded that full automation was most beneficial for the shortest time pressure (less than 30 seconds). The more time participants were given, performance differences decreased between automation assistances. The exception to this trend was around the 1 minute mark, when participants’ performance decreased with more automation assistance. There was also evidence for complacency and automation bias, as noted by the decreased number of route modifications in the highest level of automation.
In general, previous studies suggest that for the task of path planning and re-planning, higher levels of automated assistance was beneficial for time pressured scenarios. Yet automation bias and over-reliance occur in every instance, particularly as automated solutions were sub-optimal. While these studies focused on user performance with different LOAs, they did not attempt to quantify how well humans optimized with different cost functions or conducted sensitivity analyses. Moreover, there was no discussion of the impact of the actual planning algorithms and their associated visualizations, which could significantly alter the results. Our goal in this effort was to examine not only the impact of increasing levels of automation in the path planning task on human performance, but also investigate the effects of possible visualizations in order to find an effective method for human-computer collaboration with respect to path planning optimization.
III.
PATH: Planetary Aid for Traversing Humans
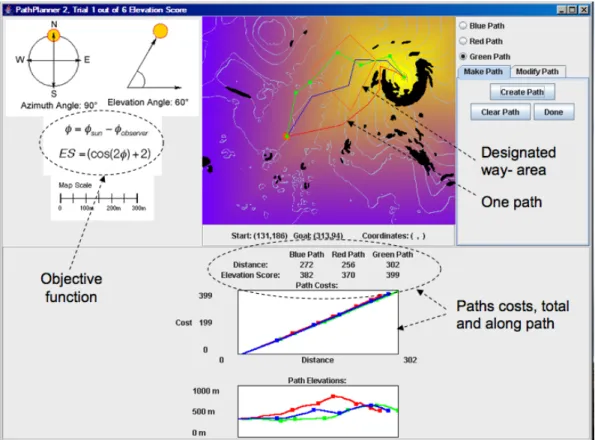
The prototype path planner (named PATH, Planetary Aid for Traversing Humans) developed in the course of this research assists users in optimizing paths (Fig. 1) in both planning and re-planning tasks. The planner is generic, but our scenarios mimic human planetary exploration. The terrain database used in the planner is based on an actual area of the Moon. The planner is divided into four parts: environmental conditions (top left), terrain map visualization (top center), path manipulation functionalities (top right) and path information (bottom). Within the terrain map visualization, users are presented with a given start and end (goal) location for a path as well as a designated way-area. Users are constrained to make paths between the start and goal, and paths are only considered valid (within the experimental protocol) if they go through the designated way-area. While users are not limited in the number of paths they can create, at most only three can be displayed and manipulated on the planner.
There are two methods of creating a path, depending on the level of automation available to the user (discussed further in subsequent sections). In the first method (labeled passive automation), the user clicks on the terrain map visualization to individually select all the waypoints within a path. The first and last waypoints are the given start and goal locations, and at least one waypoint must be in the designated way-area. A straight line connects each waypoint. In the second method (named active automation), the user clicks within the designated way-area to determine only one intermediate waypoint within the path. Then, the automation calculates and optimizes two path segments: from the start location to the intermediate waypoint and from the intermediate to the goal location.
Fig. 1 Planetary aid for traversing humans (PATH) Interface.
Once a path is created, its cost is automatically calculated and shown in the lower portion of the display (in a table and a graph). The cost for each path is based on an objective function, which can include variables such as total distance, energy consumed, or optimal lighting conditions. Also found in the lower portion of the display is an elevation profile, plotting the terrain elevation along the path. Finally, the user always has the ability to modify the path regardless of which level of automation was used to create the path. The user can modify the path by deleting, adding, and/or moving waypoints of a selected path. Cost changes based on modifications are updated on the interface automatically. Path modification is an important functionality as it provides feedback and permits the user to conduct a sensitivity analysis on their paths, and assess the cost penalties or benefits of changes.
A. Decision Support Computation and Visualization: Levels of Equal Cost (LOEC)
PATH currently utilizes lunar terrain elevation information from the Cone Crater area, the landing site of Apollo 14. Obstacles were defined by assessing the average slope of areas that were deemed impassable by suited astronauts. In order to determine least-costly paths between two locations, we used the numerical potential field method17,18 (NPFM). There are multiple path planning methods that we could have implemented, such as applying a visibility or a Voronoi graph in conjunction with a search algorithm like A∗. Instead, we chose to apply NPFM, which combines cell-decomposition space and artificial potential fields for planning.19This method is particularly useful for human-computer interaction since it fundamentally relies on the idea of a “force field metaphor”,20 where solutions are “attracted” by the goal location and “repelled” by obstacles. This metaphor provides human decision makers an intuitive, perceptually-based solution for a complete problem space.
We hypothesized that the decision support visualization for this metaphor would help users better understand how the automation works. The color gradient overlaid on the terrain map (Fig. 1) is this visualization, termed levels of equal cost (LOEC). The LOEC visualization is generated by using the calculations of NPFM, which essentially uses Dijkstra’s algorithm21to search for paths in a grid decomposition of the space (or terrain). The algorithm determines
the minimum cost from every grid location in the terrain to the goal. The cost is based on the objective function. Every obstacle is given a high penalty cost, thus the minimum cost associated with obstacle locations are always high, and thus avoided. As a result, a “total cost” field for the space is generated, where the goal has a minimum total cost and obstacles are peaks of high total cost. This total cost field is rendered in gradient colors, and locations depicted in the same color have the same total cost – thus color indicates equal levels of cost.
By visually representing the total cost field and leveraging the “force field metaphor”, we propose that the LOEC visualization may be helpful for users in understanding the complete problem space because it integrates multiple variables and reduces a complex problem to one that is more intuitively obvious. Paths of minimum cost are explicitly represented in a spatial manner. Differences in color on the LOEC map indicate how the cost changes throughout the problem space, in this case, the terrain. Since the LOEC are total costs, calculated using all the variables pertinent to the objective function, the user can gain a better understanding of the relationships between cost and variables, regardless of how complex the objective function may be, by studying the LOEC visualization. This may be particularly important for non-intuitive cost functions, such as those that rely on sun position as opposed to terrain information. Furthermore, the LOEC may guide sensitivity analysis as users will want to match path segments with corresponding LOEC colors. Lastly, this visualization supports direct perception-action interaction, which is an imperative design requirement for complex human-system integration since it allows operators to perceptually understand design constraints, so that they then develop the correct mental model, directly perceive the system state, and finally make correct decisions.22
B. Variants of PATH: visualizations, automation level and objective functions
For the human-in-the-loop evaluation of PATH, there were two main differences among the variants of PATH: the visualization map and the automation level. Three possible visualizations, which will be discussed in more detail, included an elevation contour map, a LOEC map, and the combination of LOEC and elevation contours (Fig. 1 displays the combination). Two levels of automation were implemented that essentially map to LOAs 2 and 4, which were the common levels across the studies discussed previously. LOA 2 represents the condition in which a computer aid is used primarily as a filtering tool, but the human does most of the problem solving. With LOA 4, the user prompts the automation for a suggested solution, leaving the problem solving mostly to the computer. These two levels of automation reflect the human-computer function allocation, in other words, how much of the path is decided by the automation or the human. We named the automation levels active (LOA 4) and passive (LOA 2), to correspond with the role automation plays within the path planning task. Within active automation, the user only decides on an intermediate waypoint, representative of an astronaut’s selection of an exploration area, while the automation finds and plots the least-costly path segments between this user-specified waypoint and the given start and goal. This does not necessarily mean that the user is presented with the least-costly path between the given start and goal locations; the user must still determine the appropriate intermediate waypoint that will result in an overall least-costly path. Within the passive automation condition the user takes a more central role, deciding all the waypoints within a path, while the automation takes the more supportive role of calculating all the costs. In both levels of automation, the user can still choose to manually modify the paths, which could improve or worsen the overall path cost.
Finally, paths could be optimized to any type of objective function since the planner is generic. For the purposes of this evaluation, we were primarily interested in optimizing paths whose costs relate to lighting conditions. Lighting conditions are important on the Moon because of the lack of atmosphere and the monochromatic surface, making it difficult for suited astronauts to obtain the appropriate depth perception cues. As illustrated in the Apollo 14 EVA, lighting conditions contributed to the reduced crew’s situation awareness and hence, the failure of the overall mission. Additionally, in terms of the path planning, we wanted to use an objective function that was not intuitively obvious, i.e., minimizing distance is relatively easy for humans who recognize they should pick the shortest path. Thus we chose to base our objective function on a geo-spatial variable, sun angle, which determines the lighting conditions. Objective functions that are related to lighting conditions are not intuitive, as humans rarely attempt to optimize paths based on where the sun is located, as opposed to, for example, finding the shortest path. The objective functions based on the sun angle are shown on the left side of the interface (Fig. 1).
C. Evaluating Path Planning Decision Support
We designed an experiment to test the different automation and visualization elements of this path planner. We specifically wanted to investigate and quantify how well participants performed in creating least-costly paths when interacting with the passive and active automation levels, as well as the different types of visualization, with increasingly difficult objective functions. It was hypothesized that with active automation, participants would be able to create near-optimal least-costly paths, regardless of the objective function, in a shorter period of time as compared to passive automation. However, we hypothesized smaller errors and shorter times would be achieved at the expense of decreased situational awareness. We also hypothesized that within the passive automation level, the LOEC visualization would assist participants in creating least-costly paths and in shorter periods of time as compared to participants that did not have that visualization, especially for more difficult objective functions.
IV.
Experiment Method
The task given to all participants was to make an obstacle-free, least-costly path that had at least one waypoint within the designated way-area. The cost for each path was based on an objective (or cost) function, which is discussed below. The computer interface provided the participant with the objective function, the environmental conditions (terrain map, obstacles, and sun position), a start and goal location as well as the designated way-area (Fig. 1). A. Participants
Twenty-seven participants volunteered for this experiment, with an average age of 25.7± 3.6 years. Participants were primarily graduate students, with 18 men and 9 women. There was no significant difference in distribution between average video-game usage and their self-ratings on map use experience.
B. Independent Variables
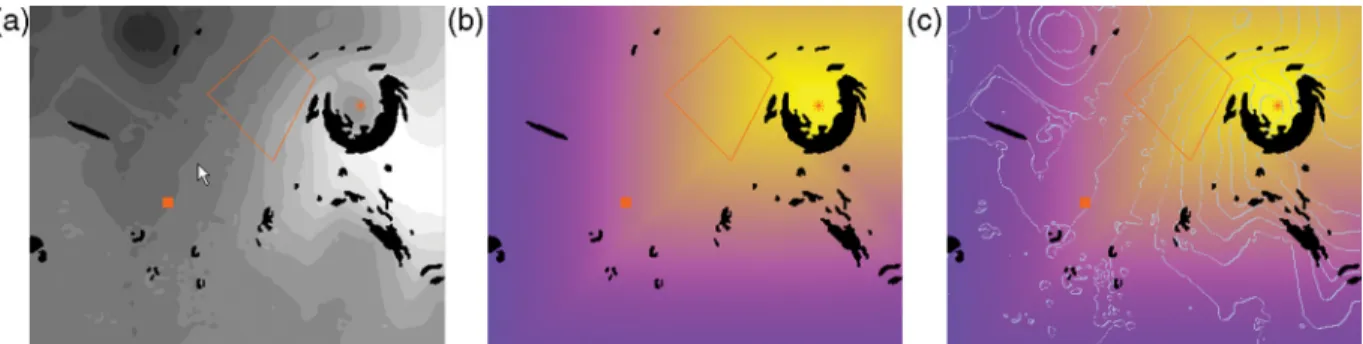
Three independent variables were tested in this experiment: type of visualization (3 types depicted in Figure 2), level of automation (the 2 levels, passive and active), and objective function (2 functions, discussed below). While visualization type was a between-subject variable, objective functions and automation type were within-subject variables, resulting in a 2× 2 × 3 repeated measures design.
Participants were randomly distributed into one of three possible groups that were assigned to a map visualization: elevation contours visualization, levels of equal cost (LOEC) visualization, or both visualizations (Fig. 2). This was the only difference between groups; all other elements, such as tables and modifying path functionalities, remained the same. The elevation contour map, which is the nominal map that users would expect, directly presented elevation gradients, but no other cost function information. With the LOEC visualization, participants are presented with an aggregate of information, terrain and costs. Since the LOEC visualization may not be as familiar as the contour map, a third visualization map, the combination of LOEC and elevation contours, was also tested. This visualization could be powerful as it provides the participant with both the raw data and the total cost map.
Two increasingly complex objective functions were used: Elevation Score (ES, Eq. 1) and Sun Score23(SS, Eq. 2). These functions are based on sun position and the path trajectory. ES is considered a simpler function than SS as it
Fig. 2 Possible map visualizations, including start & goal locations and designated way-area; a) elevation contours visualization, b) levels of equal cost visualization, and c) both visualizations.
has fewer variables to optimize. ES relates the sun’s elevation angle to the observer’s elevation angle, or terrain slope. SS not only encompasses the same information as the ES function, but also includes the relationship between sun’s azimuth angle and the observer’s azimuth angle, or direction of travel. Ultimately, a high Elevation or Sun Score means that the lighting condition is not ideal, while low scores indicate better lighting conditions for traversing. The optimal sun angle is that which causes the most contrast across the surface, which is when the sun is high in the sky (approaching 90 degrees in relative latitude) and at a cross angle from the direction of travel (at 90/270 degrees in relative longitude). If required to walk towards the sun, the best direction of travel is 45 degrees in relative longitude.
ES= cos(2φ) + 2
φ= φsun− φobserver (1)
SS= (cos(2θ) + 2) · (cos(2φ) + 2)
θ = θsun− θobserver; φ = φsun− φobserver (2) Participants were tested on the two automation levels: passive and active automation. As previously described, in passive automation, the user created a path by selecting waypoints along the path that were connected by straight path segments. In active automation, the user only defined one waypoint, in the designated way-area, and then the automation calculated and plotted least-costly paths from the start to the waypoint and from the waypoint to the goal. All participants were asked to complete four possible path planning trials. There was a five minute time limit on each trial. A previous pilot study indicated this was sufficient time to complete the task with the given functionalities, as well as keep the entirety of the experiment within a reasonable time frame. The first two trials used passive automation, and the last two, active automation. Within each automation type, participants first made an ES path and then an SS path. The order of the objective functions was not randomized among participants because the pilot study showed a learning effect across functions. Those subjects who saw the easier functions first improved more significantly as compared to those who saw the more difficult functions first. The selected presentation order for the objective function was consistent with the increase in difficulty of the functions. The order of the automation type was not randomized either because in the pilot study, it appeared that using the active automation first would bias the passive path planning strategies. Thus, while participants were randomly placed in different visualization groups, every participant was tested in only one order to minimize the learning effect due to increasing trial complexity. C. Dependent Variables
As each participant submitted a solution, the final path cost was calculated, as was the total time the participant took to complete the trial (both time spent making and modifying path), and the number of situation awareness (SA) questions that were answered correctly as a global measure of their SA. After every trial, participants were asked two questions about the previous trial (i.e., situational awareness questions). SA is the perception of elements in the current environment, the integration and comprehension of these elements and current situation, and the projection of future status based on comprehension.24Hence, the eight multiple-choice questions were designed to query the participant either about 1) elements in the display (perception), or 2) the objective functions (comprehension). For example, a perception question asked the participants to identify, from a list of possible graphical depictions, the sun’s azimuth and elevation angles. A comprehension question asked what the effect on path cost would be if the sun’s azimuth’s angle changed, given a path based on the original start and goal locations. For each trial, there was one perception and one comprehension SA question, resulting in four questions per automation level, totaling eight for the experiment.
V.
Results
Analyses were conducted on the path costs percent errors, total time to task completion, percent time spent modifying path, and number of correctly answered situational awareness questions. We used an alpha level of 0.05 for all statistical tests. Analyses of variance were used to analyze the data; if the assumptions for these tests were not met, non-parametric tests were used (Kruskal-Wallis test for between-subject variables and Wilcoxon Signed Rank test for within-subject variables).
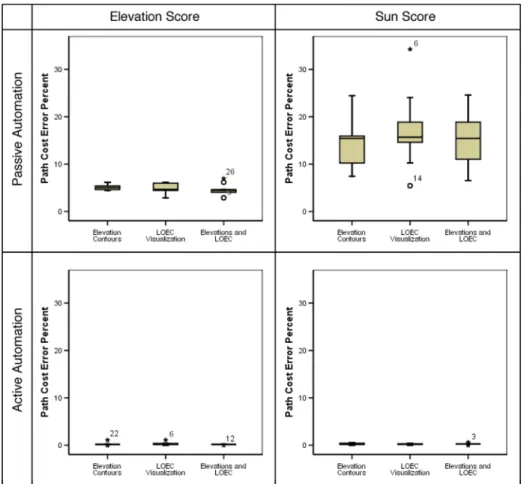
Fig. 3 Box-plot of path cost percent error across visualization, automation type, and objective function. A. Path Cost Percent Errors
Path cost percent errors were calculated by comparing the path cost generated by the participant to the automation’s minimum path cost. The range of these errors for each condition, visualization, automation type, and objective function is depicted in Fig. 3. Using non-parametric tests, we found significant differences across automation type and objective function.
In general, participants on their own were able to optimize paths within 35% of the theoretical optimal least cost even when the objective functions were unfamiliar and had little automated decision support. When provided with automated decision support, participants were able to generate a path within 2% of the optimal. For the ES objective function, a Wilcoxon Sign Rank test yielded a significant difference across automation type (Z= −4.54, df = 1, p < 0.001), resulting in smaller path cost percent errors for active automation (M = 0.24%, SD = 0.26) as compared to passive automation (M= 4.88%, SD = 0.96). Similarly for SS paths, the more difficult objective function, a Wilcoxon Sign Rank test (Z= −4.54, df = 1, p < 0.001) indicated that smaller errors were achieved when participants used active automation (M = 0.25%, SD = 0.17) as opposed to passive automation (M = 15.53%,
SD= 6.30). This effect was consistent across each of the visualizations.
Differences across objective functions were investigated within each automation type. Within passive automation, a Wilcoxon Sign Rank test (Z= −4.52, df = 1, p < 0.001) showed that SS path errors (M = 15.53%, SD = 6.30) were significantly larger than ES path errors (M= 4.88%, SD = 0.96). This effect was consistent across each of the visualizations. Within active automation, there was no overall difference between the ES and SS path errors (Wilcoxon Sign Rank test, Z= −0.77, df = 1, p = 0.440). This effect was consistent for two of the three visualizations (elevation contours visualization and LOEC visualization). For the participants that had both visualizations (elevation contours and LOEC), there was a marginally significant difference across objective functions (Wilcoxon Sign Rank
test, Z= −1.85, df = 1, p = 0.06): SS active path errors (M = 0.29%, SD = 0.17) were larger than ES active path errors (M = 0.16%, SD = 0.06).
A Kruskal-Wallis test was performed on each combination of objective function and automation type to examine the differences across visualizations. For each of the four conditions, there was no significant difference between the visualizations.
B. Total Time to Task Completion
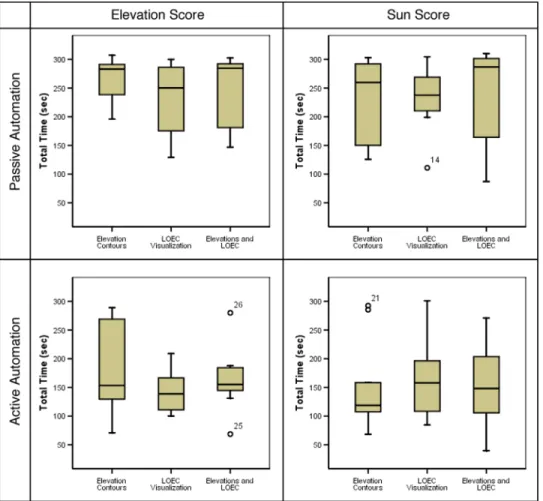
Figure 4 shows a box-plot of times to task completion (in seconds) across visualizations, automation type, and objective function. A repeated measures analysis of variance (2× 2 × 3) was performed to investigate the differences in total time to task completion between all the conditions.
There was no significant difference across visualizations with respect to total time (F(2, 24)= 0.10, p = 0.91). Expectedly, participants took significantly less time to complete the task when using active automation (M = 162.44,
SD= 69.04) than when using passive automation (M = 241.87, SD = 63.77) (F(1, 24) = 58.10, p < 0.001).
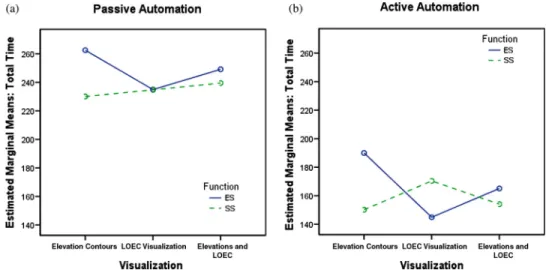
We found a marginally significant difference across objective functions (F (1, 24)= 3.70, p = 0.07). On average, participants took slightly longer to make ES paths (M = 207.79, SD = 71.82) than SS paths (M = 196.52, SD = 82.62). However, there was a significant interaction between function and visualization (F(2, 24)= 5.78, p = 0.009). As seen in Fig. 5, the interaction is caused primarily by the active automation. It appears that LOEC helped participants arrive more quickly at a solution for the more complex objective function. Participants that had elevation contours
Fig. 4 Box-plot of total time to task completion (seconds) across visualization, automation type, and objective function.
Fig. 5 Means plot of total times across visualization and objective functions: a) passive automation and b) active automation.
in their visualization took longer to make ES paths than SS paths, yet for participants with the LOEC visualization, the opposite trend is seen. Simple contrasts revealed no significant differences between functions within specific visualization groups.
C. Percent Time Spent Modifying Path
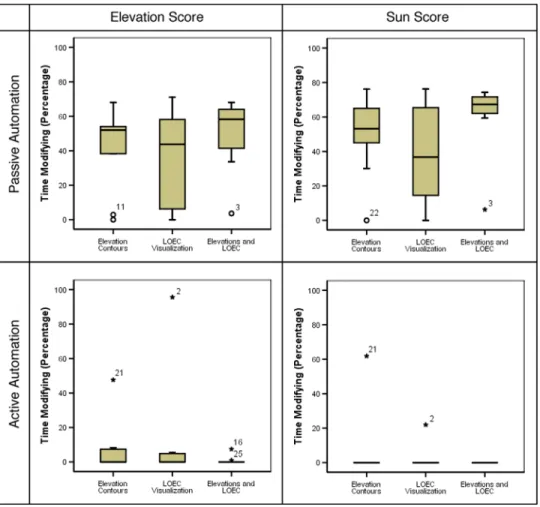
Participants, when creating a least-costly path with passive automation, spent a large portion of their time modifying paths by moving, adding, and deleting waypoints. Since we are interested in understanding how humans conduct optimization, assessing how much time participants devoted to a sensitivity analysis on their path solution is important. Most participants did not use this functionality with the active automation as much, choosing instead to repeatedly make new paths (see Fig. 6). There are two possible reasons for this trend. First, participants may have found modifying a path was more time consuming than just making a new path with the active automation; second, participants likely thought they could only make paths less optimal by modifying them as the active automation plotted least-costly paths between two waypoints. In order to further investigate this trend, we restricted our analysis to just the passive automation, where path modification was the most predominate.
Within the passive automation conditions, a 2× 3 repeated measures analysis of variance showed that there was a significant difference between objective functions (F(1, 24)= 7.25, p = 0.01). Participants spent more of their time modifying the more difficult SS paths (M= 50.13%, SD = 25.24) than the ES paths (M = 41.85%, SD = 24.25). There was no main effect based on visualization (F(2, 24)= 1.35, p = 0.28)) and no interaction was found between function and visualization (F(2, 24)= 0.54, p = 0.59).
D. Situational Awareness
After each trial, two situational awareness (SA) questions were asked, totaling four questions for passive automa-tion and four for active automaautoma-tion per participant (Table 2). A non-parametric test (Wilcoxon Signed Rank test) was performed to determine a significant difference across automation type (Z= −3.35, df = 1, p = 0.001); partici-pants answered fewer questions correctly during the active automation phase (M= 2.33, SD = 0.78) than during the passive automation phase (M= 3.19, SD = 0.92) of the experiment. No difference in SA was found between visu-alization groups (Kruskal-Wallis tests, within passive automation χ2(2, N= 27) = 1.72, p = 0.42; within active automation χ2(2, N= 27) = 0.68, p = 0.71).
VI.
Discussion
In this experiment, there were three visualization groups, one with elevation contours, one with the levels of equal cost (LOEC), and one with both elevation contours and LOEC. We hypothesized that having the LOEC visualization
Fig. 6 Box-plot of percent of time spent modifying path across visualization, automation type, and objective function. Table 2 Number of correctly answered situation awareness questions
across automation level.
Number of correct answers Passive automation Active automation
0 0 1
1 2 1
2 3 14
3 10 10
4 12 1
would help participants make superior least-costly paths, resulting in smaller cost errors and shorter task times than participants who did not have the LOEC, particularly when trying to optimize the path cost whose objective function was more complex. Our analysis did not demonstrate a main effect due to type of visualization for any dependent variable (either path cost error, total times, or situation awareness).
There are several possible reasons why we found no effect based on the type of visualization. Some participants commented that they had not used the LOEC as a primary tool to make their least-costly path, citing reasons such as they did not know exactly how to use it. Another possibility is that the LOEC visualization is not particularly useful for objective functions with few variables. The Elevation Score (ES) only optimizes one variable and the Sun Score (SS) contained two variables. These functions might not be complex enough to merit the use of LOEC. Finally, more training time and an increased participant pool could have impacted the results.
The objective function factor produced a significant effect for all three dependent variables which is expected since they represent increasing problem complexity. For path costs, within passive automation, ES path cost errors were significantly smaller than SS path cost errors, regardless of visualization. Within active automation, no overall difference between cost functions was found, but there was a marginally significant difference that favored ES paths for the visualization that had both LOEC and elevation contours.
In terms of time to completion, the objective function factor had a marginally significant main effect, however, there was a significant interaction between objective function and visualization. We expected participants would spend more time optimizing the more difficult function, SS, regardless of visualization and automation type. It appears though that with the direct presentation of elevation (i.e., the visualizations with elevation contours), participants tended to tweak their solution for the purely elevation-dependent cost function more than participants who just had LOEC visualization, thus spending more time on the simpler ES function. This, in general, is supported by the slightly lower percent time spent modifying for LOEC visualization group (compared to the other 2 visualization groups). These results indicate that the visualization shifts the manner in which participants chooses to conduct their sensitivity analysis. In essence, if the information is provided to the users, they will use it, though not necessarily to their advantage. In this case, the additional information of elevation contours on top of LOEC visualization gave the participant two factors to tweak their solution; this introduced a slightly larger error margin between objective functions in active automation and participants in this visualization group appear to spend more of their time modifying paths than the other two groups.
While the different visualizations did not significantly affect participant performance, the degree of automation dramatically affected performance across a number of dependent variables. As hypothesized, when participants used the active automation, they made smaller path cost errors and took less time than when using the passive automation, regardless of visualization and type of objective function. The smaller path cost errors is not a surprising result as the automation is assisting the participants in making the least-costly paths in a large, complex problem space. When using active automation, path cost errors were, at most, only a few percentages over the least possible cost, allowing participants to decrease about 1.5 minutes from solution times as compared to passive automation. For time critical tasks, this difference could be essential. However, this improved performance in terms of solution time came at the cost of decreased situation awareness (SA). In the passive automation trials, 81% of the participants were able to answer 3 or more of the 4 SA questions, while during active automation, only 41% of participants performed equally as well. This is likely because participants spent less time at the task and did not conduct the same level of sensitivity analyses (as measured by the percent time spent modifying) as they did during passive automation. While the passive automation caused longer solution times, it also ensured that participants became familiar with the problem and thus had a better understanding of the problem space than did those participants who used the automation to plan the routes.
Moreover, it was clear that the two different automation levels produced two different planning strategies, which in turn likely affected their situation awareness. Participants did explore the problem space within active automation, as supported by the very small path cost errors, but they did so differently. They chose to make new paths instead of modifying paths, thus eliminating the “manual” sensitivity analysis. This strategy saved them time, but lowered their overall situation awareness. They paid less attention to elements on the PATH interface, not comprehending how the automation was calculating the least-costly path. When participants had to do most of the problem solving in the path planning task (i.e., within passive automation), they appeared to conduct a more thorough sensitivity analysis when confronted with multi-variable objective functions and both LOEC and elevation contours. Unfortu-nately, while having the LOEC might have induced participants to apply more sensitivity analysis, a strategy that might have preserved their situation awareness, the ease and quickness of using the active automation prevailed. Situation awareness thus appears to be a function of both time and sensitivity analysis for the geospatial task of path planning.
VII.
Conclusions
As we embark in a new age of planetary exploration, we should prepare for the one factor that remains consistent across all types of exploration: expect the unexpected. Fully automated decision aids may not be feasible because of the dynamic nature and unknown factors within the exploration domain. This means developing decision aids that support knowledge-based reasoning.Yet the appropriate design for such aids is complex and not well understood. This research
has focused on understanding how the human conducts path optimization using different automation elements. Variants of PATH, a prototype interface for planetary path planning, were tested and participants’ performance was assessed based on their ability to minimize the cost of a path, the time required to complete the task, and their situation awareness.
In this experiment, we examined two increasing degrees of automation, three different visualizations, and the interaction with optimizing increasingly complex objective functions. We found no main visualization effect but the effect of the level of automation was strong and consistent across all dependent variables. It is possible that the strong effect of automation level, the limited number of participants, and the inherent complexity of the objective functions made it difficult to discern the effect of the visualization factor. However, the robust performance of participants, regardless of visualization, suggests that in terms of a cost-benefit approach, adapting the automation to users’ mental models is likely to have a higher benefit than focusing on the visualizations. One area of future work that focuses on the intersection of the automation and the visualization that is needed is the design of a dynamic LOEC decisions support tool. Currently, the LOEC is static and is relative to one location (the goal); users could manipulate LOEC and dynamically explore the cost map from different locations, though at the expense of computational time.
While automation is critical for such a complex, multivariate, time sensitive problem, it is not without some drawbacks. When the automation generated most of the path for the participants, they were able to perform better in terms of time and path costs, but paid the price of decreased situation awareness. Having the levels of equal cost visualization promoted sensitivity analysis, but not within active automation, thus it was not enough to counter the loss of situation awareness and automation bias.
While the effects of automation are striking and suggest that the best decisions support aid would be one that is highly automated, the situation awareness measures demonstrate a significant drawback of highly automated systems in the reduction of SA. Similar automation biases,6excessive reliance on computer-generated solutions, have been observed in other domains, such as critical event diagnosis and time-sensitive resource allocation. Our results indicate that the active automation essentially leveled the task difficulty across problem complexity, consequentially participants did not look for more information than was necessary. Such automation bias is undesirable in time-critical domains because it increases likelihood of errors of omission and commission.25Furthermore, the decision maker is less likely to perform well under unexpected situations with decreased situation awareness, preventing them from identifying situations in which the automation is not properly functioning, and hindering them in knowledge-based reasoning that is necessary under these circumstances.
This research highlights the fact that we have only begun to realize the important role that a user’s sensitivity anal-ysis for optimized solutions plays in system performance. The results showed that the automation level significantly changed the type of sensitivity analysis selected, and potentially changed how the user optimized different objective functions (as supported by the SA effect across level of automation). Identifying and recording other measures that better describe the process of how a user interacts with optimization algorithms, both for this path planning research and for other domains that require optimization algorithms, will be key in future studies.
Acknowledgments
We would like to acknowledge the NASA Harriett G. Jenkins Predoctoral Fellowship and the Office of Naval Research for sponsoring this research. We would also like to thank Ms. Heather Conner and Ms. Maithilee Kunda for their contributions to this research and all the volunteer subjects that participated in this experiment.
References
1NASA, “The Vision for Space Exploration”, NASA Headquarters, Washington, D.C., 2004
2Johnston, R. S. and Hull, W. E., “Chapter 2: Apollo Missions,” Biomedical Results of Apollo (NASA SP-368), edited by R. S. Johnston, L. F. Dietlein and C. A. Berry, NASA, Washington, DC, 1975, pp. 9–40.
3Waligora, J. M. and Horrigan, D. J., “Chapter 4: Metabolism and Heat Dissipation During Apollo EVA Periods,” Biomedical
Results of Apollo (NASA SP-368), edited by R. S. Johnston, L. F. Dietlein and C. A. Berry, NASA, Washington, DC, 1975,
pp. 115–128.
4Fitts, P. M., "Human Engineering for an Effective Air Navigation and Traffic Control System,” National Research Council, Washington, D.C., 1951.
5Rasmussen, J., “Skills, Rules, and Knowledge; Signals, Signs, and Symbols, and Other Distinctions in Human Performance Models,” IEEE Transactions on Systems, Man, and Cybernetics SMC-13, Vol. 3, 1983, pp. 257–266.
6Cummings, M. L., “Automation Bias in Intelligent Time Critical Decision Support Systems,” AIAA 3rd Intelligent Systems
Conference, 2004, pp. 1–6.
7Skitka, L. J. and Mosier, K. L., “Automation Bias and Errors: Are Crews Better Than Individuals?” International Journal
of Aviation Psychology, Vol. 10, 2000, pp. 85–97.
doi: 10.1207/S15327108IJAP1001_5
8Parasuraman, R. and Riley, V. A., “Humans and Automation: Use, Misuse, Disuse, and Abuse.,” Human Factors, Vol. 39, 1997, pp. 230–253.
doi: 10.1518/001872097778543886
9Sarter, N. B. and Woods, D. D., “How in the World Did We Ever Get into That Mode? Mode Error and Awareness in Supervisory Control,” Human Factors, Vol. 37, No. 1, 1995, pp. 5–19.
10Endsley, M. R., “Automation and Situation Awareness,” Automation and Human Performance: Theory and Applications, edited by R. Parasuraman and M. Mouloua, Erlbaum, Hillsdale, NJ, 1996, pp. 163–181.
11Endsley, M. R. and Kaber, D. B., “Level of Automation Effects on Performance, Situation Awareness and Workload in a Dynamic Control Task,” Ergonomics, Vol. 42, No. 3, 1999, pp. 462–492.
12Sheridan, T. B. and Verplank, W. L., “Human and Computer Control of Undersea Teleoperators,” Man-Machine Systems Laboratory Report, MIT, Cambridge, MA, 1978.
13Parasuraman, R., Sheridan, T. B. and Wickens, C. D., “A Model for Types and Levels of Human Interaction with Automation,”
IEEE Transactions on Systems, Man, and Cybernetics, Part A: Systems and Humans, Vol. 30, 2000, pp. 286–297.
doi: 10.1109/3468.844354
14Chen, T. L. and Pritchett, A. R., “Development and Evaluation of a Cockpit Decision-Aid for Emergency Trajectory Generation,” Journal of Aircraft, Vol. 38, No. 5, 2001, pp. 935–943.
15Johnson, K., Ren, L., Kuchar, J. K. and Oman, C. M., “Interaction of Automation and Time Pressure in a Route Replanning Task,” Proceedings, International Conference on Human-Computer Interaction in Aeronautics (HCI-Aero), 2002, pp. 132–137. 16Layton, C., Smith, P. J. and McCoy, C. E., “Design of a Cooperative Problem-Solving System for En-Route Flight Planning – an Empirical Evaluation,” Human Factors, Vol. 36, No. 1, 1994, pp. 94–116.
17Rimon, E. and Koditschek, D., “Exact Robot Navigation Using Artificial Potential Functions,” IEEE Transactions on Robotics
and Automation, Vol. 8, No. 5, 1992, pp. 501–518.
18Barraquand, J., Langlois, B. and Latombe, J. C., “Numerical Potential Field Techniques for Robot Path Planning,” IEEE
Transactions on Systems, Man, and Cybernetics, Vol. 22, IEEE, 1992, pp. 224–241.
doi: 10.1109/21.148426
19Khatib, O., “Real-Time Obstacle Avoidance for Manipulators and Mobile Robots,” International Journal of Robotics
Research, Vol. 5, No. 1, 1986, pp. 90–98.
20Frixione, M., Vercelli, G. and Zaccaria, R., “Diagrammatic Reasoning for Planning and Intelligent Control,” Control Systems
Magazine, IEEE, Vol. 21, No. 2, 2001, pp. 34–53.
21Dijkstra, E. W., “A Note on Two Problems in Connexion with Graphs,” Numerische Mathematik, Vol. 1, 1959, pp. 269–271.
doi: 10.1007/BF01386390
22Rasmussen, J., “Ecological Interface Design for Complex Systems, an Example: SEAD UAV Systems,” Wright-Patterson AFB: United States Air Force Research Laboratory, 1998.
23Carr, C. E., “Distributed Architectures for Mars Surface Exploration,” Master of Science Thesis, Aeronautics and Astronautics, Massachusetts Institute of Technology, Cambridge, MA, 2001.
24Endsley, M. R., “Toward a Theory of Situation Awareness in Dynamic Systems,” Human Factors, Vol. 37, No. 1, 1995, pp. 32–64.
25Mosier, K. and Stitka, L. J., “Human Decision Makers and Automated Decision Aids: Made for Each Other?” Automation
and Human Performance: Theory and Applications, edited by R. Parasuraman and M. Mouloua, Erlbaum, Hillsdale, NJ, 1996,
pp. 201–220.
Richard Doyle
Associate Editor