READ THESE TERMS AND CONDITIONS CAREFULLY BEFORE USING THIS WEBSITE. https://nrc-publications.canada.ca/eng/copyright
Vous avez des questions? Nous pouvons vous aider. Pour communiquer directement avec un auteur, consultez la
première page de la revue dans laquelle son article a été publié afin de trouver ses coordonnées. Si vous n’arrivez pas à les repérer, communiquez avec nous à [email protected].
Questions? Contact the NRC Publications Archive team at
[email protected]. If you wish to email the authors directly, please see the first page of the publication for their contact information.
NRC Publications Archive
Archives des publications du CNRC
This publication could be one of several versions: author’s original, accepted manuscript or the publisher’s version. / La version de cette publication peut être l’une des suivantes : la version prépublication de l’auteur, la version acceptée du manuscrit ou la version de l’éditeur.
Access and use of this website and the material on it are subject to the Terms and Conditions set forth at
Optimising sound quality for classrooms
Bradley, J. S.
https://publications-cnrc.canada.ca/fra/droits
L’accès à ce site Web et l’utilisation de son contenu sont assujettis aux conditions présentées dans le site
LISEZ CES CONDITIONS ATTENTIVEMENT AVANT D’UTILISER CE SITE WEB.
NRC Publications Record / Notice d'Archives des publications de CNRC: https://nrc-publications.canada.ca/eng/view/object/?id=cb8703be-2eb7-45d8-a769-84d69261fd3a https://publications-cnrc.canada.ca/fra/voir/objet/?id=cb8703be-2eb7-45d8-a769-84d69261fd3a
Optimising sound quality for classrooms
Bradley, J.S.
NRCC-45999
A version of this document is published in / Une version de ce document se trouve dans :
Proceedings of XX Meeting of SOBRAC (Brazilian Acoustical Association),
Rio de Janeiro, Oct. 21-24, 2002, pp. 1-15
Optimising Sound Quality for Classrooms
John S. Bradley
Institute for Research in Construction, National Research Council, Montreal Road, Ottawa, Canada
Abstract
It is well known that good acoustical design should optimise room acoustics and minimise unwanted noise so that effective speech-to-noise ratios are maximised in classrooms. However, the common experience of difficult speech communication in many rooms is evidence that many problems remain. A review of the literature shows that reported noise levels in classrooms almost always exceed ideal criteria, but these results may be questioned because it is difficult to measure the speech and noise levels that occur during actual speech. Many criteria are based on studies that show a poor understanding of room acoustics and tend to prescribe more absorptive environments ignoring the positive effects of early reflections. The more stringent requirements for various special needs groups such as younger listeners are much less well defined. We still design rooms in terms of reverberation time that only indirectly relates to critical room acoustics details and even this we cannot do accurately. This paper will review recent studies that have attempted to solve some of these problems and will outline key remaining research needs.
INTRODUCTION
The goal of good acoustical design for classrooms, or any other meeting room, is to make possible clear, accurate and relaxed speech communication. That is, students should be able to understand all of the words that are being spoken to them without having to strain. This is important because the majority of teaching situations involve oral communication. Poor communication between teacher and student will make the learning process more difficult. The long term social and economic cost of less than optimum acoustical designs are difficult to determine but will accumulate over years for students in inadequate classrooms.
It is well known that good acoustical design requires one to maximise the signal-to-noise ratio and to provide optimum room acoustics conditions. The fact that it is common experience that speech communication is difficult in many classrooms and almost all reported noise levels in classrooms exceed recommendations, is indicative that there still remain problems to be solved. The situation is complicated by the fact that speech and noise levels are greatly influenced by room acoustics and one cannot consider the two elements in isolation.
We have quite amazing abilities to understand speech in adverse conditions. Even when it is relatively noisy and spaces are very reverberant we are often able, or at least we think we are able, to understand speech. In practice, we are often unaware that we are frequently guessing (sometimes correctly, sometimes not) the meaning of the speech sounds. In addition there are a number of special groups of listeners who suffer greater adverse effects on their ability to understand speech when it is too noisy or too reverberant. These groups would include younger listeners, older listeners, second language listeners and anyone with even a modest amount of hearing loss.
This paper will review what we do know about the acoustical requirements for classrooms and the problems that remain to be solved.
SIGNAL-TO-NOISE RATIOS
The louder speech sounds are relative to interfering noises then the greater the intelligibility of the speech. Figure 1 shows how speech intelligibility scores measured in a number of rooms [1,2] increase with increasing signal-to-noise ratio (S/N). These results and others [3] have led to the conclusion that a S/N of +15 dB provides conditions in which 100% intelligibility scores are possible on a simple speech intelligibility test. Of course, there is a large amount of scatter in the experimental results of Figure 1 because of the differences between various groups of listeners and because a simple S/N measure ignores the variations in room acoustics.
The Articulation Index (AI) is a more sophisticated S/N type measures that was developed some time ago [4] initially for evaluating communication systems. The AI [5] is based only on monaural listening to male speech and so would not necessarily relate to typical binaural listening conditions in rooms for all types of listeners. The AI measure is a weighted speech-to-noise ratio measure with frequency weightings or importance ratings that are
similar but not the same as the A-weighting variation with frequency. The latest revision of the ANSI standard [6] has revised the measure and renamed it the Speech Intelligibility Index (SII) with slightly different frequency weightings. -10 -5 0 5 10 15 0 20 40 60 80 100 Intellig ibility, % S/N, dBA
Figure 1. Speech intelligibility test results versus A-weighted S/N ratios for measurements in a wide range of rooms [1,2]
There are many different types of speech intelligibility or speech recognition tests. In some, listeners must identify single words and in others complete sentences. Although the shape of the curves of speech intelligibility scores versus S/N vary among the various tests, they would all indicate very close to 100% intelligibility at a S/N of +15 dB or greater. However, one may still question whether 100% on a speech intelligibility test represents truly optimum conditions. In these tests, the conditions that lead to 100% intelligibility do not usually correspond to relaxed listening. Typically, listeners are straining to understand the test words. To solve this problem, Sato [7] has proposed using subjective ratings of the ‘Difficulty’ of listening to speech. Figure 2 compares intelligibility and difficulty ratings of the same test conditions. For S/N values greater than 0, intelligibility scores gradually increase to close to 100% intelligibility. Over the same S/N range, difficulty ratings change quite dramatically indicating that listeners noticed very large changes in conditions even though they were always able (with some considerable strain) to understand the test words.
-10 0 10 20 0 20 40 60 80 100 S/N, dBA Intell igibi li ty , % 100 80 60 40 20 0 D iff ic u lty , %
Figure 2. Comparison of speech intelligibility scores (filled triangles) and difficulty ratings (open circles) versus A-weighted S/N ratio in simulated sound fields [7].
To maximise S/N ratios in classrooms, one should first attempt to minimise ambient noise levels. A recent review of classroom acoustics issues [8] found noise levels measured in classrooms to vary from 42 to 65 dBA and to even higher levels in day care facilities for pre-school children. Figure 3 shows the previously published results from a large number of studies plotted versus the school year of the students. There is a clear trend that classrooms with younger children tend to be noisier. Although these were described as ambient levels when the teacher was not talking, the details of the measurements, and of the actual activities in the classroom at the time of the measurements are not always clear. However, all of these results indicate noise levels greater than recommended in a recently published ANSI standard for classroom acoustics [9].
To determine S/N ratios, it is also necessary to know how loud are the speech sounds of teachers in classrooms. Figure 4 plots the results from a number of previous studies showing how teachers’ voice levels vary with the age of the students. On average, teachers seem to talk more loudly in classes of younger students. This is probably an example of the Lombard effect [10], which refers to our natural tendency to raise our voices in noisier conditions. Teacher’s voice levels, as measured in the classrooms, varied between 50 and 70 dBA. The difference between the average trend of ambient noise levels and that for speech levels, indicates that on average S/N ratios of about +5 dB are common. The ideal goal of a +15 dB S/N ratio seems to be rarely, if ever, achieved.
0 1 2 3 4 5 6 7 8 9 10 11 12 13 30 40 50 60 70 80 Speech University High School Elementary Day-care Le vel , dB A School Year
Figure 4. Speech levels of teachers measured in classrooms from various previous studies [8].
0 1 2 3 4 5 6 7 8 9 10 11 12 13 20 40 60 80 University High School Elementary Day-care N o ise Le vel, dBA School Year
Figure 3. Ambient noise levels reported in previous studies of classroom conditions [8].
Noise
It is quite difficult to get accurate measurements of both speech and noise levels in classrooms. To be accurate indicators of speech intelligibility test scores, they should both be representative of the conditions during the speech test. Frequently, the measured speech levels may include the influence of ambient noise and ambient noise measurements may not be representative of the conditions during speech communication. It has been proposed that more representative speech and noise levels may be obtained from analyses of statistical distributions of speech and noise levels [11]. Figure 5 illustrates an example of such an analysis for the average of measurements at four positions for a female teacher in a high school classroom. By fitting two normal distributions to the measured data, one can explain the measured results as due to the combination of ambient noise and speech components.
20 30 40 50 60 70 80 0 50 100 150 200 250 300 350 Noise Mean 46.0 dBA Leq 47.8 dBA Speech Mean 56.5 dBA Leq 58.2 dBA Freq uency of o c curence SPL, dBA
Figure 5. Example of fitting separate normal distributions to explain the individual effects of speech and noise on the recorded sounds.
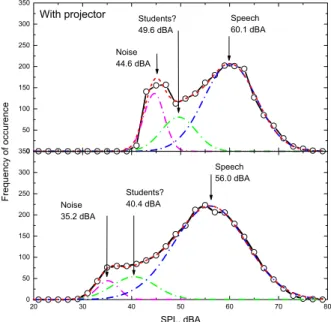
Figure 6 further illustrates the use of this technique. In this case measurements were average results from a classroom in which a male teacher was talking. The results in the upper panel of the figure correspond to when he was using an overhead projector with a noisy fan, and in the lower panel to when the projector had been turned off. Turning the projector on is seen to increase the mean noise level from 35 to 45 dBA. However, at the same time the teacher’s voice level increases from 56 to 60 dBA. This is presumably another example of the Lombard effect [10] and the teacher naturally talked louder to overcome the masking of the projector noise. In these examples, three
different normal distributions were fitted to the measured data. Clearly, this technique can accurately separate speech and noise components and could provide us with more representative data and a more complete understanding of speech and noise sounds in classrooms.
20 30 40 50 60 70 80 0 50 100 150 200 250 300 350 Noise 35.2 dBA Students? 40.4 dBA Speech 56.0 dBA Freque ncy of o c c u renc e SPL, dBA 0 50 100 150 200 250 300 350
With projector Speech
60.1 dBA Students?
49.6 dBA Noise 44.6 dBA
Figure 6. Example of fitting separate normal distributions to explain the individual effects of speech and noise on the recorded sounds. Upper panel: when overhead projector was in use, lower panel projector off.
This process was evaluated as a means of estimating the speech levels of 10 teachers in a mix of elementary and high school classrooms. These are compared with more extensive data by Pearson et al. [12] in Figure 7. The left half of the graph is for male teachers and the right side for females. For each gender of teacher, the left hand bar is the measured mean levels and the right hand bar the estimated level at a distance of 1 m in a free field. Although the amount of new data is quite limited, they suggest that these teachers used quite strong voice levels corresponding to between Pearson’s ‘Raised’ and ‘Loud’ categories. Since these teachers’ speech levels are higher than are often assumed, speech intelligibility in their classrooms would be higher than might have been predicted. On the other hand, the teachers may be more likely to experience voice impairment. There seems to be very little information relating the level of speech a talker uses to the likelihood of voice impairment.
Measured @ 1 m 30 40 50 60 70 80 Normal Raised Loud Leq , d B A Males Measured @ 1 m Loud Raised Normal Females
Figure 7. Comparison of measured A-weighted speech levels with the mean values for various levels of vocal effort by Pearson et al.[12] (shown by horizontal dashed lines and labelled ‘Normal’, ‘Raised’ and ‘Loud’).
A number of particular groups of listeners are thought to have special needs and may require a S/N of greater than +15 dB to achieve 100% intelligibility. These groups would, of course, include listeners with even a modest amount of hearing impairment, but also very young and very old listeners, as well as second language listeners. A number of studies have suggested that younger children need quieter ambient noise levels to achieve the better S/N ratios they are thought to require [8,13,14]. Figure 8 shows an estimate of the expected intelligibility versus S/N ratio relationship for 6 year olds compared to the mean trend of measured results for 13 year-olds. The curve for 6 year-olds is approximately the same as for the 13 year-olds but shifted approximately 10 dB to the right. This suggests that 6 year-olds would require 10 dB greater S/N ratios, and hence 10 dB lower ambient noise levels to
achieve the same high intelligibility scores as the older children. The upper axis of Figure 8 gives related ambient noise levels derived with an assumed teacher voice level of 55 dBA at 1 m. These results are only an estimate but work has started to try to experimentally verify these results [15].
-20 -10 0 10 20 30 40 60 80 100 70 60 50 40 30 20 6 year olds In te lli gi bil ity , % Signal/Noise, dBA 13 year olds
Figure 8. The mean speech intelligibility versus S/N for classroom measurements of 13 year-olds [2] compared with an estimate of the expected relationship for 6 year-olds[8].
ROOM ACOUSTICS
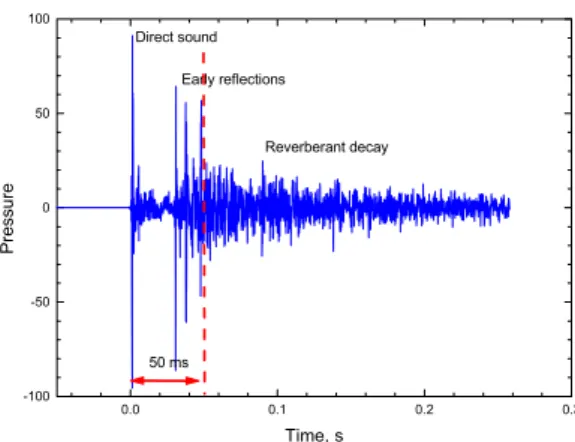
Although we usually characterise room acoustics in terms of reverberation time, there is much more detail to be considered to understand how rooms influence speech perception. In a room, listeners hear the direct sound of the talker followed by many delayed reflections of the speech. This can be seen in measurements of room impulse responses as shown in Figure 9. This shows the direct sound followed by several distinct early reflections and many later-arriving reflections or reverberant sound. Although we typically hear the combined effect of many thousands of reflections, all reflections are not equal, and they do not all affect us in the same way. Early-arriving reflections within about 50 ms after the direct sound are particularly important because our hearing system integrates them with the direct sound making it seem louder. Thus increased early-reflection energy is expected to increase intelligibility. Later-arriving speech sounds are not integrated and cause one speech sound to blur into the next, decreasing intelligibility.
Although the importance of early-arriving reflections is not widely appreciated, it is not a new concept and Joseph Henry explained the key points in the 1850s [16]. By conducting simple experiments in which he listened to hand claps at various distances from a large reflecting wall outdoors, he determined that early reflections were only separately identifiable if they arrived more than about 50 ms after the direct sound. He also went on to design rooms for speech that shaped the room to make the most use of early-reflection energy. As he said in quaint nineteenth century English, we can use early reflections to “husband every articulation of the voice”. Somehow this information seems to have been lost for nearly 100 years and we now usually attribute our understanding of the importance of early reflections for speech in rooms, to Haas and we refer to the Haas Effect [17]. In practice a number of publications indicate a good understanding of the effects of early reflections before Haas’ work [18]. In 1935 Aigner and Strutt [19] published a remarkable paper essentially proposing the useful-to-detrimental sound ratio concept that was later re-invented by Lochner and Burger in the 1960s [20]. (Useful-to-detrimental sound ratios will be discussed in the section below).
Figure 10 below includes the results of several studies that showed how our hearing system integrates early-arriving reflections with the direct sound. Reflections delayed by 10 to 20 ms can be as much as 10 dB greater than the direct sound and still be perceived as no more than equal to the direct sound. (This phenomenon allows us to design sound reinforcement systems to boost levels but still preserve realism for the direction of the natural sound source). Perhaps one of the reasons why the benefits of early-arriving reflections are not widely appreciated may be that much of the early work focussed on when they become disturbing rather than on when they are beneficial. For example, Haas examined how the disturbance caused by early reflections varied with speech rate, reflection level, tone quality, and reverberation time. However, in typical rooms reflections arriving within about 50 ms after the direct sound will usually all be beneficial.
0.0 0.1 0.2 0.3 -100 -50 0 50 100 50 ms Reverberant decay Early reflections Direct sound P ressur e Time, s
Figure 9. Example of room impulse response showing the direct sound, early reflections and later-arriving reflections. 0 20 40 60 80 100 -15 -10 -5 0 5 10 15
Lochner & Burger speech 50 dB speech 25 dB Haas, speech Threshold (Schodder) Le ve l re di rec t s o u nd, dB Reflection delay, ms
Figure 10. Curves of subjective equality between direct and reflected sound (upper curves) and the threshold of detectability of an early reflection (lower curve), from results of Haas, Schodder and Lochner and Burger.
The concept that the ratio of early-arriving to late-arriving speech sounds would relate to speech intelligibility developed from work by Thiele who proposed the Deutlicheit measure [21]. Figure 11 summarises several room acoustics measures that can be calculated from measured or predicted impulse responses. They all build on our understanding of the different perceived effects of early-arriving and later-arriving speech sounds in rooms. They are also usually very highly correlated with each other. Some have been used to relate to the perceived ‘clarity’ of musical sounds in rooms. Figure 12 shows three comparisons of room acoustics measures. These include C50, C80, TS and STI. The Speech Transmission Index (STI) will be discussed in the next section but in this figure STI values only include the effects of room acoustics and not of speech and noise levels.
Figure 11. Definitions of room acoustics measures intended to relate to perceived clarity and the intelligibility of
speech sounds. (C50 and C80 are early-to-late sound ratios with 50 and 80 ms early time intervals, R = -C50, and TS is the Centre Time).
Deutlichkeit Running Clarity Centre Time Liveness (Thiele, 1953) (Schultz, 1965) (Reichardt, 1975) (Kürer, 1973) p (t) dt2 p (t) dt2 0 0 oo oo TS = t. . . p (t) dt2 p (t) dt2 50 50 0 oo . . R =10 log. D = p (t) dt2 p (t) dt2 50 0 oo . . 0 . . 80 0 80 oo p (t) dt2 p (t) dt2 . C80 =10 log
-10 -5 0 5 10 0.0 0.1 0.2 0.3 TS, s C80, dB -10 -5 0 5 10 -4 -2 0 2 4 C80, dB C 50, dB -10 -5 0 5 10 0.2 0.4 0.6 0.8 C80, dB ST I
Figure 12. Illustrations of the strong relationships between several pairs of the measures intended to relate to the intelligibility of speech and to the clarity of music.
Recent experiments were used to directly show the benefit of early reflections on speech intelligibility scores [22]. Varied acoustical conditions were simulated using an 8-channel electro-acoustic system in an anechoic room as illustrated in Figure 13. Each loudspeaker reproduced one early reflection followed by a reverberant decay starting at approximately 50 ms after the direct sound. The direct sound (first arriving sound) was produced by the loudspeaker directly in front of the listener. Figure 14 illustrates the impulse response of a simulated sound field including a direct sound, early reflections and reverberant or later-arriving reflections. Subjects listened to speech sounds with various combinations of direct sound with early and late reflections combined with a typical ambient noise spectrum (NC40 spectrum at 47 dBA).
Figure 13. Photograph of the loudspeakers of the room acoustics simulator in the anechoic room.
Sound fields were first created with only a direct sound that was varied in amplitude relative to the fixed background noise. As would be expected, for these cases intelligibility scores increased with increasing S/N ratio. The effective speech levels were then varied by adding increasing amounts of early reflection energy to a fixed direct sound component. The results, found in Figure 15, showed that adding early-reflection energy has the same effect on intelligibility scores as increasing the direct sound level.
0.00 0.05 0.10 0.15 0.20 -150 -100 -50 0 50 100 150 direct late early R e la ti ve pr ess u re TIme, s
Figure 14. Example of measured simulated impulse response including direct sound, early reflections and reverberant or later-arriving reflections.
-8 -6 -4 -2 0 2 4 6 50 60 70 80 90 100 Direct only Direct+early In te ll ig ib il it y , % S/N(A), dB
Figure 15. Comparison of mean speech intelligibility scores for sound fields with only varied direct sound levels with those with a fixed direct sound and varied early-reflection levels.
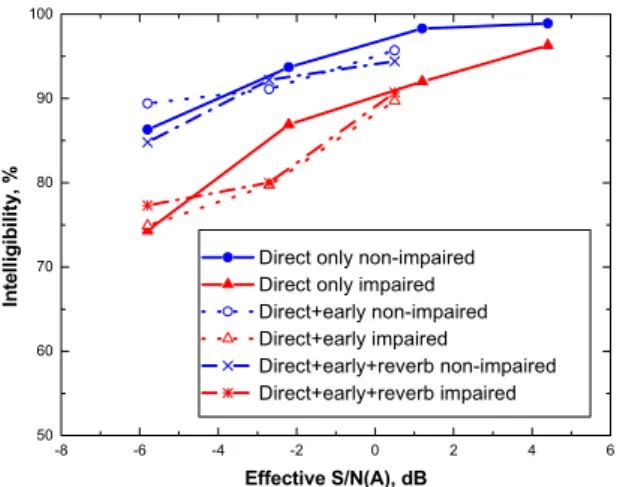
Some have argued that although early reflections are beneficial to listeners with normal hearing, they do not help impaired listeners. The subjects chosen for these tests included a number of middle aged listeners with some moderate hearing impairment. (None wore hearing aids and most were not even aware of their hearing impairment). The results were then separated into two groups according to their hearing sensitivity. One group consisted of mostly university students and younger adults who had near-perfect hearing, while the second group were more typically middle aged with some mild to moderate hearing loss. The separate results for the two groups of subjects seen in Figure 16 showed that their hearing sensitivity had a large effect on their intelligibility scores. However both groups benefited from early reflections and for both groups, added early-reflection energy was equally beneficial to a similar increase in the level of the direct sound. The third set of results in Figure 16 shows that the same statistically significant pattern of results is maintained, when the simulated sound fields included reverberant decays.
These results directly show the beneficial effects of early-arriving speech reflections on speech intelligibility scores for both groups of listeners. One can estimate from these results that these quite moderately impaired listeners would require approximately a 5 dB greater S/N to perform as well as the non-impaired group. Further experiments showed that early reflections would be critical to understanding speech in special situations such as when the talker turns away from a particular listener and at more distant listening positions in rooms. The added later-arriving reflections had very small effects because they were relatively unimportant compared to the simulated ambient noise as will be explained in the next section on combined measures.
-8 -6 -4 -2 0 2 4 6 50 60 70 80 90 100
Direct only non-impaired Direct only impaired Direct+early non-impaired Direct+early impaired Direct+early+reverb non-impaired Direct+early+reverb impaired In te llig ib ility , % Effective S/N(A), dB
Figure 16. Comparison of mean speech intelligibility scores for three types of sound fields: direct sound only, fixed direct sound with varied early-reflection levels and fixed direct sound and reverberant sound with varied early-reflections levels. ‘Effective’ speech levels are the combined level of the direct and early-reflection speech energy. Results are given separately for hearing impaired and non-impaired listener groups.
Having demonstrated that increased early-reflection energy is important for good intelligibility, the amount of early-reflection energy in real rooms was investigated. This was assessed by calculating the Early Reflection Benefit (ERB) as the total energy in the first 50 ms of the impulse response relative to that in the direct sound. ERB
values were calculated from the sound strength or relative sound levels calculated for the first 10 ms (G10) to represent the direct sound energy and the first 50 ms (G50) to represent the direct and early-reflection sound energy. That is,
ERB = G50-G10, dB
Calculation of the ERB values averaged over the octave bands from 1 to 4 kHz showed ERB values varied from 1 or 2 dB, for positions close to the source, to as much as 9 dB at larger distances in rooms. Figure 17 plots ERB values versus source-receiver distance from measurements in a boardroom about the same total size as a classroom. In this particular room ERB values increased from 2 to 8 dB at more distant listening positions. Similar results were found in other rooms. Early reflections provide the most help at positions more distant from the source and the benefit of having early reflections was found to vary up to 9 dB. This is larger than in the subjective experiments described above, where in the most extreme case, early reflections increased the effective speech levels by only 6 dB. Thus in actual rooms the benefit from early reflection is quite substantial and at more distant positions it is often only possible to understand speech because the early-reflection energy significantly increases the effective speech levels. 0 2 4 6 8 10 0 2 4 6 8 10 ERB , dB Distance, m
Figure 17 Measured Early Reflection Benefit (ERB), averaged over the octave bands 1-4 kHz, versus source-receiver distance in a boardroom.
Figure 18. Model lecture theatre used to demonstrate an acoustical design to maximise the energy of early reflections without excessive late-arriving or reverberant energy. Only the shaded area was treated with absorbing material for the ‘optimised’ case.
1 2 3 4 5 6 7 8 Receiving Points Sound Source (Human Voice Directivity) Absorption
Treatment Area
1 1
Having determined that there is significant energy in early reflections in typical rooms, some simple experiments were conducted with a room acoustics computer model (ODEON) to see if rooms could be designed to maximise the early-reflection energy. Figure 18 illustrates the model of a lecture theatre that was used. The absorption of all surfaces were either the same or the shaded areas were made more absorptive to control later arriving reflections without reducing important early-arriving reflections. Figure 19 plots the calculated ERB values for 3 different
treatments of this room: ‘live’, ‘dead’ and ‘optimised’. For the ‘live’ case all surfaces were quite reflective (alpha = 0.03) and the reverberation time was 1.9 s. For the ‘dead’ case the wall absorption coefficients were set to 0.6 and the reverberation time was 0.34 s. For the ‘optimised’ case the treated parts of the walls (shaded parts) were given an absorption coefficient of 0.6 and the non-treated areas left as for the live case. The reverberation time for the optimised case was 1.1 s. Figure 18 shows that changing the room from live to dead reduced the ERB values as much as 4 dB. This would have a significant negative effect on intelligibility. However, for the optimised case, ERB values changed very little relative to the live case but the reverberation time was significantly reduced. Although this is only a simple example, it demonstrates that it is possible to maximise early-reflection energy without excessive late-arriving or reverberant energy by appropriate acoustical design.
0 1 2 3 4 5 6 7 8 9 0 2 4 6 8 10 12 14
Distance from sound source, m
ERB, dB
Live Dead Optimized
Figure 19. Calculated ERB values versus source-receiver distance in the model lecture theatre for three acoustical treatment conditions .
COMBINED MEASURES
Some acoustical measures have been developed that combine the effects of S/N ratios and room acoustics into a single quantity and hence can more completely assess conditions in rooms for speech such as classrooms. Lochner and Burger developed the concept of useful-to-detrimental sound ratios [20], where ‘useful’ is the combination of the direct and early-reflected sound and ‘detrimental’ is the sum of the late-arriving speech sounds plus the ambient noise. Their work used extensive experiments of how our hearing system integrates the effects of various early reflections that were developed from the earlier work of Haas. They produced quite complex weighting functions illustrating how the importance of particular early reflections depended on their delay after the direct sound and their amplitude relative to that of the direct sound. Latham [23] successfully tested this concept in a number of theatres. It was later shown [1,2] that useful-to-detrimental ratios based on a simple un-weighted summation of the direct and early energies were equally successful in tests in a variety of rooms. U50 is one such useful-to-detrimental ratio where early-reflection energy is summed over the first 50 ms.
dB E E E E U n l e d , log 10 50 + + =
Here Ed is the direct sound energy and Ee is the early-arriving sound energy in the first 50 ms after the direct sound.
El is the late-arriving speech sound energy and En is the ambient noise energy. Figure 20 illustrates that U50 values
relate well to speech intelligibility scores for these results from simulated sound fields designed to systematically vary both S/N and room acoustics conditions [24].
The definition of U50 above indicates that speech intelligibility scores are expected to increase with increasing direct sound or increasing early-reflection energy. However, the magnitude of the increase will also depend on the sum of El+En in the denominator, because it is the relative change that is important. Also in some conditions such
as at the rear of many rooms, the early-reflection energy, Ee will be much greater than the direct sound energy, Ed,
and hence intelligibility will not be greatly influenced by Ed. Increasing late-arriving speech energy, El, or
increasing ambient noise energy, En, would both be expected to decrease intelligibility. However, if one is much
El. For such conditions varying the reverberation time and hence the amount of late-arriving energy will typically
have little effect because El is always much smaller than En. This explains why the negative effects of reverberation
become more obvious in quieter rooms. It also explains why adding reverberation to conditions illustrated in Figure 16 did not reduce intelligibility scores. Because the added late energy was much smaller in magnitude than the ambient noise energy, measured U50 values did not change much due to the addition of late or reverberant energy and hence intelligibility scores would also not change.
-15 -10 -5 0 5 10 60 70 80 90 100 S p e e c h In te lli g ib lit y , % U50a(1-4k), dB
Figure 20. Relationship between speech intelligibility scores and U50 values in simulated sound fields designed to systematically vary both S/N and room acoustics conditions [24].
The combined effects of varied S/N and varied room acoustics are further illustrated in the experimental results of Figure 21. Subjects performed speech intelligibility tests for the 16 combinations of four S/N ratios (-5, 0, +5, and +10 dB) and four values of C50 (-3, +1, +5, and +9 dB). Each S/N condition corresponds to constant ambient noise and to constant overall speech level. As you move to the right on each line, towards increasing C50 values, a greater portion of the total energy is ‘useful’ (i.e. direct + early). For the quietest conditions, varying C50 has little effect because in all cases the ‘useful’ sound energy is much greater than the ‘detrimental’ component. However, for the noisiest conditions (S/N = -5 dB) varying C50 had a greater effect because increasing C50 corresponded to a greater portion of the speech energy being ‘useful’ and hence the ‘effective’ speech level increased.
The Speech Transmission Index (STI) is a more recent measure that combines both room acoustics and S/N aspects into a single measure. It is based on the presumption that both room acoustics and noise degrade the natural amplitude modulations of speech and hence lead to reduced speech intelligibility. STI values are determined from modulation transfer functions and are calculated from a complete matrix of values at combinations of acoustical frequencies and speech modulation frequencies. Although the STI measure is quite complex and appears to be very different than the useful-to-detrimental sound ratio, the two measures are actually very closely related. Figure 22 shows that measured STI values are very strongly related to measured U50 values over a very wide range of conditions [25]. Thus both of these combined-effects measures seem to assess more-or-less the same characteristics. -5 0 5 10 50 60 70 80 90 100 U50a(A) -5 0 +5 +10 S/N, dB S p e e c h I n te lli g ib ilit y , % C50, dB
-30 -20 -10 0 10 20 0.0 0.2 0.4 0.6 0.8 1.0 R2 = 0.977, SD=0.040 ST I+ N U50(A), dB
Figure 22. Plot of measured STI values versus the corresponding U50 values for 819 different conditions [25].
CRITERIA AND DESIGN
Criteria for good acoustical conditions in rooms such as classrooms have traditionally been given in terms of a maximum ambient noise level (to ensure an adequate signal-to-noise ratio) and an optimum reverberation time that would relate to maximising early-reflection energy. Table 1 below illustrates simple approaches to estimating maximum acceptable ambient noise levels.
#1 #2
Speech source level @ 1 m 60 dBA 55 dBA
Required S/N -15 -15
Room effect -5 -5
Extra for 0% difficulty or special needs groups
-5 0
Maximum noise level 35 dBA 35 dBA
Table 1. Two example estimates of maximum acceptable ambient noise levels.
For example # 1 in Table 1, the speech source level at 1 m from the talker is assumed to be 60 dBA. The required S/N ratio is 15 dB and the reduction in effective speech levels to more distant parts of the room is estimated to be 5 dB. Finally a further 5 dB is included to bring conditions to those required for more relaxed listening conditions, corresponding to a 0% difficulty rating or alternatively to meet the needs of various special needs groups. The end result is an estimated maximum ambient noise level of 35 dBA. Example #2 assumes a lower speech source level of 55 dBA, which corresponds to the average ‘normal’ voice level for females from Pearson’s data [12]. Clearly 35 dBA would correspond to an ideal goal. The assumption of speech source levels of 55 or 60 dBA can be questioned and the results in Figure 4 indicate louder teacher voice levels occur quite frequently. Although they may frequently occur, they may not be ideal. Voice impairment is a common problem for teachers [26] and one must assume that this is related to having to talk too loudly for long periods of time. To date, there seems to be no information to indicate safe voice levels for teachers. Similarly one can now only make very rough estimates of the extra S/N required by various special needs groups. An extra 5 dB of S/N is often suggested and would correspond to that required for the impaired listeners in Figure 16. Thus the details of the estimates to derive acceptable ambient noise criteria must vary to meet specific needs.
The required overall philosophy for the acoustical design is clear. One should first focus on reducing noise below the required maximum ambient noise level. Ambient noise is a potentially much bigger problem than inappropriate room acoustics. Ambient noise levels can easily be greater than desired by a factor of 10 or more but reverberation time is very unlikely to be too large by a factor of 10. The results in Figure 21 show that realistic variations in S/N have a much greater influence on intelligibility scores than a wide range of room acoustics conditions.
Having achieved an acceptably low ambient noise level, the second step is to design the room acoustics to
about 0.5 s or slightly larger. More appropriately one could design to maximise early-reflection energy without excessive later-arriving speech energy by using room acoustics modelling software.
In choosing an optimum reverberation time we are trying to create conditions that maximise the ‘useful’
components of the speech sounds relative to the ‘detrimental’ components. The useful-to-detrimental ratio concept implies that there are a range of combinations of ambient noise levels and reverberation times that could lead to equal intelligibility conditions. This is illustrated in the equal U50 contours of Figure 23, which are labelled in terms of their equivalent mean intelligibility score on a simple word intelligibility test [27]. These contours have a maximum and clearly one can have either too much or too little reverberation at a particular ambient noise level. A point labelled ‘Normal use’ corresponds to a maximum ambient noise level of 35 dBA and a reverberation time of 0.7 seconds. Other points on the same contour should lead to the same speech intelligibility but may be more costly to achieve. For example, the combination of an ambient noise level of about 37 dBA and a reverberation time of 0.5 s should be equally successful. However, it would require the addition of a significantly larger amount of sound absorbing material and could therefore be more costly.
0.0 0.5 1.0 1.5 2.0 25 30 35 40 45 Special needs Normal use 100% 99% 97% 95% Ambient noise level, dBA Reverberation time, s
Figure 23. Equal U50 contours for a 300 m3 classroom showing the trade-off between ambient noise level and
reverberation time for constant intelligibility conditions. (U50 contours are labelled in terms of the related mean intelligibility score) [27].
0 0.5 1 1.5 2 2.5 3 3.5 4 4.5 5 5.5 6 125 250 500 1000 2000 4000 Frequency, Hz RT , s Measured Sabine Eyring Cremer Cremer-D Kuttruff Fitzroy Arau
Figure 24. Comparison of measured and predicted reverberation times for a small classroom sized-room with 50% coverage of the ceiling with sound absorbing material [28].
One must still be aware that there will be problems achieving desired design goals in classrooms. Recently
published experiments [28,29] examined the errors in predicting the effects of adding various absorptive treatments to a room of the size of a small classroom. All of the materials were carefully measured, but accurate predictions of the resulting reverberation times and other room acoustic measures were very inaccurate. Figure 24 compares measured and predicted reverberation times using seven different reverberation time equations. This configuration corresponded to a 50% coverage of the ceiling with sound absorbing material. Even for this simple case, errors can be quite large. Figure 25 shows the prediction errors averaged over 6 octave bands for each of the 7 prediction equations and for the 9 different absorptive treatments. A 10% error was assumed to be a desirable design goal as it would correspond to the smallest difference that would be noticeable under every day conditions. Almost all of the
average prediction errors were much bigger than 10% and it was not possible to accurately predict measured reverberation times even in a controlled experiment.
1 1 0 1 0 0 1 0 0 0 0 2 5 5 0 7 5 1 0 0 H R H S E W P W P F R e la tiv e E rro r (%) S a b in e E y r in g M illin g t o n C r e m e r K u t t r u f f F it z r o y A r a u P . 1 0 % e r r o r
Figure 25. Average (over frequency) relative errors for predictions of reverberation time for 10 different conditions of the small classroom including ‘0’ the no treatment case [28].
Similarly Figure 26 shows that predictions of speech levels L(A), of C50 values and STI values frequently resulted in prediction errors much greater than one just-notice-difference (JND) in these quantities. The predictions include analytical calculations as well as the results of two different room acoustics computer models. The cause of these large errors is not certain, but may at least partially be due to differences in diffusion. Clearly one should not expect to precisely achieve design goals in actual classrooms.
0 25 50 75 100 HR HS EW PW PF 0 1 2 3 4 5 STI R e lati v e erro r Configuration 0 25 50 75 100 HR HS EW PW PF Configuration C50(A) Configuration 0 25 50 75 100 HR HS EW PW PF Ls(A) Analytical RaySpec. RayDiff. Odeon
Figure 26. Average (over frequency) relative errors (re 1 JND) for predictions of speech level L(A), C50 and STI for 10 different conditions of the small classroom [29].
CONCLUSIONS
Although there are a number of unresolved details, we know enough to specify ‘reasonably’ acceptable acoustical conditions for classrooms. In doing this, we must be aware that controlling ambient noise levels to achieve acceptable speech-to-noise ratios is most important. Obtaining a desired optimum reverberation time is usually of secondary importance and we should realise that reverberation time is an indirect measure of what we really want to know. To maximise the benefits of early reflections of speech sounds, it is necessary to choose an optimum reverberation time that is neither too short nor too long.
To be more precise about setting criteria for ideal acoustical conditions in classrooms we need to know a little more about teachers’ voice levels and the needs of various special groups of listeners. We need to determine maximum safe voice levels for teachers that will minimise their risk of voice impairment while still providing adequate speech intelligibility for listeners. We also need much more detailed information on the particular needs of various special groups of listeners such as younger children. Some suggestions such as the 25 dBA maximum ambient noise level determined from Figure 8 seem impractical and may not be necessary. We also must decide whether a condition corresponding to 100% speech intelligibility is good enough or whether better conditions are required to obtained the same result in relaxed listening conditions.
In designing rooms for speech we need to explore the benefits of doing this directly in terms maximising early-reflection energy. Modern room acoustics computer models now make this a feasible option.
REFERENCES
[1] Bradley J.S., “Predictors of Speech Intelligibility in Rooms”, J. Acoust. Soc. Am., Vol. 80, No. 3, 837_845, (1986). [2] Bradley J.S., “Speech Intelligibility Studies in Classrooms”, J. Acoust. Soc. Am., Vol. 80, No. 3, 846-854, (1986). [3] Houtgast, T., “The Effect of Ambient Noise on Speech Intelligibility in Classrooms”, App. Acoust. 14, 15-25 (1981).
[4] French, N.R. and Steinberg, J.C., “Factors Governing the Intelligibility of Speech Sounds”, J. Acoust. Soc. Am., 19(1) 90-119 (1947). [5] ANSI S3.5-1969, “Methods for the Calculation of the Articulation Index”, American National Standard, Standards Secretariat, Acoustical
Society of America, New York, USA.
[6] ANSI S3.5-1997, “Methods for Calculation of the Speech Intelligibility Index”, American National Standard, Standards Secretariat, Acoustical Society of America, New York, USA.
[7] Sato, H., Bradley, J.S. and Morimoto, M., “Effect of Early Reflections on Difficulty of Listening to Speech in Noise and Reverberation”, Canadian Acoustics 30 (3), (2002).
[8] Picard, M. and Bradley, J.S., “Revisiting Speech Interference and Remedial Solutions in Classrooms”, Audiology, Journal of Auditory Communication, vol. 40, no. 5, pp. 221-244, (2001).
[9] ANSI S12, “Acoustical Performance Criteria, Design Requirements, and Guidelines for Schools”, (2002),
[10] Junqua JC., “The Lombard reflex and its role on human listeners and automatic speech recognizers”, J. Acoust. Soc. Am. 93, 2145-146 (1993).
[11] Hodgson, Rempel and Kennedy, “Hodgson M, Rempel R, Kennedy S. “Measurement and prediction of typical speech and background-noise levels in university classrooms during lectures”, J. Acoust. Soc. Am. 105(1) 226-233 (1999).
[12] Olsen, W.O., “Average Speech Levels and Spectra in Various Speaking/Listening Conditions: A Summary of the Pearson, Bennett, and Fidell (1977) Report”, American Journal of Audiology, vol. 7, 1- (1998).
[13] Elliot, L.L., “Effects of Noise on Perception of Speech by Children and Certain Handicapped Individuals”, Sound and Vibration 16, 10-14 (1982).
[14] Nabelek, A.K. and Robinson, P.K., “Monaural and Binaural Speech Perception in Reverberation for Listeners of Various Ages”, J. Acoust. Soc. Am., 71, 1242-1248, (1982).
[15] “Speech Recognition in Classrooms” at CLLRnet website, http://www.cllrnet.ca/en/index.php.
[16] R.S. Shankland, “Architectural acoustics in America to 1930”, J. Acoust. Soc. Am., 61 (2) 250-254 (1977). [17] H. Haas, “Uber den Einfluss des Einfachechos auf die Horsamkeit von Sprache”, Acustica 1, 49-58 (1951). [18] R.D. Fay and W.M. Hall, “Historical notes on the Hass effect”, J. Acoust. Soc. Am., 28, 131-132 (1956).
[19] F. Aigner and M.J.O. Strutt, “On the physiological effect of several sources of sound on the ear and its consequences in architectural acoustics”, J. Acoust. Soc. Am., 6, 155-159 (1935).
[20] J.P.A. Lochner and J.F Burger, “The influence of reflections on auditorium acoustics”. J. Sound Vibr. 1 (4) 426-454 (1964). [21] R. Thiele, “Richtungsverteilungs und Zeitfolge der Schallruckewurfe in Raumen”, Acustrica 3, 291-302 (1953).
[22] Bradley, J.S. and Sato, H., “The Importance of Early Reflections for Speech Intelligibility in Rooms”, J. Acoust. Soc. Am., 111 (5) Pt. 2, p. 2411, (2002).
[23] Latham, H.G., “The Signal-to-Noise Ratio for Speech Intelligibility-An Auditorium Acoustics Design Index”, App. Acoust., 12, 253-320 (1979).
[24] Bradley, J.S., Reich, R.D. and Norcross, S.G., “On the Combined Effects of Signal-to-Noise Ratio and Room Acoustics on Speech Intelligibility”, J. Acoust. Soc. Am. Vol. 106, No. 4, pp. 1820-1828, (1999).
[25] Bradley, J.S., "Relationships Among Measures of Speech Intelligibility in Rooms", J. Aud Eng. Soc., Vol. 46, No. 5, pp. 396-405 (1998).
[26] Urrutikoetxea, A., Ispizua, A., and Matellanes, F., “Vocal pathology in teachers: a video-laryngostroboscopic study of 1,046 teachers”, Revue de Laryngologie, Otologie, Rhinologie 116: 255-262, 1995.
[27] Bradley, J.S., “Acoustical Design of Rooms for Speech”, Construction Technology Update, NRC Ottawa, (51), pp. 6, (2002).
[28] Bistafa, S.R. and Bradley, J.S., “Predicting Reverberation Times in a Simulated Classroom”, J. Acoust. Soc. Am. Vol. 108, No. 4, pp. 1721-1731, (2000).
[29] Bistafa, S.R. and Bradley, J.S., “Predicting Speech Metrics in a Simulated Classroom with Varied Sound Absorption”, J. Acoust. Soc. Am. Vol. 109, No. 4, pp. 1474-1482, (2001).
![Figure 1. Speech intelligibility test results versus A-weighted S/N ratios for measurements in a wide range of rooms [1,2]](https://thumb-eu.123doks.com/thumbv2/123doknet/14197507.479345/4.892.313.619.173.406/figure-speech-intelligibility-results-versus-weighted-ratios-measurements.webp)
![Figure 4. Speech levels of teachers measured in classrooms from various previous studies [8]](https://thumb-eu.123doks.com/thumbv2/123doknet/14197507.479345/5.892.304.632.736.970/figure-speech-teachers-measured-classrooms-various-previous-studies.webp)
![Figure 8. The mean speech intelligibility versus S/N for classroom measurements of 13 year-olds [2]](https://thumb-eu.123doks.com/thumbv2/123doknet/14197507.479345/7.892.317.637.169.412/figure-mean-speech-intelligibility-versus-classroom-measurements-year.webp)