Publisher’s version / Version de l'éditeur:
Vous avez des questions? Nous pouvons vous aider. Pour communiquer directement avec un auteur, consultez la première page de la revue dans laquelle son article a été publié afin de trouver ses coordonnées. Si vous n’arrivez pas à les repérer, communiquez avec nous à [email protected]. Questions? Contact the NRC Publications Archive team at
[email protected]. If you wish to email the authors directly, please see the first page of the publication for their contact information.
https://publications-cnrc.canada.ca/fra/droits
L’accès à ce site Web et l’utilisation de son contenu sont assujettis aux conditions présentées dans le site LISEZ CES CONDITIONS ATTENTIVEMENT AVANT D’UTILISER CE SITE WEB.
First International Conference on Rough Sets and Knowledge Technology
(RSKT 2006) [Proceedings], 2006
READ THESE TERMS AND CONDITIONS CAREFULLY BEFORE USING THIS WEBSITE.
https://nrc-publications.canada.ca/eng/copyright
NRC Publications Archive Record / Notice des Archives des publications du CNRC :
https://nrc-publications.canada.ca/eng/view/object/?id=951fba9e-760b-4970-95b5-e82fc7497ad6
https://publications-cnrc.canada.ca/fra/voir/objet/?id=951fba9e-760b-4970-95b5-e82fc7497ad6
NRC Publications Archive
Archives des publications du CNRC
This publication could be one of several versions: author’s original, accepted manuscript or the publisher’s version. / La version de cette publication peut être l’une des suivantes : la version prépublication de l’auteur, la version acceptée du manuscrit ou la version de l’éditeur.
Access and use of this website and the material on it are subject to the Terms and Conditions set forth at
Relevant Attribute Discovery in High Dimensional Data: Application to
Breast Cancer Gene Expressions
Council Canada Institute for Information Technology de recherches Canada Institut de technologie de l'information
Relevant Attribute Discovery in High
Dimensional Data: Application to Breast
Cancer Gene Expressions *
Valdés, J., and Barton, A.
July 2006
* published at the First International Conference on Rough Sets and Knowledge Technology (RSKT 2006). Chonggin, P.R. China. July 24-26, 2006. NRC 48721.
Copyright 2006 by
National Research Council of Canada
Permission is granted to quote short excerpts and to reproduce figures and tables from this report, provided that the source of such material is fully acknowledged.
Relevant Attribute Discovery in High Dimensional Data:
Application to Breast Cancer Gene Expressions.
Julio J. Vald´es1
and Alan J. Barton1
National Research Council Canada, M50, 1200 Montreal Rd., Ottawa, ON K1A 0R6 , [email protected],
WWW home page: http://iit-iti.nrc-cnrc.gc.ca
Abstract. In many domains, the data objects are described in terms of a large number of features. The pipelined data mining approach introduced in [12] us-ing two clusterus-ing algorithms in combination with rough sets and extended with genetic programming, is investigated with the purpose of discovering important subsets of attributes in high dimensional data. Their classification ability is de-scribed in terms of both collections of rules and analytic functions obtained by genetic programming (gene expression programming). The Leader and several k-means algorithms are used as procedures for attribute set simplification of the information systems later presented to rough sets algorithms. Visual data min-ing techniques includmin-ing virtual reality were used for inspectmin-ing results. The data mining process is setup using high throughput distributed computing techniques. This approach was applied to Breast Cancer gene expression data and it led to subsets of genes with high discrimination power with respect to the decision classes.
1
Introduction
As a consequence of the information explosion and the development of sensor, obser-vation, computer and communication technologies, it is common in many domains to have data objects characterized by a large number of attributes. This situation leads to high dimensional databases in terms of the set of fields. For example, in biological gene expression experiments, the genetic content of samples of tissues are obtained with high throughput technologies (microchips) with thousands of genes being investigated. In addition, some kinds of bio-medical research involve samples described by large numbers of spectral properties (infrared, ultraviolet, etc). The common denominator in many domains is that the set of data objects has a very high dimensional nature.
A hybrid soft-computing approach for finding relevant attributes in high dimen-sional datasets based on a combination of clustering and rough sets techniques in a high throughput distributed computing environment was presented in [13]. It also uses vir-tual reality data representations to aid data analysis. The methodology was applied to Leukemia gene expression data with good results. In this paper, that methodology is ex-tended by incorporating evolutionary computation techniques (genetic programming) at a post processing stage, in order to analytically characterize the relationships between the interesting attributes emerging from the pipeline analysis and the decision classes. This extended approach is applied to Breast Cancer gene expression data.
2
Basic Concepts
2.1 Experimental Methodology
The general idea is to construct subsets of relatively similar attributes, such that a sim-plified representation of the data objects is obtained by using the corresponding attribute subset representatives (NP completeness of reduct computation –exact solution– invites the use of an approximation –clustering– when the attribute set is large). The attributes of these simplified information systems are explored from a rough set perspective [7], [8] by computing their reducts. From them, rules are learned and applied systematically to testing data subsets not involved in the learning process (Fig-1) following a cross-validation scheme, in order to better characterize the classification ability of the retained attributes. The whole procedure can be seen as a pipeline.
Fig. 1.Data processing strategy combining clustering, Rough Sets analysis and crossvalidation.
In a first step, the objects in the dataset are shuffled using a randomized approach in order to reduce the possible biases introduced within the learning process by data chunks sharing the same decision attribute. Then, the attributes of the shuffled dataset are clustered using two families of clustering procedures: i) three variants of the the leader algorithm [6] (forward, reverse and absolute best), and four variants of k-means [1] (Forgy, Jancey, convergent and MacQueen). The leader and the k-means algorithms were used with a similarity measure rather than with a distance; among the many pos-sibilities, Gower’s general coefficient was used [5].
3
Each of the formed clusters of attributes is represented by exactly one of the origi-nal data attributes. By the nature of the leader algorithm, the representative is the leader (called an l-leader), whereas for a k-means algorithm, a cluster is represented by the most similar object with respect to the centroid of the corresponding cluster (the
k-leader). As a next step, a new information system is built from the original by retaining the l-leaders (or the k-leaders). The filtered information system undergoes a segmen-tation with the purpose of learning classification rules, and testing their generaliza-tion ability in a cross-validageneraliza-tion framework. N-folds are used as training sets; where the numeric attributes present are converted into nominal attributes via a discretization process, and from them, reducts are constructed. Finally, classification rules are built from the reducts, and applied to a discretized version of the test fold (according to the cuts obtained previously), from which the generalization ability of the generated rules is evaluated. Besides the numeric descriptors associated with the application of classi-fication rules to data, the use of visual data mining techniques, like the virtual reality space representation [10] [11], enables structural understanding of the data described in terms of the selected subset of attributes and/or the rules learned from them. Each stage feeds its results to the next stage of processing, yielding a pipelined data analysis stream.
Distributed and Grid computing involves coordinating and sharing computing, ap-plication, data, storage, or network resources across dynamic and geographically dis-persed organizations. The use of grid technologies is an obvious choice for many data mining tasks within the knowledge discovery process.
Condor (http://www.cs.wisc.edu/condor/) is a specialized workload management system for compute-intensive jobs in a distributed computing environ-ment, developed at the University of Wisconsin-Madison (UW-Madison). It provides a job queueing mechanism, scheduling policy, priority scheme, resource monitoring, and resource management. All of the experiments in this paper were conducted on a Condor pool of the Institute for Information Technology, National Research Council Canada.
A visual data mining technique -virtual reality spaces- (VR-spaces) was used as an aid for data exploration and the interpretation of the datasets described in terms of the subsets of attributes resulting from the data processing pipelines. This technique extends the concept of 3D modelling to relational structures and was introduced in http://www.hybridstrategies.com [10], [11]. The construction of a VR-space requires the specification of several sets and a collection of mappings. Criteria for computing the VR space may be measures of structure preservation, maximization of class separability or combinations of several, possibly conflicting properties.
A detailed explanation about the implementation of the computational paradigm involved in the methodology in the context of a high throughput pipeline based on Condor is given in [12] [13].
2.2 Gene Expression Programming
Analytic functions are among the most important building blocks for modeling, and are a classical form of knowledge. Direct discovery of general analytic functions can be ap-proached from a computational intelligence perspective via evolutionary computation.
There are other possibilities, such as logistic regression, but they do not have as gen-eral model representation flexibility. Genetic programming techniques aim at evolving computer programs, which ultimately are functions. Among these techniques, gene ex-pression programming (GEP) is appealing [3]. It is an evolutionary algorithm as it uses populations of individuals, selects them according to fitness, and introduces genetic variation using one or more genetic operators. GEP individuals are nonlinear entities of different sizes and shapes (expression trees) encoded as strings of fixed length. For the interplay of the GEP chromosomes and the expression trees (ET), GEP uses a transla-tion system to transfer the chromosomes into expression trees and vice versa [3]. The set of genetic operators applied to GEP chromosomes always produces valid ETs.
The chromosomes in GEP itself are composed of genes structurally organized in a head and a tail [4]. The head contains symbols that represent both functions (from a function set F) and terminals (from a terminal set T), whereas the tail contains only terminals. Two different alphabets occur at different regions within a gene. For each problem, the length of the headh is chosen, whereas the length of the tail t is a function ofh and the number of arguments of the function with the largest arity.
As an example, consider a gene composed of the function set F={Q, +, −, ∗, /}, where Q represents the square root function, and the terminal set T={a, b}. Such a gene looks like (the tail is shown in bold): *Q-b++a/-bbaabaaabaab, and encodes the ET which corresponds to the mathematical equation f (a, b) =√b ·¡¡a +b
a¢ − ((a − b) + b)¢ simplified as f (a, b) = b·√b
a
GEP chromosomes are usually composed of more than one gene of equal length. For each problem the number of genes as well as the length of the head has to be cho-sen. Each gene encodes a sub-ET and the sub-ETs interact with one another forming more complex multi-subunit ETs through a connection function. To evaluate GEP chro-mosomes, different fitness functions can be used.
3
Breast Cancer Experimental Settings and Results
The breast cancer data as used in [2] was downloaded from the Gene Expression Om-nibus (GEO) (See http://www.ncbi.nlm.nih.gov/projects/geo/gds/ gds browse.cgi?gds=360) and consists of24 core biopsies taken from patients found to beresistant (greater than 25% residual tumor volume, of which there are 14 biopsies) orsensitive (less than 25% residual tumor volume, of which there are 10 biopsies) to docetaxel treatment. The number of genes (probes) placed onto (and mea-sured from) the microarray is12, 625. Therefore, the data contains two classes resistant and sensitive, with12, 625 attributes.
The experimental settings used in the investigation of the breast cancer data with the distributed pipeline [13] are reported in Table 1. A total of168 k-leader experiments were completed, each requiring the generation of86 files (for 10-fold cross-validation). For each experiment, the discretization, reduct computation and rule generation algo-rithms are those included in the Rosetta system[8].
From the series ofk-leader Breast Cancer experiments performed, those experi-ments having a mean cross-validated accuracy≥ 0.7 using the rules as applied to test
5 Table 1.The set of parameters and values used in the experiments with the Breast Cancer data set using the distributed pipeline environment.
Algorithm/Parameter Values
K-means Variant Forgy, Jancey, Convergent, MacQueen Number of Clusters 2, 5, 10, 100, 300, 500
Cross-validation 10 folds
Discretization BROrthogonalScaler, EntropyScaler,
NaiveScaler, RSESOrthogonalScaler, SemiNaiveScaler Reduct Computation JohnsonReducer, Holte1RReducer,
RSESExhaustiveReducer, RSESJohnsonReducer Rule Generation RSESRuleGenerator
folds are reported in Table-2. Experiment227 is the overall best result from those se-lected, with a mean (0.917), median (1.0), standard deviation (0.18), minimum (0.5) and maximum (1.0) 10-fold cross-validated classification accuracy. Table-2 shows that 14 of the 22 selected experimental results have a median classification accuracy of 1.0, while all selected experiments have a maximum classification accuracy of1.0 over all of the10 folds. In other words, the 22 selected experiments have classification accu-racies skewed towards the maximum obtainable, with the majority of those attaining the maximum in at least one of the test folds. The k-means algorithms used, with the specifick, are also shown in Table-2. The majority of the results use the MacQueen algorithm (9); with Convergent (7), Forgy (3) and Jancey (3) having fewer experiments leading to results that meet the selection criteria. The Convergent algorithm leads to experiments that rank at the lowest and at the highest of the list, while the majority al-gorithm (MacQueen) leads to experiments that rank second lowest, and second highest. The Forgy and Jancy algorithms appear to come in pairs (e.g. experiments129 and 130, experiments177 and 154, and experiments 153 and 178).
Table-2 and Table-3 demonstrate at least two possible ways in which a small number of attributes may be produced from the pipeline. If the investigatedk value is small then the rough-set portion of the pipeline will be constrained to output a set of genes of cardinality less than or equal tok. If the investigated k value is large, then the rough-set portion of the pipeline will be given many attributes from which to derive reducts. In the afore-mentioned tables, the selected experiments with largek (the latter case) used the Holte1RReducer algorithm. For example, experiment359 has a large k value and used a Holte1RReducer and likewise for experiment355.
Each experiment selects a subset of the original attributes through preprocessing, which are then passed to a cross-validation procedure. This results in the creation of training and test sets, from which a set of reducts and rules are generated.
From the set of selected experiments, the overall best (227) experiment’s reducts for each of the 10 folds, are listed in Table-4. Nine of the ten folds produce the same reducts, with the largest reduct containing3 attributes, and all other reducts containing 1 attribute. The tenth fold results in the production of 1 extra reduct as compared to the9 other folds. Informally, the largest reduct has been split into 2 reducts in Fold 9.
Table 2.k-leader Breast Cancer experiments for which mean 10-fold cross-validated classifica-tion accuracy≥ 0.7. Experiment 227 is the overall best result.
No. Experiment Mean Median Standard Min. Max. K-means k Deviation 1 347 0.7 0.75 0.35 0.0 1.0 Convergent 10 2 344 0.7 0.75 0.35 0.0 1.0 MacQueen 5 3 127 0.717 0.583 0.25 0.5 1.0 Convergent 5 4 348 0.717 0.833 0.34 0.0 1.0 MacQueen 10 5 343 0.717 1.0 0.42 0.0 1.0 Convergent 5 6 359 0.717 1.0 0.42 0.0 1.0 Convergent 500 7 276 0.733 1.0 0.42 0.0 1.0 MacQueen 10 8 228 0.733 0.917 0.34 0.0 1.0 MacQueen 10 9 300 0.733 1.0 0.42 0.0 1.0 MacQueen 10 10 204 0.733 1.0 0.42 0.0 1.0 MacQueen 10 11 129 0.733 0.917 0.34 0.0 1.0 Forgy 10 12 130 0.733 0.917 0.34 0.0 1.0 Jancey 10 13 131 0.767 0.833 0.25 0.5 1.0 Convergent 10 14 296 0.767 1.0 0.34 0.0 1.0 MacQueen 5 15 272 0.767 1.0 0.34 0.0 1.0 MacQueen 5 16 177 0.783 1.0 0.34 0.0 1.0 Forgy 10 17 154 0.783 1.0 0.34 0.0 1.0 Jancey 10 18 153 0.783 1.0 0.34 0.0 1.0 Forgy 10 19 178 0.783 1.0 0.34 0.0 1.0 Jancey 10 20 355 0.85 1.0 0.34 0.0 1.0 Convergent 500 21 224 0.85 1.0 0.24 0.5 1.0 MacQueen 5 22 227 0.917 1.0 0.18 0.5 1.0 Convergent 10
These2 reducts contain the same 3 attributes as the largest reduct in the other 9 folds, indicating that the attributes still contain discrimatory power on the whole data matrix. It can be seen that the reducts listed in Table-4 for experiment 227, the highest ranked result, contain the following set of10 attributes selected from the original 12, 625 attributes. They are listed here, along with their simplified identifier in parenthesis:
36480 at(v0), 38230 at (v1), 1511 at (v2), 38445 at (v3), 31697 s at (v4), 36604 at (v5), 38010 at (v6), 39288 at (v7), 1180 g at (v8), and 34211 at (v9). The next best mean cross-validated experiment (224) yielded 5 attributes from the original 12, 625, which are: 1961 f at, 34811 at, 41293 at, 38449 at, and 41741 at. A further investi-gation of the properties of these attributes should be performed. Therefore, experiment 227 was selected.
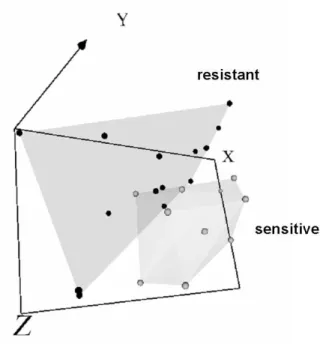
A VR-space of10 attributes from the original 12, 625 given to experiment 227 is shown in Fig-2. Convex hulls wrap each of the two classes. It is difficult to perceive on a static medium, but one object from the sensitive class is contained within that of the resistant class. In the dynamic virtual world, it is possible to, for example, rotate and more closely inspect the properties of each of the objects. This virtual reality repre-sentation indicates the feasibility of possibly obtaining a class discrimination function.
7 Table 3.k-leader Breast Cancer experiments for which mean 10-fold cross-validated classifica-tion accuracy≥ 0.7. Experiment 227 is the overall best result.
No. Exp. Discretization Reduct Algorithm 1 347 BROrthogonalScaler Holte1RReducer 2 344 BROrthogonalScaler Holte1RReducer 3 127 RSESOrthogonalScaler RSESExhaustiveReducer 4 348 BROrthogonalScaler Holte1RReducer 5 343 BROrthogonalScaler Holte1RReducer 6 359 BROrthogonalScaler Holte1RReducer 7 276 SemiNaiveScaler Holte1RReducer 8 228 BROrthogonalScaler RSESExhaustiveReducer 9 300 NaiveScaler Holte1RReducer 10 204 EntropyScaler RSESExhaustiveReducer 11 129 RSESOrthogonalScaler RSESExhaustiveReducer 12 130 RSESOrthogonalScaler RSESExhaustiveReducer 13 131 RSESOrthogonalScaler RSESExhaustiveReducer 14 296 NaiveScaler Holte1RReducer 15 272 SemiNaiveScaler Holte1RReducer 16 177 NaiveScaler RSESExhaustiveReducer 17 154 SemiNaiveScaler RSESExhaustiveReducer 18 153 SemiNaiveScaler RSESExhaustiveReducer 19 178 NaiveScaler RSESExhaustiveReducer 20 355 BROrthogonalScaler Holte1RReducer 21 224 BROrthogonalScaler RSESExhaustiveReducer 22 227 BROrthogonalScaler RSESExhaustiveReducer
The10 attributes from experiment 227 were then provided to an expression finding system (GEP), from which a functional model (discrimination function) was found. The model contains9 of the 10 attributes (v8is not used) and the explicit model is:
f (v0, v1, v2, v3, v4, v5, v6, v7, v8, v9) = (1) v3 6∗ v0∗ v9+ (−2) ∗ v 2 6∗ v0∗ v9∗ v7+ v 2 6∗ v0∗ v9∗ v4− v 2 6∗ v0∗ v9∗ v3 −v2 6∗ v 2 0∗ v9+ 2 ∗ v6∗ v 2 0∗ v9∗ v7+ v6∗ v 2 0∗ v9∗ v3− v6∗ v 2 0∗ v9∗ v4 +v6∗ v2 0∗ v4∗ v1+ v6∗ v 2 0∗ v1∗ v5− (v6∗ v 2 0∗ v7∗ v5+ v6∗ v 2 0∗ v7∗ v4) −(v6∗ v 3 0∗ v5+ v6∗ v 3 0∗ v4) + v 2 0∗ v7∗ v4∗ v2− v 2 0∗ v3∗ v4∗ v2 +v0∗ v3∗ v4∗ v1∗ v2+ v0− v0∗ v7∗ v4∗ v1∗ v2+ v9
The model was found after12, 954 generations. Additive, multiplicative and subtractive binary operations along with quadratic and cubic unary operations are found. The two variablesv6 andv0 appear in the model containing both cubic and quadratic forms. These two attributes, therefore, have a greater influence upon the overall functional value of the model.
The two attributes,v6andv0 were extracted from the10 attribute data matrix in order to construct a new2 attribute data matrix. This 2 attribute data matrix was then
Table 4.The reducts computed within Experiement 227 for each of the 10-fold cross-validated results. Fold-9 results in the production of 1 extra reduct.
Fold-0,1,2,3,4,5,6,7,8 Reducts Fold-9 Reducts {36480 at, 31697 s at, 36604 at} {36480 at}
{31697 s at, 36604 at} {38230 at} {38230 at} {1511 at} {1511 at} {38445 at} {38445 at} {38010 at} {38010 at} {39288 at} {39288 at} {1180 g at} {1180 g at} {34211 at} {34211 at}
used in order to find a model that might have discriminatory power over the2 classes. The highly non-linear model that GEP found is:
f (v0, v6) = cos(tan(v0) ∗ v0) ∗ v0∗ tan(v6) + v0∗ tan(v6) (2) +v0∗ log(v6) ∗ sin(tan(v6) − v6) − tan(v6) ∗ v6
The model uses both of the attributes, and contains more complex functions (e.g. sine). Superficially, no attribute seems to have higher influence than the other, so one partic-ular attribute was chosen (v6) and a new1 attribute data matrix was constructed (also including the decision attribute). The GEP found the following highly non-linear model:
f (v6) = sin(v6) + cos(v6∗ (cos(v2
6) + sin(sin(v6)))) (3) +sin(v6∗ (v6∗ cos(v6) + cos(v6)))
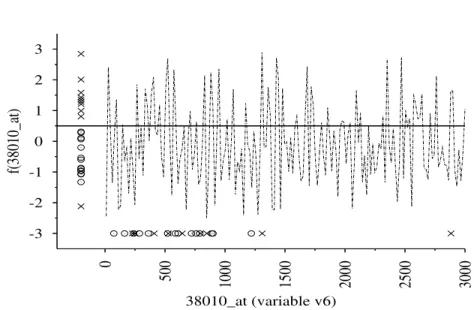
A property of each of the three models, is that they all produce high classification accu-racies over the2 classes. In particular, the latter single attribute model, when visualized in Fig-3 can be seen to produce almost perfect class separability. The X’s represent objects from class sensitive and the O’s represent objects from class resistant. In par-ticular, one object from class sensitive is contained within the class resistant, which is in agreement with the virtual reality representation of the10 attributes in Fig-2. The classification rule for Fig-3 is:
IF f (v6) ≥ 0.5) −→ class = sensitive (4) otherwise −→ class = resistant
4
Conclusions
Good results were obtained with the proposed high throughput pipeline for the dis-covery of relevant attributes in high dimensional data. The data mining procedure is based on a combination of clustering and rough sets techniques within a distributed
9
Fig. 2.The 2 classes are wrapped by convex hulls in this static virtual reality representation of 10 attributes from experiment 227. Sammon error: 0.07400. Number of iterations: 150.
computing framework and genetic programming. The attribute reduction procedure us-ing rough set reducts within a cross-validated experimental scheme applied to Breast Cancer gene expression data demonstrates the possibilities of the proposed approach. More thorough studies are required to correctly evaluate the impact of the experimental settings on the data mining effectiveness. The gene expression programming technique produced sets of analytic functions with high discriminatory power. Visual exploration of the results was useful for understanding the properties of the pipeline outputs, and the relationships between the discovered attributes and the class structure.
5
Acknowledgements
This research was conducted within the scope of the BioMine project (National Re-search Council Canada (NRC), Institute for Information Technology (IIT)). The authors would like to thank Robert Orchard and Ratilal Haria from NRC-IIT.
References
1. Anderberg, M.: Cluster Analysis for Applications. Academic Press, (1973) 359pp.
2. Chang, J.C. et al. Gene expression profiling for the prediction of therapeutic response to doc-etaxel in patients with breast cancer. Mechanisms of Disease. THELANCET, vol 362, (2003). 3. Ferreira C.: Gene Expression Programming: Mathematical Modeling by an Artificial
-3 -2 -1 0 1 2 3
0
500
1000
1500
2000
2500
3000
f(38010_at)
38010_at (variable v6)Fig. 3. Decision function found by GEP (Eq-3) for attribute 38010 at. X = class sensitive, O= class resistant. No. of generations=4, 490. No. of missclassifications=1.
4. Ferreira C.: Gene Expression Programming: A New Adaptive Algorithm for Problem Solving. Journal of Complex Systems ˇ13, 2, 87-129, (2001).
5. Gower, J.C., A general coefficient of similarity and some of its properties: Biometrics, v.1, no. 27, p. 857–871. (1973).
6. Hartigan, J.: Clustering Algorithms. John Wiley & Sons, 351 pp, (1975).
7. Pawlak, Z., Rough sets: Theoretical aspects of reasoning about data: Kluwer Academic Pub-lishers, Dordrecht, Netherlands, 229 p. (1991).
8. Øhrn A., Komorowski J.: Rosetta- A Rough Set Toolkit for the Analysis of Data. Proc. of Third Int. Join Conf. on Information Sciences (JCIS97), Durham, NC, USA, March 1-5, (1997), 403–407.
9. Sammon, J.W. A non-linear mapping for data structure analysis. IEEE Trans. on Computers C18, p 401–409 (1969).
10. Vald´es, J.J.: Virtual Reality Representation of Relational Systems and Decision Rules: An exploratory Tool for understanding Data Structure. In Theory and Application of Relational Structures as Knowledge Instruments. Meeting of the COST Action 274 (P. Hajek. Ed). Prague, November 14–16 (2002).
11. Vald´es, J.J.: Virtual Reality Representation of Information Systems and Decision Rules: An Exploratory Tool for Understanding Data and Knowledge. Lecture Notes in Artificial Intelli-gence LNAI 2639, pp. 615-618. Springer-Verlag (2003).
12. Vald´es, J.J.,Barton A.J: Gene Discovery in Leukemia Revisited: A Computational Intelli-gence Perspective. Proceedings of the 17th International Conference on Industrial & Engi-neering Applications of Artificial Intelligence & Expert Systems May 17-20, 2004, Ottawa, Canada. Lecture Notes in Artificial Intelligence LNAI 3029, pp 118–127. Springer-Verlag, (2004).
13. Vald´es, J.J.,Barton A.J: Relevant Attribute Discovery in High Dimensional Data Based on Rough Sets Applications to Leukemia Gene Expressions. The Tenth International Conference on Rough Sets, Fuzzy Sets, Data Mining and Granular Computing (RSFDGrC 2005). Lecture Notes in Computer Sciences / Lecture Notes in Artificial Intelligence. Springer-Verlag, (2005).