Assessing Selected Technologies and Operational
Strategies for Improving the Environmental
Performance of Future Aircraft
by
Anuja Mahashabde
B.S. Mechanical Engineering
Rutgers University, 2004
Submitted to the Department of Aeronautics and Astronautics
in partial fulfillment of the requirements for the degree of
Master of Science in Aeronautics and Astronautics
at the
MASSACHUSETTS INSTITUTE OF TECHNOLOGY
June 2006
@
Massachusetts Institute of Technology 2006. All rights reserved.
Author ...
Department of
eronautics and Astronautics
May 26, 2006
Certified by ...
aitz
Professor of Aeronautics an
stronautics
N
A
A
Thesis Supervisor
Accepted by ...
...
Jaime Peraire
Professor of Aeronautics and Astronautics
Chair, Committee on Graduate Students
MASSACHUSETTS INSTITUTE OF TECHNOLOGY
A.RO
Assessing Selected Technologies and Operational Strategies
for Improving the Environmental Performance of Future
Aircraft
by
Anuja Mahashabde
Submitted to the Department of Aeronautics and Astronautics on May 26, 2006, in partial fulfillment of the
requirements for the degree of
Master of Science in Aeronautics and Astronautics
Abstract
The aviation industry is expected to grow at a rate of 4-5% in the next 20 years. Such a growth rate may have important impacts on local air quality, climate change and community noise. This work assesses selected technologies and operational procedures aimed at improving the environmental performance of future airplanes.
Two different studies are presented: estimating turbine durability benefits from jet engine water injection and evaluating improvements in fuel burn and operating costs from using advanced technology, high bypass ratio engines and varying the design cruise speed. Water injection in commercial airplane engine combustors lowers oper-ating temperatures and can lead to significant reductions in NO. and soot emissions, potentially improving engine hot section life. With increasing fuel prices and possible introduction of emissions trading in the future, fuel burn may become a more critical aircraft design driver. Increasing engine bypass ratio and lowering cruise speed can lead to reduced fuel consumption.
The dominant mechanisms of failure in turbine blades are low cycle fatigue, creep and oxidation. The Universal Slopes method is used to evaluate possible fatigue life benefits from water injection for three representative blade materials. For a 67K change in turbine inlet temperature, metal temperature changes up to 47K are ex-pected. Life improvement with a 47K change in metal temperature is possible up to a factor of 1.90 for Inconel 625, up to 1.46 for Inconel 706 and up to 2.85 for Ren6 80 depending on the strains imposed. Blade life effects of creep and oxidation for vary-ing temperatures are presented based on a literature review. The absolute value of possible benefits strongly depend on material properties, metal and gas temperatures
(internal and external to the blade) and stress levels.
benefits resulting from engine de-rate and water injection using an engine cycle pro-gram (GasTurb) and airline data for a typical 1970's technology mixed flow turbofan engine. A 67K change in Tt4 from water injection corresponds to an average de-rate
value of 8.4%. Material maintenance costs in 2004 dollars are reduced by 16.52% to
2.86% for a 1-hour and 12-hour flight length respectively. Results show that shorter
range flights, with more takeoffs per day, experience larger benefits.
Engine durability analysis capabilities of a numerical simulation design tool - the Environmental Design Space (EDS) are examined. EDS currently does not have the capability for durability analyses and given the inherent difficulty in finding reliable physics-based models for part life prediction that do not require proprietary data, it seems unlikely that EDS will be able to develop such a capability.
The engine bypass-ratio and cruise speed trade study is conducted for a 737-sized future airplane using Boeing internal tools and data. At higher cruise speeds a clear optimum bypass ratio value for minimizing fuel burn is found; for the UEET engines this optimum BPR is about 14. As cruise speed is lowered, fuel burn continually decreases with increasing bypass ratio for the engines examined. At a fixed bypass ratio, flying slower seems most beneficial for very high fuel prices for minimizing both fuel burn and operating costs.
Thesis Supervisor: Ian A. Waitz
Acknowledgments
I would like to start by expressing my gratitude to Prof. Waitz for all his support and guidance throughout the course of this thesis. He has always been a great mentor, actively involved in his students' research efforts. I wish to thank him for his constant
encouragement and strong belief in my abilities during all those difficult and
frustrat-ing times when it seemed that any progress was very hard to come by. I enjoyed
working with him also because I had the freedom to explore and try new things.
I also had the opportunity to work with Prof. Karen Willcox towards the end of my thesis. She is an amazing person to work with, always offering insightful comments
and suggestions.
Sean Bradshaw provided a lot of help and guidance early on in my research with
the turbine blade life analysis. Thanks Sean, for all the interesting conversions and
general graduate school survival tips.
It was a pleasure working with the rest of the EDS team here at MIT. I would like
to thank Phil Spindler, Paul Rossetti, Tim Yoder, Doug Allaire, Julien Rojo, Karen
Marais and Joe Palladino for offering their help on numerous occasions. I would like
to thank Yifang Gong for always making time and offering help with my doubts and
questions. I would also like to thank Barbara Lechner for helping out in many ways
- academic and personal.
It is also important to mention EDS team members at Georgia Institute of
Tech-nology that I worked closely with: Jimmy Tai, Michelle Kirby, Jorge DeLuis and
Elena Garcia. Thank you for your help and guidance with all EDS related questions
and impromptu yahoo messenger sessions.
I appreciate the great advice and useful insights that Philippa Reed and Prof. Mark Spearing at the University of Southampton provided for the turbine blade life
analysis.
Next, I want to mention the preliminary design group at Boeing Commercial
Airplanes that I have been working with since last summer. I would especially like
summer. I would also like to thank Jim Conlin for helping me with the bypass ratio
and cruise speed studies. I have learnt a lot from my experience there. Finally, I
would like to thank Mithra Sankrithi for approving my stay at Boeing.
On a personal note, I would like to thank my officemates for all those lunch and
coffee breaks and great conversations. I would like to thank the GTL folk - Lori Martinez, late Paul Warren and others for the friendly lab environment and keeping
the social hour tradition alive. My close friends here at MIT are my support network
and have kept me going through all the tough times. I thank them deeply for always
being there and for all the fun times and great memories.
Lastly, I want to thank my parents and my sister. None of this would have been
conceivable without their love and faith in me. Thank you for everything.
This research has been possible with funding from the National Science Foundation
Fellowship, MIT -Aeronautics and Astronautics Departmental Fellowship and Boeing Commercial Airplanes.
Contents
Abstract Acknowledgements List of Figures List of Tables Nomenclature 1 Introduction 1.1 Background . . . . 1.2 Thesis organization . . . . 1.3 Key contributions . . . .2 Water injection: Turbine blade life and mainten
2.1 The Boeing water injection study . . . . 2.2 Turbine blade life . . . . 2.2.1 Fatigue . . . . 2.2.1.1 Crack initiation life . . . . 2.2.1.2 Universal Slopes Method . . . . .
2.2.1.3 Stress level estimation . . . . 2.2.1.4 Fatigue life estimate . . . .
2.2.1.5 Effect of ambient conditions . 2.2.2 Creep and oxidation life estimates...
ance cost benefits 25
. . . . 26 . . . . 27 . . . . 28 . . . . 29 . . . . 30 . . . . 31 . . . . 33 . . . . 39 . . . . 39 3 5 9 11 13 17 . . . . 17 . . . . 22 . . . . 2 3
2.2.3 Summary and conclusions from the blade life analysis... 2.3 Material maintenance cost estimation . . . .
2.3.1 Takeoff thrust de-rate . . . . 2.3.2 Material maintenance cost benefits . . . . 2.4 EDS engine durability and maintenance cost estimation capabilities
3 Cruise Speed-BPR Trade Study and Operator Cost Sensitivities 3.1 Key considerations for the BPR and cruise speed trade studies .
3.1.1 BPR trade study 43 44 45 47 49 53 54 . . . . 5 5
3.1.2 Cruise speed study . . . . 56
3.2 BPR and cruise speed: assumptions and study results . . . . 59
3.2.1 Key assumptions . . . . 59
3.2.2 BPR-cruise speed study results . . . . 61
3.3 CAROC analysis and assumptions . . . . 63
3.3.1 CAROC study results . . . . 64
3.4 Future work recommendations . . . . 67
3.4.1 Wing design . . . . 68
3.4.2 Other airplane level design changes . . . . 70
3.5 Conclusions . . . . 72
4 Conclusions
4.1 Summary and conclusions . . . .
4.2 Recommendations for future work . . . .
A Engine cycle deck analysis for water injection: temperature correlations
B Turbine blade heat transfer analysis
Bibliography 75 75 77 thrust-turbine inlet 79 83 87
List of Figures
1-1 APMT, AEDT, EDS framework ... 1-2 U.S.historical trends in jet fuel price ...
2-1 Effects of temperature on the mechanical properties of selected turbine blade alloys . . . . 2-2 2-3 2-4 2-5 2-6 2-7 2-8 2-9 2-10
Inconel 625 elastic life estimates
Inconel 625 stress level estimates
Inconel 625 plastic life estimates
Inconel 625 total life estimates
Inconel 706 total life estimates
Rene 80 total life estimates . . . .
SR99 Crack initiation life...
SR99 Crack propagation rate
Summary of blade life estimates
2-11 Mission time segments and associated engine maintenance cost impacts
3-1 UEET engines SFC and block fuel characteristics . . . . 3-2 UEET engines block fuel trends for varying BPR and cruise speed 3-3 Proprietary engines block fuel trends for varying BPR and cruise speed 3-4 Operator costs sensitivity to cruise speed and fuel price for a fixed
U EET engine . . . . 3-5 Operator costs sensitivity to cruise speed and fuel price for a fixed
proprietary engine . . . . 19 20 33 . . . . 35 . . . . 36 . . . . 37 . . . . 37 . . . . 38 . . . . 38 . . . . 4 1 . . . . 42 . . . . 43 46 55 62 63 65 65
3-6 Operator costs sensitivity to cruise speed and bypass UEET engines . . . . 3-7 Velocity components for a sweptback wing . . . . 3-8 Fixed UEET engine - OEW and block fuel tradeoff . .
A-1 A-2 A-3
A-4
A-5
Net Thrust vs. T4 for varying OPR . . . .
Net Thrust vs. T4 for varying BPR . . . .
Net Thrust vs. T4 for varying T4 . . . .
Net Thrust vs. T4 for varying r7poly . . . .
Net Thrust vs. Tt4 for varying mass flow . . . .
ratio for the
67 69 71 80 80 81 81 82
List of Tables
2.1 Turbine blade life estimates for creep and oxidation effects . . . . 40
2.2 Thrust de-rate values resulting from water injection . . . . 48
Nomenclature
a coefficient of expansion of the blade material [K-1 ]
r/poly Polytropic efficiency
D Lift to Drag ratio
Thickness to chord ratio C
average material temperature [K]
rn Mass flow [kg/s]
Uth Thermal stress [Pa]
a Speed of sound [mi/hr]
AR Aspect ratio
b Basquin exponent
c Fatigue ductility exponent
CD Drag coefficient
CL Lift coefficient
CLmax Maximum lift coefficient
E Young's modulus [Pa]
A Mach number
NYf Number of cycles to crack initiation
NfmaxT Fatigue life at the maximum temperature used
t Wall thickness [m]
T4 Turbine inlet temperature [K]
Twall Blade wall temperature [K]
Vapp Approach speed [knots]
W Airplane gross weight [lbf]
Ee elastic strain
E', Fatigue ductility coefficient
E, plastic strain
ef True fracture ductility
A Sweep (0)
Heat transfer rate [W/m 2 ]
o fFatigue strength coefficient [Pa]
Orut Ultimate tensile strength [Pa]
h Heat transfer coefficient [W/m 2K]
RA Area reduction of stressed component
Tcoor Cooling flow gas temperature [K]
Tas Turbine inlet external gas temperature = TM [K]
AEDT ALCCA ANOPP APMT ATC BPR CAEP CAROC EDS FAA FAA-AEE FLOPS ICAO MMC/EFH NPSS OEW OPR RDT&E SFC TBC
Aviation Environmental Design Tool Aircraft Life-Cycle Cost Analysis Code
Noise Prediction Computer Code for Advanced Subsonic Propulsion Systems
Aviation Environmental Portfolio Management Tool Air Traffic Control
Bypass Ratio
Committee on Aviation Environmental Protection Cash Airplane Related Operating Costs
Environmental Design Space Federal Aviation Administration FAA's Office of Energy and Emissions
Flight Optimization System Aircraft Performance and Sizing Code International Civil Aviation Organization
Material Maintenance Costs per Engine Flight Hour [$/hour] Numerical Propulsion System Simulation
Airplane Operating Empty Weight [lb] Overall Pressure Ratio
Research, Development, Testing and Evaluation Specific Fuel Consumption [lb/hr/lb]
Thermo-Mechanical Fatigue
Takeoff Field Length [ft]
Ultra-Efficient Engine Technology
Weight Analysis of Turbine Engines TOFL
UEET WATE TMF
Chapter 1
Introduction
1.1
Background
Environmental impacts of aviation are becoming increasingly important as the
avia-tion industry is expected to grow at a steady pace. The 2005 Boeing market outlook
states an expected global growth rate of 4.8% for passenger traffic and of 6.2% for
cargo in the next 20 years [1]. The Federal Aviation Administration (FAA) aerospace
forecast also predicts similar industry growth rates of about 4-5% per year (2]. The
primary environmental impacts of aviation are on local air quality, global climate
and community noise. Exhaust pollutants include CO2, water vapor, oxides of
Nitro-gen (NO.), unburned hydrocarbons (HC), carbon monoxide (CO), and sulfur oxides
(SO.). While reductions in fuel consumption typically also result in emissions reduc-tions, some types of emissions are strongly dependent on engine design parameters.
For instance NO. emissions rely heavily on combustor design details, the actual
com-bustion process and the engine pressure ratio. Thus, there is a need to explore
meth-ods for both reducing aircraft fuel burn as well as specifically for lowering emissions.
Historically, it is seen that the fuel efficiency of the U.S. fleet has improved by
60% from 1971 to 1998 owing to both technological and operational changes [3]. Fuel efficiency is expected to improve at a rate of 1-2% per year by 2025 resulting from
further airframe and engine improvements (3]. The implementation of such "green"
con-siderations like performance, emissions, noise and cost. In terms of environmental
objectives, the interdependencies between the different kinds of pollutants and noise
have to be properly evaluated through the design process. Additionally, the
environ-mental, operational and economic impacts of different policy scenarios have not be
assessed in an all encompassing manner yet. In addressing aviation's impacts on the
environment, a two-fold approach is necessary. The first is a need for technologies and
operational procedures that mitigate emissions and noise. Secondly, to make such
so-lutions economically viable, they have to be analyzed to understand the interrelations
between possibly conflicting performance and economical objectives. For instance, a
new technology that reduces fuel burn may be very impractical to implement due to
the associated increase in operating costs. This necessitates the use of a numerical
simulation airplane design tool that works in conjunction with other modules having
the capability of estimating impacts on local air quality, noise and global climate.
Finally, the proposed environmentally-friendly airplane designs have to be assessed
in terms of social costs and benefits associated with technology or policy scenarios.
The development of such design tools is important in aiding policy-making decisions
where the impacts of proposed changes can be propagated to fleet level operations [4].
The FAA's Office of Energy and Emissions (FAA-AEE) is currently developing a
suite of tools to assess aviation's environmental impacts and the interdependencies
between noise, emissions and performance. These tools will provide the capability of
including environmental objectives in the design process such as emissions reduction
or noise abatement. It is expected that the International Civil Aviation Organization
(ICAO), specifically its Committee on Aviation Environmental Protection (CAEP) will be the primary users of these tools. This suite of tools can be broken down to
dif-ferent modules and is broadly divided into three sections. The difdif-ferent modules used
within this framework are either existing tools or newly developed modules. The
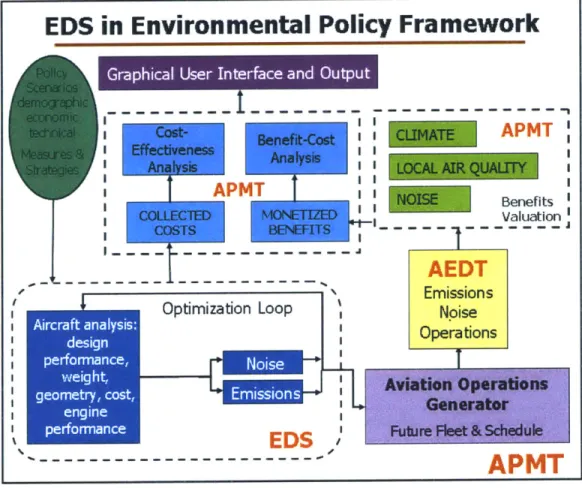
Avi-ation Environmental Portfolio Management Tool (APMT) is the economic analysis
tool and addresses the social costs and benefits associated with environmental policy
scenarios. APMT interfaces with two other components: Aviation Environmental
schedule data as inputs and provides local and global emissions inventories and noise
data. EDS provides the capability to estimate source noise, emissions, performance
and cost parameters for different technological scenarios. High fidelity future airplane
design simulation is possible through EDS. APMT, AEDT and EDS work together
to analyze various policy and technological scenarios for environmental regulations.
Figure 1-1 shows the framework for these modules. For instance, the feasibility of
implementing a higher stringency level for NO. can be tested by imposing it as a
constraint in the airplane design in EDS. The tradeoffs between noise, NOx, other
emissions, fuel burn and the resulting costs can then be examined in detail for the
resulting design as well as for fleet level changes. This data when provided to AEDT
gives local and global environmental impacts that are economically and socially
quan-tified through APMT [5].
APMT
APMT17
Benefits Valuatior
T---EDS in Environmental Policy Framework
A
rahlUsrIn--e n Otu
.1 I, .~ I-Aircraft analysis: design performance, weig ht,' geometry, Cost, L_ _ -- - I performanceEDS
APMT
Emissions
Noise
Operations
Figure 1-1: APMT, AEDT, EDS framework
I
The purpose of this thesis is to follow on the two-step process mentioned
previ-ously for assessing the environmental impacts of aviation. Two separate studies are
presented: turbine durability impacts of jet engine water injection and operator cost
sensitivity to cruise speed, engine bypass ratio (BPR) and fuel price.
A Boeing study [6] reveals that NO2 reductions up to 80% are possible during
takeoff from water injection. However, this technology involves penalties such as
weight increases from carrying water tanks and for implementation purposes other
possible benefits need to be examined. Water injection essentially reduces operating
temperatures in the engine hot section and thus may increase component part life.
Work presented in this thesis examines the potential live savings and maintenance
cost benefits possible from water injection.
Another study included in this thesis looks at the tradeoffs involved in varying
BPR, cruise speed on the fuel burn of a 737-sized future airplane. With increasing jet
fuel prices and possible future environmental levies in the form of emissions trading or
taxes, fuel burn is becoming an even more critical consideration in the design process.
Figure 1-2 shows the trends in jet fuel prices and aircraft miles traveled per capita
from 1994 to 2004 [7]. The jet fuel prices have been adjusted for inflation to 2000
chained dollars
1Aircraft-miles of travel per capita Chained 2000 S per gallon
25 16
Aircraft-miles per capita 1 4
2012 12
15 10
10-
---08
Average jet fuel price 0 4
5
02
0 0
1994 1995 1996 1997 1998 1999 2000 2001 2002 2003 2004
Figure 1-2: U.S. historical trends in jet fuel price [7]
'Chained dollars are used to adjust for inflation; the 2000 indices are the most recent values available from the Bureau of Economic Analysis (BEA)
The data shown in Figure 1-2 is based on U.S. refiner prices to end users.
Ob-serving from Figure 1-2, jet fuel prices have shown overall steady increases from 1994
to 2004. There is a direct correlation between kilograms of CO2 produced per
kilo-gram of fuel burnt; for aviation this is valued at 3.16 kg of CO2 per kg of fuel [8].
C0 2-related emissions costs are used here to demonstrate impacts of possible future
environmental costs. Based on current estimates and correcting for 2006 dollars, CO2
is priced between $8 and $170 per metric tonne [9].
Increasing BPR improves engine specific fuel consumption, however, with
increas-ing BPR weight and drag penalties are also incurred. Selectincreas-ing an appropriate BPR
in airplane design involves a tradeoff between fuel efficiency and weight and drag
im-pacts. Flying at lower cruise speeds may be another means of reducing aircraft fuel
burn, provided that the reduction in speed does not greatly increase flight duration
to offset fuel burn reductions and all other performance criteria are met. The trade
space including engine bypass ratio and cruise speed needs to be explored for
pos-sible improvements in fuel burn. More fuel efficient future aircraft will also help in
mitigating environmental impacts. Direct operating costs include fuel as well as time
related costs. Hence, operating cost sensitivities to changes in BPR and cruise speed
under different future fuel price scenarios are also examined. This trade study was
conducted using Boeing internal tools and data.
The results from the water injection study are also used specifically to
under-stand the current and future capabilities of the EDS module. Currently, in its initial
version, EDS is composed of existing NASA design tools. These are the
Numeri-cal Propulsion System Simulation (NPSS), the Weight Analysis of Turbine Engines
(WATE) program, the Flight Optimization System Aircraft Performance and
Siz-ing Code (FLOPS), the Noise Prediction Computer Code for Advanced Subsonic
Propulsion Systems (ANOPP), and the Aircraft Life-Cycle Cost Analysis Code
(AL-CCA) [5]. The results from the water injection analysis are used to assess the engine part life prediction capability of EDS: the maintenance cost estimation capabilities
of the ALCCA module are also examined. The subsequent sections of this chapter
1.2
Thesis organization
This section provides a brief description of the organization and structure of the
different chapters. There are four chapters in this thesis; the contents of each chapter
are outlined below.
Chapter 2:
Chapter 2 focuses on water injection technology as a means of reducing NO, emissions
and improving engine hot section life and thus maintenance costs. NO, reductions of
up to 80% and turbine inlet temperature reductions of approximately 67K (120'F)
are possible during takeoff when water is sprayed into the engine combustor [6].
This corresponds to metal temperature changes of about 34K-47K. The Universal
Slopes method is used to quantify turbine blade fatigue life benefits possible from
reduced operating temperatures. A brief discussion of results based on a literature
review is also presented for the other principal failure modes - creep and oxidation. Additionally, airline data [11] available on material maintenance costs benefits from
takeoff de-rate procedures are used to demonstrate possible maintenance cost benefits
from water injection. The results of this study are then applied to understanding
current and future capabilities of EDS and ALCCA in predicting engine component
life and estimating maintenance costs.
Chapter 3:
Results from the trade study on the effects of cruise speed and BPR on block fuel
trends and operating costs for a 737-class airplane are presented in Chapter 3.
Esca-lating fuel prices and possible environmental levies in the future may make fuel burn
reduction a key design objective. Lowering cruise speed and increasing engine BPR
can be good strategies for improving aircraft fuel efficiency. Boeing internal data and
analysis tools are used for the analyses in this chapter. Using some simplifying
as-sumptions, block fuel trends are obtained for varying engines with different BPRs and
performance analyses are then used in an operating cost sensitivity study. Variations
in operating costs are shown with changing cruise Mach, BPR and fuel prices. Finally, the assumptions used in the study are critically examined and recommendations are
provided for future work.
Chapter 4:
Chapter 4 is the concluding chapter of the thesis. This chapter summarizes and
highlights important conclusions derived from the work presented in the preceding
chapters.
1.3
Key contributions
The work presented in this thesis has a two-fold purpose. The first goal is to assess
selected technologies and operational strategies aimed at improving the environmental
performance of future aircraft. Secondly, the results from these analyses are used
to understand some of the potential capabilities and limitations of specific modules
within the Environmental Design Space suite of tools. The main contributions of this
thesis are listed below:
" Potential fatigue life benefits resulting from water injection in jet engines are quantified based on an empirical model.
" Turbine inlet temperature reductions from de-rated operations are correlated with temperature changes from water injection to estimate possible maintenance
cost benefits resulting from the water injection technology.
" Engine life prediction and maintenance cost estimation capabilities and limita-tions of the ALCCA module in EDS are identified.
" Block fuel trends are demonstrated for varying BPR and cruise Mach for a 737-sized future airplane using simplifying assumptions.
* Operator cost sensitivity to BPR, cruise speed and fuel price is also explored
using the results from the cruise speed-BPR trade study.
* Recommendations are provided for future work in understanding the impacts
Chapter 2
Water injection: Turbine blade life
and maintenance cost benefits
Water injection is a well-established technology in the industrial power generation
sector and is used for NO, reduction as well as power augmentation. The
imple-mentation of a water injection system in commercial airplane engines may lead to
significant reductions in NOX and soot emissions with possible improvements in the
engine hot section life (i.e in the combustor and the turbine). Improvement in the hot
section life is anticipated as water injection reduces the operating temperature of the
engine components. This chapter focuses on analyzing the effects of water injection
specifically on turbine life and on maintenance costs.
For the purposes of this study, it is assumed that turbine life is primarily limited
by the temperatures experienced by the blades. The dominant mechanisms of failure in turbine blades are identified as low cycle fatigue, creep and oxidation. Using
the Universal Slopes method, a preliminary quantitative analysis of possible fatigue
life benefits from water injection has been performed for three representative blade
materials, Inconel 625, Inconel 706 and Ren6 80. The selection of these materials for
the proposed blade life estimation analysis is largely dependent on data access and
availability. Quantitative results are presented only for the fatigue failure mode. A
detailed investigation of the combined effects of fatigue, creep and oxidation is not
creep and oxidation is presented as found in the literature.
In addition, a maintenance cost analysis is performed to evaluate and compare
benefits resulting from engine de-rate and water injection. An engine cycle program, GasTurb [10], and airline data [11] are used to correlate changes in turbine inlet
temperature and corresponding changes in maintenance costs for a typical 1970's technology mixed flow turbofan engine.
The shortcomings of these studies are also discussed and recommendations for future work are presented. Finally, the implications of the results of this study for modeling capabilities of the Environmental Design Space suite of tools(EDS) are
con-sidered. The Aircraft Life Cycle Cost Analysis (ALCCA) module within EDS
esti-mates airplane RDT&E, production and operations costs. The turbine blade life and
maintenance cost results are used to briefly discuss the current and potential capabil-ities of EDS and ALCCA in the area of estimating component life and maintenance costs.
2.1
The Boeing water injection study
In the aviation industry, water injection has been used in the early Boeing 707 and Boeing 747 commercial jet engines for takeoff thrust enhancement; however, current technology jet engines are capable of much higher power production and no longer use water injection for that purpose. Today, the technology holds the potential to improve the turbine blade life in addition to reducing NO, and soot emissions. Data obtained from Boeing [6] reveals that NO, reductions of up to 80% are possible during takeoff when water is sprayed into the engine combustor with a water to fuel ratio of 1:1. For a 747-400 size aircraft, an 80% reduction in NO, may save about 56 lb of emissions. Water injection in the combustor also corresponds to temperature reductions of approximately 67K (120'F) in the turbine inlet.
The Boeing study was conducted to assess the implementation potential of the
water injection technology on a Boeing 747-400 airplane to reduce NO,, emissions during takeoff. 400 gallons of conditioned water would have to be carried on board
for use during takeoff upto 3000 ft. This resulted in a weight penalty of about 4,090
lb from carrying the water and necessary system equipment that could reduce aircraft range and increase mission fuel required. Water injection also tends to reduced
com-pressor stall margins and overcoming this problem may incur fuel efficiency penalties.
It was found that retrofitting existing aircraft with this technology would be too cost
intensive. The implementation of water injection technology would only benefit newly
designed airplanes as the required system changes could be incorporated in the design
process [6].
The benefits offered by water injection - takeoff NO, reduction and potential engine hot-section maintenance cost improvements may be able to offset other weight
and operational penalties encountered. NO. reductions could help save in operating
costs at airports where emissions-based charges are imposed. Temperature reductions
in the engine hot-section may help by extending part life and lowering maintenance
costs. The study presented in this chapter assesses the potential turbine life benefits
resulting from water injection to further understand the implementation feasibility of the technology.
2.2
Turbine blade life
The Boeing study estimates changes in turbine inlet gas temperature, T 4 to be 67K
due to water injection in the combustor. A thermal effect of this magnitude during the
critical takeoff portion of the mission can have significant impacts on the turbine blade
life. External gas temperature reductions in the turbine do not directly translate to equivalent reductions in blade metal temperature, Twaii. In this study it is assumed
that ATwa, ranges from 50% to 70% of ATMa. This assumption is based on personal
communication with Boeing and data published in the Boeing contractor report to
NASA on water injection [12]. For a 67K change in T4, metal temperature changes
would range from 34K to 47K. For this study a range of possible life estimates is
presented; more accurate results can be obtained with a first order blade heat transfer
the data necessary to evaluate changes in blade temperature.
Turbine blade material properties and thermal loads vary greatly with operating
temperatures. Life benefits due to water injection are expressed in terms of general
trends observed in the predicted life as a function of metal temperature. The results
developed are not limited to a particular type of engine or other design details such
as blade geometry, but are representative and determined using generic test specimen
data sets, not accounting for blade coatings. Fatigue, resulting from cyclic loading
on the components, creep and oxidation are known to be dominant failure
mecha-nisms in the engine hot section. Specifically, turbine blades are subjected to high
centrifugal stress levels and aerodynamic loadings at elevated temperatures in a
cor-rosive environment. Degradation of turbine blades thus results from a combination of
cyclic high stress levels, creep effects from exposure to elevated temperatures as well
as environmental factors. Owing to the complexity of the interactions between the
different failure mechanisms and the lack of detailed knowledge about the loads and
temperatures involved, a high fidelity, physics-based, life prediction model is not
feasi-ble. Hence, this chapter investigates fatigue life dependence on temperature through
a generalized empirical model. The effects of creep and oxidation on component life
are presented as found in the literature for a different set of nickel-base alloys.
2.2.1
Fatigue
Critical cyclic stress imposed for a short duration of time such as takeoff is referred
to as low cycle fatigue. Fatigue life characterization is commonly done through total
life approaches, where life is divided into two distinct regimes: crack initiation and crack propagation [13]. Total life approaches are based on stress levels or strain levels
usually predicting life up to crack initiation and then the propagation life to a critical
crack size that is designated as failure. Depending on the operating conditions and
loads imposed on the part, the total life of the part is divided between these two
2.2.1.1 Crack initiation life
In the case of low cycle fatigue at elevated temperatures, material behavior is not
purely in the elastic range. Under such circumstances, fatigue life is characterized in
terms of the total strain range that the part is subjected to [13]. The total strain
amplitude is divided into its elastic and plastic strain amplitudes given by:
A = A-, + AEt (2.1) 2 2 2 where: 6e = elastic strain e, = plastic strain
Based on log-log plots of experimental data in terms of cycles to failure versus stress levels , the elastic strain can be expressed through the Basquin equation [13] as:
A - a (2Nf)b
(2.2)
2 E where:
E = Young's modulus [Pa]
o' = fatigue strength coefficient [Pa]
b = fatigue strength or the Basquin exponent (ranging from -0.05 to -0.12)
Nf = number of cycles to crack initiation
Similarly, according to the Coffin-Manson relation [13], the plastic strain
compo-nent is expressed as:
= eP (2Nf)c
(2.3) where:
e'5 = fatigue ductility coefficient
c = fatigue ductility exponent (ranging from -0.5 to -0.7)
Combining equations (2.2) and (2.3) and substituting into equation (2.1) gives:
ai = (2Nf) + E'(2Nf)c (2.4)
2.2.1.2 Universal Slopes Method
Although the Coffin-Manson relation was developed for crack initiation life,
Man-son [14] shows that this relation can be used to predict life up to failure or specimen
separation. Based on experimental results obtained from 29 specimens, his results
propose a modified version of equation (2.4) for fatigue life prediction. This method
is commonly known as the Universal Slopes method and is given by:
Aaoa 5 ult (N)0.12 06 6
AEtota = 3.5 E(N5)- E + E5.6(Nf)- 6 (2.5)
where:
o-ut = ultimate tensile strength [Pa
ef = true fracture ductility (from monotonic tensile tests)
Ef = ln(1 + %elongation) or e5 = ln(1 -1RA
RA = area reduction of stressed component (test specimen)
This method puts forth average values for the exponents in equation (2.4), based
on experimental results. These exponent values are not specific to any material
and can be used in a preliminary design stage analysis. From equation (2.5) it can
be seen that at constant strain, increasing o-ut and ef and decreasing E enhances
material life. Fatigue life degrades with increasing strain. In the Manson study [14], 99.5% of the experimental life data falls within a factor of 20 of the predicted life. For the analysis herein, nickel-base superalloy turbine blade materials, Inconel 625,
Inconel 706 and Ren6 80 are used where the materials properties are obtained from
the technical library from High Temp Metals Inc. [15], the Military Handbook [16]
and the Aerospace Structural Metals Handbook [17]. The damped Newton-Rhapson
method is used to solve equation (2.5) for Nf.
(i) Elastic life:
If only the elastic portion of the Universal Slopes method is used, the life estimate can be solved as:
NJ ( 6totaiE 0.12 (2.6a)
3.50-2lt
The elastic life estimate is determined by the ratio of temperature dependent material
properties and the strain value.
(ii) Plastic life:
Similarly, if only the plastic part of the method is used, the life is evaluated as:
NJ = Ef(Actotal)-6 (2.6b) Here, the plastic life estimate is only a function of ductility, which depends on material
temperature, and of the strain value used.
2.2.1.3 Stress level estimation
In order to obtain life estimates from the Universal Slopes method, the total strain
range imposed on the blade needs to be approximated. The analysis is performed
in two ways: first by keeping the strain level constant and varying temperature
de-pendent material properties and then by varying the strain level as well as material
properties with temperature.
(i) Constant strain range estimation:
estimates. The total strain is selected such that the respective stress value is limited
at 40% to 80% of the ultimate tensile strength at a given temperature level. This
corresponds to applying a design factor of safety of 2.5 to 1.25 respectively. The
life cycles to failure are then acquired from equation (2.5), keeping the strain level
constant and varying material properties due to temperature changes.
(ii) Temperature-dependent strain range:
It can be expected that as the operating temperature of the blade increases, the
thermal stress level increases and there are variations in the total strain as well.
These strain variations are expressed through thermal stresses only. This represents
in-phase thermo-mechanical loading where the thermal and mechanical loads on the
part are increased or decreased simultaneously. Since the centrifugal stresses are not
calculated, the thermal stress levels are permitted to be higher than expected such
that the total stress level is within a factor of safety of 1.25 to 2.5 of the ultimate
strength.
(iii) Thermal stress:
The thermal stress is given by:
Uth = aE(T - T) (2.7)
where:
Uth = thermal stress [Pa]
a = coefficient of expansion of the blade material [K-1] T = local material temperature [K]
T = average material temperature
[K]
Thermal stresses arise from local temperature gradients that cause non-uniform
2.2.1.4
Fatigue life estimate
The Universal Slopes method, as described previously, is used to estimate low cycle
fatigue life for turbine blades. Owing to a lack of detailed information about the
component geometry, loads and operating conditions, the life prediction
methodol-ogy selected is based primarily on temperature dependent material behavior. Three
different representative alloys are selected for this analysis. Figure 2-1 compares the
relevant mechanical properties of these materials [15, 16, 17].
-x 1011 C *0 C E6 300 400 500 600 700 800 900 1000 1100 1.3 400 500 600 700 800 900 1000 1100 Temperature [K] (a) Temperature [K] (b) 0.5 OAF1 0.3 0.2 0.1 1.7 x 10 010 5 1.6 -T 1.3-1.2 -. E) 4 _ 500 60, 700 S00 900 1000 11 00 400 500 600 70, 8, 900 100 0 11 Temperature [K] Temperature [K] (c) (d)
Figure 2-1: Variation in mechanical properties with temperature [15, 16, 17]. Key properties are: (a) Young's modulus, (b) Ultimate tensile strength, (c) Ductility, (d) Thermal expansion coefficient
These material properties show similar general trends for varying metal
tempera-4- Inconel 625 -- Inconel 706 --- Rene 80 2.1 2 CL 1.9 1..8 0
~1.7
0 6 0) >_1.5 4- Inconel 625 - Inconel 706 -y Ren. 80 Inconel 625 Inconel 706 Ron. 6 00004
V Wture levels with differences in magnitudes and it is expected that this will be reflected
in the life estimates obtained.
(i) Inconel 625:
Fatigue life predicted by the Universal Slopes method varies greatly depending on
several factors such as the material used, whether the elastic or plastic portion of the
equation is used, the strain levels, strain dependence on metal temperature and so on.
It is important to note again, that the total strain levels selected for the analysis were
based on stress levels limited to 40% to 80% of the ultimate strength of the material
at the given temperature. A lower range of strain levels for the given temperature
reduction would have shown higher life benefits, while a higher strain level would give
comparatively lower life benefits. Some of these effects are illustrated in the following
discussion for Inconel 625.
For Inconel 625, the elastic and plastic parts of the Universal Slopes method are
isolated and life is determined for each type of deformation. This is done using
constant strain values as well as with temperature dependent strain. Figure 2-1
compares the elastic life prediction based on how the strain range is defined. Results
are plotted as a ratio of fatigue life at a given temperature, Nf, to fatigue life at the
maximum temperature used in the analysis,
NmaxT,
for the different strain levels
versus metal temperature.
Both plots are subject to similar strain ranges, but in Figure 2-2a the strain is held
constant while material properties are varied with temperature. From equation (2.6a)
it is seen that life is function of material property ratios and the imposed strain. At
constant strain values, ratio of NJ at a given temperature to N!maxT just becomes a
ratio of material properties with the strain terms canceling. As a result, all the life
ratio curves for the different strains used are identical. For Figure 2-2b, the life ratios
are different since the strain values vary with temperature, but the differences are not
significant.
-5 -5 .0 .0 3- - j 3-2- 2-300 400 500 600 700 80 900 1000 1100 1200 00 400 500 600 70 800 900 1000 1100 1200
Temperature [K]
Temperature [K]
(a) (b)Figure 2-2: Inconel 625
-
changes in elastic life with temperature. (a) Elastic life
estimates using constant strain values at different metal temperatures. (b) Elastic
life estimates with temperature dependent strain
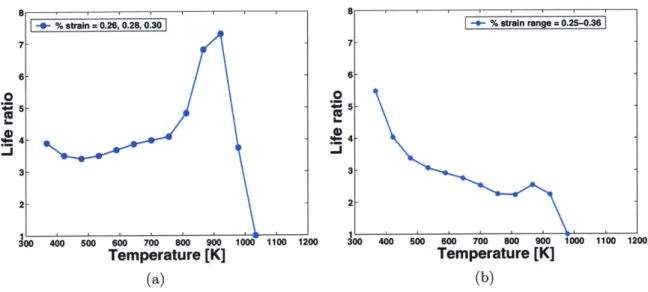
The most remarkable difference between the two figures is the overall behavior
of the life ratio curve with decreasing temperature. In Figure 2-2a, the life benefit
reaches a maximum around 900K and then decreases even with decreasing
temper-ature. It appears counterintuitive that a greater life benefit is achieved at an
inter-mediate temperature level; life benefits could be expected to continuously improve
with decreasing temperature. This apparent contradiction is better understood if the
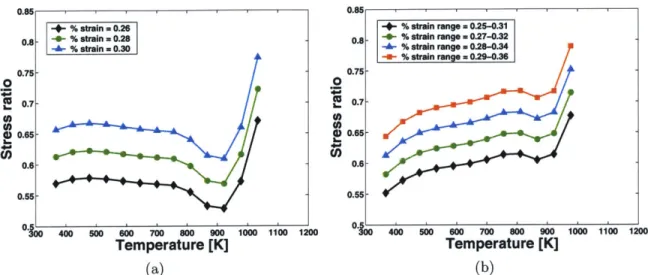
stress levels associated with these strain values are examined. Figure 2-3 shows the
stress levels corresponding to the imposed strains in Figure 2-2, normalized by the
ultimate tensile strength of the material at the given temperature.
It is seen that in the constant strain case, the stress ratio is almost constant at
lower temperatures and drops around the 900K temperature level by 0.02 or greater,
resulting in the life ratio peak in Figure 2-2a. There is also a drop in stress ratio in
the case of varying strain level as shown in Figure 2-3b, but this drop is only about
0.01 and more importantly, the stress levels increase with temperature. This drop in
the stress ratio also results in a small peak in Figure 2-2b, but the overall trends are
more reasonable than those of Figure 2-2a.
0.85 , 1 , 1 1 , I 0.85
+- % strain = 0.26 4- % strain range = 0.25-0.31
0.8. -*- % strain =0.28 0.8. -1- % strain range = 0.27-0.32
0" % strain -A -0 % strain rang. %0n"0.2 a a 0.28-0.34
0.75 0.75 o 0 00.7 0! 0.7 6) 0.65- 6)0.65-0.6- 0.6-0.55 0.55 0. 4" 500 00 80 91.0 90o 100 i 1,o 1200 00 400 500 600 700 800 900 1000 1100 1200 Temperature [K] Temperature [K] (a) (b)
Figure 2-3: Inconel 625 - ratio of imposed stress to ultimate tensile strength.
(a) Stress ratio for the constant strain value case. (b) Stress ratio for temperature-dependent strain life estimates
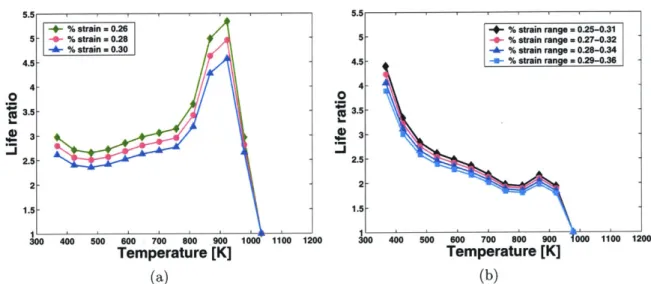
Summarizing elastic behavior, it can be said that stress and strain levels that increase with temperature more accurately describe the physical process expected. For a blade metal temperature change between 34K to 47K, the elastic life improves anywhere between a factor of 2 to 3.2 depending on strain levels and temperatures for Inconel 625.
Similarly, the plastic life was also determined over the same strain ranges using equation (2.6b) for Inconel 625. The results are displayed below in Figure 2-4.
From equation (2.6b) it is seen that the plastic life is simply a function of ductility and strain values. Therefore, for constant strain, Figure 2-4a almost resembles the ductility curve for Inconel 625 (Figure 2-2a) and it is seen that there are no life benefits from decreasing temperature in the plastic life. However, in Figure 2-4b there is some life benefit seen only at very low temperatures.
The same analysis as above is repeated using the complete Universal Slopes method in equation (2.5), where the damped Newton-Rhapson method is used to solve equation (2.5) for Nf. The results are seen to strongly resemble the elastic life curves. Thus it is anticipated that the elastic life behavior will to a large extent determine the total life trends of the component.
1.05 1 0.95 0.9 0 0.85 0.8 0.75 0.7 0.65 n ~'~00 400 500 600 700 800 900 1000 1100 400 500 600 700 800 900 1000 1100 Temperature [K] (a) 0 *0 -1200 0.95- 0.9-0.85 0.8 0.75-0.7 0.65| -4- % strain range = 0.25-0.36 0.I 3 400 500 600 7 W00 900 1000 1100 Temperature [K] (b)
Figure 2-4: Inconel 625
-
changes in plastic life with temperature. (a) Plastic life
estimates using constant strain values at different metal temperatures. (b) Plastic
life estimates with temperature-dependent strain
500 600 700 800 900 1( Temperature [K] (a)
.0
500 600 700 800 900 Temperature [K] (b)Figure 2-5: Inconel 625
-
changes in total life with temperature. (a) Total life
es-timates using constant strain values at different metal temperatures. (b) Total life
estimates with temperature-dependent strain
-*- % strain = 0.26,0.28, 0.30
1200
10
cc
Different strain ranges are investigated in Figure 2-5 and as anticipated, higher
strain levels reduce fatigue life further. The curves follow the same general trends
for varying strain levels and features from the elastic life curves are dominant. The
plastic life part of the equation reduces the magnitudes of the life ratios as can be
seen through comparing Figures 2-2 and 2-5.
The total life benefits now range from a factor of 1.9 to 2.5 for a temperature
reduction of 67K in the turbine inlet temperature, depending on the stress levels and
temperatures used for Inconel 625. This range includes results from both charts in
Figure 2-5.
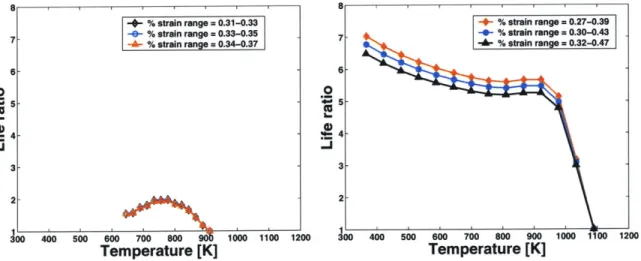
(ii) Inconel 706 and Rend 80:
Total life estimates with temperature dependent strain are shown for Inconel 706 and
Ren6 80 in Figures 2-6 and 2-7. The differences in life estimate trends of Inconel 706,
Inconel 625 and Ren6 80 primarily arise from variations in material properties.
1
8
-- % strain range = 0.31-0.33 -4- % strain range = 0.27-0.39 -0- % strain range = 0.33-0.35 _ - -0- % strain range = 0.30-0.43 -A- % strain range = 0.34-0.37 -Ar % strain range = 0.32-0.47
6.
6-02
.0
=- 5-~ 5-- 4 3- 3-2- -2-300 400 5 6 700 8 90 1000 1100 00 00 400 50 600 700 800 900 1000 1 00 1200Temperature [K]
Temperature [K]
Figure 2-6: Inconel 706 total life es-
Figure 2-7: Ren6 80 total life estimates
timates with temperature-dependent
with temperature-dependent strain
strain
The range of temperatures used for Inconel 706 is narrower than that used for
the other materials owing to data availability, and hence places some limitations on
possible fatigue life trend comparisons. Despite the limitations, the general trend
noted based on these three materials is that life benefits increase with decreasing
metal temperatures. With a 34K-47K reduction in turbine inlet temperature, life
improvements range from 1.31-1.46 for Inconel 706 and by 2.39-2.85 for Rene 80 as
seen from Figures 2-6 and 2-7. In contrast, from Figure 2-5b it is seen that fatigue life
improves for Inconel 625 by 1.85-1.90 for the same turbine inlet temperature reduction
and with strain levels that vary with temperature.
Thus, from these comparisons, given a known turbine inlet temperature reduction, a range of estimates can be provided for the expected improvement in turbine blade
life. A more accurate estimate for life benefits can be obtained with a detailed analysis
using the exact materials, blade geometry, coatings, temperatures and load levels
involved in the specified engine type. Life benefits will also be dependent on the
statistical validity of the basic data sets used in the analysis.
2.2.1.5 Effect of ambient conditions
There will also be differences in fatigue life benefits possible based on ambient op-erating conditions. At higher ambient temperatures, TM levels can be expected to
be higher than at cooler ambient temperatures. As seen from Figures 2-5b, 2-6 and
2-7 the slope of the fatigue life ratio curve changes depending on the temperature range concerned; at higher temperatures the life curve slope is steep as compared to
lower temperatures where the life curve flattens out. This indicates that for the same
34K-47K metal temperature reduction, it is possible for hot operators to encounter
higher life benefits as compared to cold operators.
2.2.2
Creep and oxidation life estimates
Owing to the complex interactions between fatigue, creep and oxidation, a detailed
life estimate analysis that accounts for component failure due to the combined effects
of all the three mechanisms is beyond the scope of this study. In order to provide a
preliminary estimate for life benefits from water injection, some relevant results found
through a literature search are included in this chapter. Based on common industry
changes in gas and metal temperatures as well as from centrifugal stresses are shown
in Table 2.1.
Table 2.1: Turbine blade life estimates for creep and oxidation effects for varying temperatures and stresses (18]
Varying 1" Stage Blade 1" Stage Blade
parameter Creep-Fatigue life Oxidation life
Local gas temperature i 15% ± 14%
±
10K (mean 2000K)Metal temperature ± 8% i 8%
±
2.78K (mean 1000K)Centrifugal stresses ± 1% t 6%
Table 2.1 shows that large errors can result simply from errors in temperature or
stress levels used for the analysis. It is very critical that the best estimates available
for temperature and loads are used in life prediction methods to ensure reliable results.
The combined effects of thermo-mechanical fatigue and creep are usually studied
experimentally and then modeled based on the data obtained. The tests include
varying thermal and mechanical loads to simulate in-service working conditions. In
a study by S.X. Li and D.J. Smith [19] the effects of temperature and cyclic loading were investigated on a single crystal nickel base superalloy, SRR99. The tests were
carried out at 750'C (1023K) and 1050'C (1323K). The specimens were exposed to
three different loading conditions, continuous cycling (denoted as 0/0), cycling with a
tensile dwell, (t/0) and with a compressive dwell, (0/t). The tensile and compressive
dwells were imposed to study crack initiation and propagation under combined fatigue
and creep loading; the dwells were at constant strain for 2 minutes.
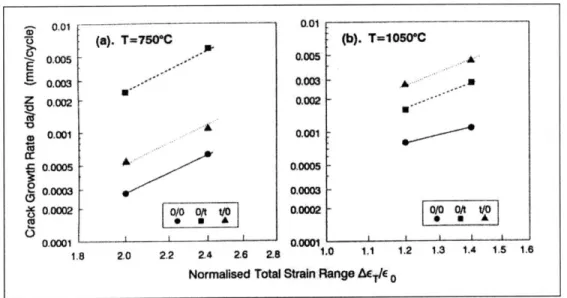
The results for crack initiation life and propagation rates are shown in Figures 2-8
and 2-9 and for both test temperatures; the triangles correspond to tensile strain
dwells. Assuming tensile strains are more dominant in the case of turbine blades
from centrifugal effects, from Figure 2-8 it can be noted that under tensile strain
dwells, crack initiation life decreases as testing temperature increases. For
3000-5000 cycles for 750'C to around 200-400 cycles for 1050'C. Similarly, crack propagation rates increase with increasing temperature for tensile strain dwells as
noted in Figure 2-9. For 750'C, propagation rates are about 0.0005 mm/cycle to
0.001mm/cycle; they increase by an order of magnitude ranging from 0.0025 to 0.004
mm/cycle at 1050 C. Additionally, it should be noted that the total strain range
im-posed at higher temperatures is less than that used at lower temperatures in order to
observe the crack propagation behavior prior to complete failure. Thus, under tensile
strain loads, the results of this study demonstrate that for alloy SRR99, crack
initi-ation life decreases and crack propaginiti-ation rates increase by an order of magnitude
when the testing temperature is increased from 750*C(1023K) to 1050'C (1323K).
At40
ID
1
OA 2.
4;0
2.0-to 0100 300 10003200010000 100000 10 20 60 100200 50Q 1000 60001000
Crackniatir 14. N1
Figure 2-8: Influence of strain dwells and temperature on crack initiation life for
SRR99[19]
Along with temperature and mechanical load effects, properties of the base alloys
and coating materials involved are also deciding factors in the interactions between the
different failure mechanisms. The protective coatings and the thermal barrier coatings
(TBCs) impact the mechanical properties of the base alloy as well. The protective
coatings are designed to shield the base material from environmental attacks while
the TBCs reduce the effective temperature seen by the alloy. Due to the difference
![Figure 1-2 shows the trends in jet fuel prices and aircraft miles traveled per capita from 1994 to 2004 [7]](https://thumb-eu.123doks.com/thumbv2/123doknet/14100510.465552/20.918.187.746.708.1007/figure-shows-trends-prices-aircraft-miles-traveled-capita.webp)
![Figure 2-1: Variation in mechanical properties with temperature [15, 16, 17]](https://thumb-eu.123doks.com/thumbv2/123doknet/14100510.465552/33.918.147.794.389.954/figure-variation-mechanical-properties-temperature.webp)
![Table 2.1: Turbine blade life estimates for creep and oxidation effects for varying temperatures and stresses (18]](https://thumb-eu.123doks.com/thumbv2/123doknet/14100510.465552/40.918.193.723.216.410/table-turbine-estimates-oxidation-effects-varying-temperatures-stresses.webp)
![Figure 2-8: Influence of strain dwells and temperature on crack initiation life for SRR99[19]](https://thumb-eu.123doks.com/thumbv2/123doknet/14100510.465552/41.918.164.733.417.713/figure-influence-strain-dwells-temperature-crack-initiation-life.webp)