PERCEPTUAL GROUPING IN AIR TRAFFIC CONTROL
by Steven J. Landry
B.S., Electrical Engineering (1987) Worcester Polytechnic Institute Submitted to the Department of Aeronautics
and Astronautics in partial fulfillment of the requirements for the degree of
Master of Science in Aeronautics and Astronautics
Massachusetts Institute of Technology
July 1999
MASSACHUSETTS INSTITUTE OF TECHNOLOGY
DEC 2 8 1999
LIBRARIES © Massachusetts Institute of Technology 1999. All rights reserved.
Signature of author
Dpartment of Ae/onautics and Astronautics July 1999 Certified by
Prof. Thomas B. Sheridan Professor of Engineering and Applied Psychology Emeritus Department of Mechanical Engineering Department of Aerorautics and Astronautics
b I Thesis Supervisor Accepted by _
I I Prof. Jaime Perraire
Chairman, Departmental Graduate Committee ii
COGNITIVE GROUPING IN AIR TRAFFIC CONTROL
by Steven J. Landry
Submitted to the Department of Aeronautics and Astronautics in partial fulfillment of the
requirements for the degree of Master of Science in Aeronautics and Astronautics
ABSTRACT
Subjects performing visual target tracking tasks have been shown to utilize perceptual organization. This organization has been shown to have both Gestalt features and goal-oriented features. Previous studies have attempted to use memory recall techniques to examine potential cognitive groupings in air traffic control tasks, with negative results.
Analysis of eye movements has shown similar patterns of organization to the underlying visual tasks. Experiments were performed to evaluate whether recall or eye-tracking techniques can be used to extract perceptual groupings. Subjects' memory of scenario information is generally poor, except where significant manipulation of targets occurred. For this reason it is suggested that recall techniques may not be able to elicit subjects' cognitive groupings. Fixation data, however, indicates clustering consistent with Gestalt factors. Goal-oriented factors did not seem to affect grouping.
Thesis Supervisor: Thomas Sheridan
TABLE OF CONTENTS
Acknowledgments ... ... 9
Perceptual concepts in air traffic control... ... 11
1.1 In tro du ction ... 11
1.2 P ercep tion ... 11
1.2.1 Visual perception... ... 12
1.2.2 Visual perception in air traffic control... ... 13
1.3 Attention ... 14 1.4 Memory... ... ... 16 1.4.1 Short-term memory... 16 1.4.2 Working memory... 17 1.4.3 Long-term memory... ... ... 19 1.4.4 Episodic memory... ... 19 1.4.5 Semantic memory ... ... 20
1.5 Situational awareness and mental models ... .... 21
Perceptual grouping concepts ... . ... 23
2.1 Introdu ction ... ... 23
2.2 Object vs. space-based theories of attention... .... 24
2.3 Bottom-up vs. top-down...25
2.3.1 G estalt psychology ... ... 26
2.4 Perceptual group formation...28
E ye m ovem ents ... ... 31
3.1 In tro du ctio n ... 3 1 3.2 Eye movement basics... 31
3.3 Scan p ath ... ... 32
Supervisory control concepts ... 35
4.1 Introduction ... 35
4.2 Workload and complexity ... 37
4.3 R O C analysis... ... 38
Target tracking experiments ... 39
5.1 In troduction ... 39
5.2 Experiment 1 ... 39
5.2.1 Setup and design ... 39
5.2.2 Results...42
5.2.3 Experiment 1 - discussion ... 46
5.3 E xp erim en t 2 ... ... 47
5.3.1 Setup and design ... ... ... . ... 47
5.3.1.1 Eye movement monitoring system... ... 48
5.3.1.3 M eth od ... ... ... ... 50 5.3.2 R esu lts... ... 53 5.3.2.1 R aw data... .. ... ... 53 5.3.2.2 Correlations ... .. ... ... 58 5.3.3 D iscussion ... . ... . ... ... ... ... 63 C onclusion ... ... ... .. ... ... . . ... ... ... 67 Further w ork ... ... ... 69
Experim ental set up - experim ent 2... ... ... 71
Scenario screen shots ... ... ... 73
LIST OF FIGURES
Number Page
Figure 1. Spotlight locus of attention. ... 24
Figure 2. Factor of proximity (Wertheimer, 1923)... 26
Figure 3. Factor of similarity (Wertheimer, 1923) ... 26
Figure 4. K anisza figure. ... ... 27
Figure 5. More Kanisza figures... 27
Figure 6. Scanpath (Privatera, 1999) ... ... 32
Figure 7. Ambiguous figure... ... 33
Figure 8. Mental and physical processes required in ATC ... 36
Figure 9. Experiment 1 screen shot... ... 40
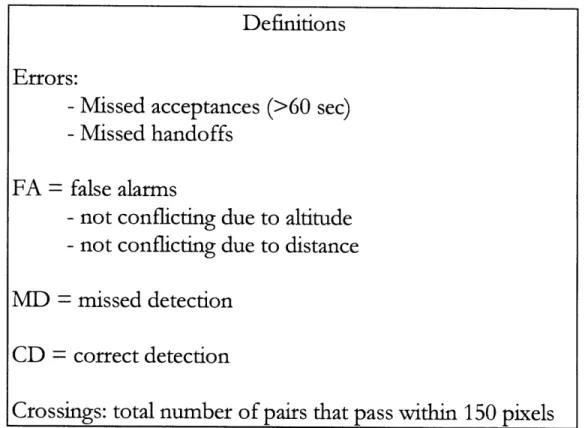
Figure 10. D efinitions... ... ... ... ... ... 42
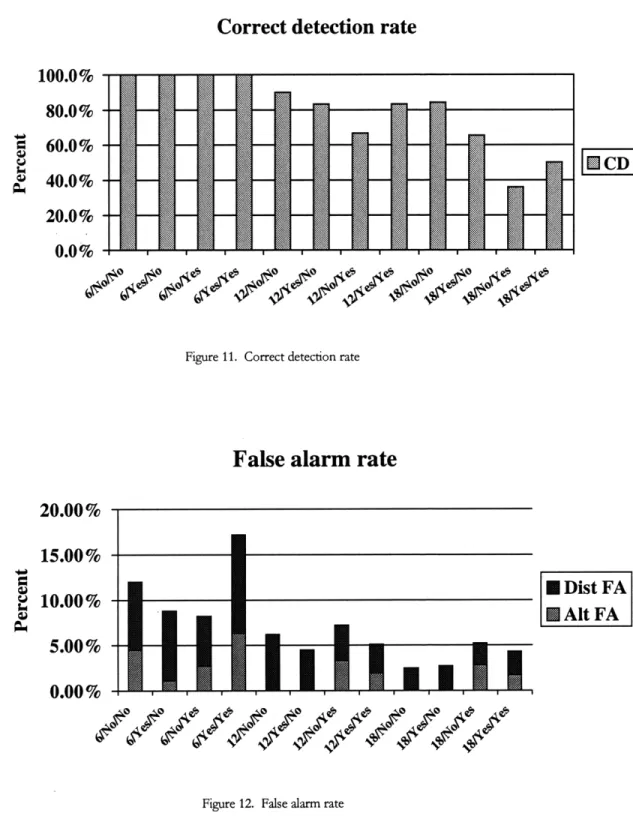
Figure 11. Correct detection rate... 43
Figure 12. False alarm rate... ... 43
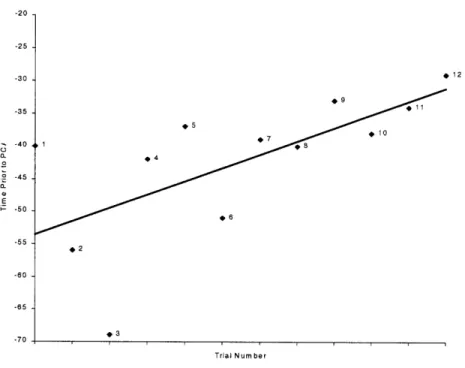
Figure 13. Detection lead times vs. trial number... ... 44
Figure 14. False alarm rate vs. detection lead time... ... 45
Figure 15. ROC for target tracking task... ... 46
Figure 16. Missed acceptance counts. ... .... ... 53
Figure 17. Acceptance lag tim es. ... 54
Figure 18. R O C curve... .... ... 55
Figure 19. Specific recall performance ... ... 56
Figure 20. Raw workload averages ... ... 57
Figure 21. Fixations vs. recall ... ... 58
Figure 22. Fixation categories. ... ... 59
ACKNOWLEDGMENTS
The author wishes to thank Prof. Sheridan for his guidance and support. It has been a privilege to work with and learn from someone of such great experience and insight. I also wish to thank Dr. Yan Yufik for his contributions to this research. His enthusiasm and contributions have been invaluable.
Thanks also goes to Sandy Lozito, whose sponsorship through NASA/Ames grant number NAG 2-729, is the reason this research exists at all.
Personal thanks go to all the professors I have learned from while here at M.I.T., including R. John Hansman, Jr., Jim Kuchar and Amadeo Odoni.
Finally I wish to thank my family, my friends and fellow students, including Michael Mashtare, Dr. Mary Christy, Todd Farley, Debbie Hyams, Lee Winder and all the rest of the ICAT group, as well as my fellow HMSLers.
Chapter 1
PERCEPTUAL CONCEPTS IN AIR TRAFFIC CONTROL
1.1 Introduction
Studying the concepts of cognitive psychology is essential to understanding not only why the air traffic control (ATC) system succeeds despite a very high degree of task difficulty and virtually no automation, but also how to safeguard that performance in the face of increasing automation and free flight concepts. There is still considerable debate about the nature of perception, attention, memory and comprehension. Models have been developed and tested which although not definitive, provide enough predictive capability to examine where cognitive limits are being pushed in a task such as air traffic control. This section will introduce these concepts, and show how they apply to ATC.
The experiments that form the basis of this thesis dealt only with the visual aspects of a target-tracking task like air traffic control. For this reason, the following discussion will focus on that aspect of perception. ATC is, however, both a visual and an aural task. Voice communications form at least as big a part of the task of the controller as the visual aspects. Not only do more errors originate from voice communication difficulties, but also the controller's situational awareness would be compromised without the information received in this manner.
The aural aspects of ATC are better understood than the visual aspects, however. Furthermore, many of the proposed changes to ATC will impact the displays the controllers use. There have been no conclusive studies on how controllers are able to perform their job, nor on what circumstances lead to errors. This deficit needs to be remedied in order for designers to be able to predict the impact of proposed changes.
1.2 Perception
The physical aspects of visual and aural sensation are known. Once the stimuli leave the sensory organ involved, however, there is little understanding. This is the area of concern, "the way in which we interpret the information gathered
(and processed) by the senses. In a word, we sense the presence of a stimulus, but we perceive what it is" (Levine and Sheffner, p.1).
This is not to say there are not sensory detection problems in ATC. Digits on the radar scope are unclear, the display is generally cluttered, and communications are garbled. These problems are mostly understood, however, and often easier to tackle than perception problems, given proper resources.
1.2.1 Visual perception
The message that reaches the visual cortex is a processed and summarized record of the original stimulus. The most important information (edges, contours, changes) is transmitted, while the steady-state information is omitted. This information is taken in during discrete fixations, interrupted by sweeps of the eye called saccades. The movement is fast (about 30-100 msec), although it takes about 200 msec for a fixation. Normal visual processes are mostly suppressed during saccades, as information received during an eye sweep would be blurry. Given these times, people are capable of about three or four visual cycles per second, although far less time is required to actually perceive visual scenes.
This feature can be demonstrated by examining our perception of lightning. Bolts of lighting generally consist of three or four component bolts of about one msec each, with a separation of about 50 msec, for a total of about 200 msec. How is it that we can examine a scene illuminated by lightning, and why does the illumination appear to fade instead of dissipating instantly? This is due to "visual persistence", the apparent persistence of the stimulation beyond its actual duration. Visual stimuli must be held in a memory register briefly. This register is referred to as "visual sensory memory."
Sperling (1963) tested the capacity and duration of this storage. Subjects were presented arrays of letters and digits for very brief durations (5 to 500 msec), then asked to report what they remembered from the display. Sperling found that four or five items were reported correctly.
Sperling then showed that more items were available but faded from visual sensory memory before they could be retrieved. Given three rows of four items each presented again very briefly, subjects could retrieve three out of four items on a row when prompted for a particular row after the display went off. Other tests showed that this "iconic" memory is erased by subsequent visual stimulation, such as a new icon or a very bright screen. This erasure was dubbed "interference," a term to which we will refer several times in this paper.
Once the image is observed and placed in visual sensory memory, it must be comprehended. The characteristics of comprehension are somewhat unclear. Reading is typically used as an example. "Template" matching (where one matches a template of what a particular letter looks like) and feature matching (where one matches the major features of a letter) arguments do not capture all aspects of recognition. Consider that when one reads sentence, one often fails to detect misspelled words (or even missing words, as is the case in the preceding clause - a missing "a" before "sentence"). Context and expectation significantly influence perception. This interpretation process is automatic, and is nearly indistinguishable from actual sensation.
1.2.2 Visual perception in air traffic control
As mentioned above, people are able to perceive large amounts of information in a very brief period of time. The data on the scope or the flight progress strip do not have to be present, or fixated upon, for very long for the information to be perceived. However, the presence of continuous interference in the form of new stimuli can prevent all this information from being interpreted and committed to long-term memory.
This is particularly important to our application. A radar display contains symbolic information (the aircraft target), spatial information (sector features, direction of flight, motion of the targets) and text information (identification, speed, altitude, etc.). Given brief glances at the target information, our understanding of memory suggests that controllers could not transfer information about aircraft to long-term memory. If consecutive fixations are very brief (<200 msec), it is unlikely that the controller can even identify what has been seen, since the iconic memory is being erased by interference from the succeeding fixation.
Controllers scan the scope, adding features of relevant information to their "picture" (also known as their mental model) of the traffic. The controller will use deep knowledge of the sector, aircraft characteristics and typical intentions to very quickly understand the situation. The scope appears hopelessly complicated
to untrained eyes, but controllers are able to discern features of importance with a short viewing. The perception of this information is almost completely automatic for the controller.
Subjects performing target tracking scan the scope, briefly fixating upon targets and/or target information. The information must be passed into short-term memory in order to be interpreted. I shall come back to what happens in
A large number of ATC errors are associated with misperceiving data. Some of this is due to attention, which will be discussed below, but many errors are due to applying context inappropriately. Controllers may interpret information incorrectly because of expectations, either failing to perceive the correct data, or inserting data that is not present. An example of this might be a slowed reaction time to detection of an overshooting final, or not initially noticing that an aircraft has continued ascent beyond its assigned altitude.
1.3 Attention
An item missing from the analysis above is attention. It is apparent that a great deal of information reaches the brain only to be discarded if not considered pertinent. This discrimination process is attention. An important result of the research in placing the attention process is that most of the limitations of processing associated with attention occur after the information is accrued in memory.
Early theories of attention (Welford, 1960; Broadbent, 1958) located the process between perception and memory. Later evidence placed attention after the accrual of information in memory, and these seem to hold up better under experimental scrutiny. Numerous experiments demonstrated a widespread and parallel access to memory systems by stimuli, with attention being the control of this information in memory (Keele and Neill, p. 41).
There are several results worth noting. In the first, Morton (1969) had people sort cards on the basis of the numerals 1 to 6, or numerosity of X marks ranging from one X to six Xs, or "redundant" numerals and numerosity (one 1, two 2s, etc). Subjects sorted faster in the redundant task than in either component alone. This finding was confirmed and expanded upon by Ellis and Chase (1971). Redundant information is perceived in parallel, and begins to accrue in memory. This accrual occurs faster given redundant information, resulting in reduced error, reaction time, or both.
The second experiment of note concerns irrelevant information. Numerous studies (Morgan and Alluisi, 1967; Well, 1971; Keele, 1972; and Egeth et al., 1972) demonstrated that some irrelevant information is processed to the memorial stage, but is discarded. Several studies (Garner, 1974; Kahneman, 1973; Lockhead, 1972) have shown that of the irrelevant information that is remembered, only irrelevant information that is integral to the stimulus affects accuracy, reaction time and recall. For instance, if the X-counting experiment above used complex faces instead of X's, reaction time would be slower than if normal X marks were used but a face were imprinted on the background of the task. The shape of the marks, although not important to the task, is integral to
the stimulus, while a separate background image is not. Integral information, even if irrelevant, is passed along to memory, while nonintegral information is not. This suggests that if the data tag contains information about an aircraft that is not needed to perform the task, its mere presence will affect performance, whereas the presence of other information on the scope display (such as navaids not involved with the aircraft) will not.
Another result of interest is that of activation (Posner and Snyder, 1975; Neely, 1977). Neely had subjects decide if two words, one shown after the other, were the same or different. The words were preceded by a priming word. Neely told his subjects that if bird appeared, to expect a word like "robin" or "sparrow" to appear next. If the word building appeared, the subject should expect a body part, like "arm" or "leg." The results showed that only when the prime was bird was there a benefit to priming.
This last result demonstrated that when a stimulus is received, information in memory associated with that stimulus is activated automatically. Stimuli received after this activation and associated with the activated memory benefit from better reaction time and accuracy. The converse is also true. Reaction time will suffer should a stimulus not associated with the activated memory be received (i.e. an unexpected signal).
The concept of automaticity is directly related to attention as well. Automatic processes, such as reading familiar words, hearing one's name, etc. consume no conscious resources. Those resources can be used to perform other tasks. Numerous automatic processes can be carried on at one time; walking while whistling is an example.
Conscious processes, on the other hand, require attention. They are either too unfamiliar or too complex to be automatic, and generally consume most of the available resources in the cognitive system. Multiple conscious processes can only occur simultaneously if they are very simple, although one can perform a number of automatic processes along with a conscious one (listening to the news on the radio while operating the directional signals, perhaps chewing gum and keeping your car on the road).
If all processes were automatic, there would be substantially less cognitive limitation to human processing. There are ways to make conscious processes automatic, however. This is obvious, since walking was once a conscious process for us all as children, yet now it is automatic. Practice is what transforms conscious processes into automatic ones. Humans can be taught extremely complex activities with practice (e.g. air traffic control). Many of the activities of
the controller are highly automated, one reason why controllers are fiercely protective of their procedures and displays.
1.4 Memory
1.4.1 Short-term memory
Miller (1956) is one of many researchers who showed that the span of immediate memory for a single stmulus dimension is about 7 items in length. For multiple stimulus dimensions the number is much larger. We can perceive large quantities of sensations, and we can hold vast amounts of information in our long-term memory, but immediate memory is the bottleneck in this information processing system.
Items can be grouped or "chunked" to stretch the limitation. In fact, given practice and a clever encoding scheme, people have been able to recall large numbers in order - 82 digits in work done by Chase and Ericsson (1982). This type of encoding is done with reference to very familiar (automatic) knowledge accrued in long-term memory. This concept is central to the experiments that are the subject of this thesis, and will be discussed in greater detail in a succeeding section.
Given enough time, almost anyone could memorize an 82-digit number. Often there is insufficient time or attention to apply a scheme to transfer the item to long-term memory. The natural assumption was that time, in the form of memory decay, was the significant factor. Waugh and Norman (1965), however, showed that interference was the primary factor, although the decay theory is difficult to test. Forgetting is strongly influenced by intervening items prior to transference to long-term memory.
Interestingly, Keppel and Underwood (1962) and Wickens (1972) also showed that previous trials in a remembering task influenced recall in current trials, a kind of proactive interference. New learning was disrupted by old knowledge. Another example of this is being taught that in Italian bathrooms "C" means "caldo" which means "hot", but forgetting and turning the wrong tap. If it were a completely different letter it is unlikely one would make the same mistake with
the same frequency.
Recall that attentive processes occur after the accrual of information in memory. The ability to process this information is then affected by redundancy, interference, activation, and automaticity. Understanding the expertise of the
checking in on a new frequency and having the aircraft "ident" their data tag on the scope is likely to have other benefits than just confirming identification and functionality. There are redundancy effects as well. The continuous interference of the numerous call signs, all of similar form, and of other information (altitude, speed, heading) may explain why it is difficult for controllers to recall that information (as seen in Endsley & Rodgers, 1996). Alternatively, it may explain why the form of the task has been developed to ensure that recall of this information is not necessary to its successful completion. Activation and the automaticity of many of the highly practiced tasks explain the speed with which controllers perform.
This does not clarify the purpose of short-term memory, however. To understand this, we need a broader model of short-term memory. Such a
concept was refined by Baddeley and Hitch (1974).
1.4.2 Working memory
The work by Baddeley and Hitch refined a concept that has been studied since about 1905, although the term "working memory" was not introduced until the late 1960s. Baddeley and Hitch attributed to working memory three systems: a
"ccentral executive", a "phonemic loop", and a "visuospatial scratch pad."
The evidence for the phonemic loop (or "articulatory rehearsal loop" or "phonological loop") was discovered when they observed that a concurrent memory load of three items did not impair free recall, comprehension, or reasoning tasks in subjects. The suggestion was that this process could be shunted to a separate process, a rehearsal loop that could store limited amounts of speech-like information. Note that the information does not have to be auditory, just speech-like. Other studies showed that visually presented verbal material could not be rehearsed (and hence not remembered) if the subject repeated out loud a word such as "the the the" or "hiya hiya hiya." It was also argued that the capacity was limited by how much a subject could verbalize in 2 seconds, seemingly the rate of decay of information from this system (Baddeley, Thomson, and Buchanan, 1975).
Salame and Baddeley (1982) proposed a further segmenting of this feature into a phonological store and a subvocal rehearsal loop. This explained the two-second verbalization limitation. Auditory stimuli would receive privileged access to the store, while visually presented verbal stimuli would be accessed through the rehearsal loop. Subsequent research by Baddeley (Baddeley et al., 1984; Baddeley, 1986; Vallar & Baddeley, 1984) supported these results. The two-second limitation was a limitation of the phonological store, but could be refreshed from the articulatory loop, if available. This loop, however, is unavailable when suppressed by articulation. So while we can hear and see while
we are talking, we cannot rehearse the verbal information and therefore cannot retain it for long.
The visuospatial system within working memory has been shown to have a similar structure. Experiments done by numerous researchers (Baddeley, Grant, Wight, & Thomson, 1975; Baddeley and Lieberman, 1980; Morris, 1987; Quinn & Ralston, 1986; Smyth, Pearson, & Pendelton, 1988; Beech, 1984; Logie, 1986; Quinn, 1988) confirmed the idea put forward by Baddeley and Hitch (1974). Overall, this body of work appears to demonstrate that the visuospatial system in working memory consists of a short-term store that is linked directly to the processes of visual perception, but that can be refreshed by spatial rehearsal. Irrelevant physical movements, such as waving arms or walking in place can suppress this rehearsal.
The central executive is the last component of this model of working memory. This component has been shown to have no storage capacity of its own, but instead serves as a "general attentional resource that (coordinates) the contributions of different storage subsystems" (Richardson, p. 22).
Some of the experiments to show this had subjects generate a random sequence of letters. The results of these are described by Baddeley (1990):
After about the first 15 or 20 letters, most people find the task becoming increasingly difficult, with the same few letters tending to crop up, and with a tendency for sequences to follow stereotyped patterns such as the alphabet, or familiar acronyms such as CIA,
VD and BBC ... If one systematically varies the rate at which the
subject is required to generate letters, then a very lawful pattern emerges, with the randomness increasing with the logarithm of the
time available ... Another way of manipulating the task is to vary
the number of alternatives, requiring the subject to generate on the basis of two, four, sixteen, or twenty-six letters. This leads to a systematic decrease in the rate at which letters are produced that levels off after about eight alternatives. This suggests that subjects can cope with up to about eight alternatives simultaneously, with smaller numbers of items allowing more attention and faster selection; once the system's capacity has been reached, adding further alternatives will not affect performance since the system will still be operating on its maximum of seven or eight options.
This task requires some organization and planning, which was the suggested function of the central executive. Other experiments have used this result to occupy the central executive and show its contribution in certain tasks.
1.4.3 Long-term memory
From the previous discussion of working memory, it seems obvious that our long-term memory system is significantly different from working or short-term memory. Its duration is much longer, and its capacity is much higher, both essentially infinite. Yet often recall of this information is time consuming or impossible. The strongest evidence for separate systems, however, is that in studies from brain-damaged patients long-term and short-term memory systems are affected separately from one another.
Two main theories of long-term memory have arisen. The first distinguishes "episodic" memory and "semantic" memory. Episodic memory is simple knowledge, events and facts. Semantic memory is knowledge that relates concepts and information, rules about language and general world knowledge. A second distinguishes implicit and explicit knowledge. The latter is more recent, and the distinction between implicit and explicit is of little value to the application of long-term memory to air traffic control.
1.4.4 Episodic memory
One important feature of episodic memory is the effect of rehearsal. While the specifics of the rehearsal mechanism have been debated, the basic concepts remain, and are fairly intuitive. Items rehearsed repeatedly, and elaboratively (using the meaning of an item rather than its form), are recalled better than those not repeated, or repeated in a maintenance-type manner. This latter type of rehearsal is characterized by the item usually not being recalled once rehearsal ceases, such as repeating a phone number until it is dialed. Elaborative rehearsal establishes context for the item and relationships between it and other items in long-term memory.
Another aspect of episodic memory is retrieval. It has been shown that items in long-term memory do not suffer decay over time. Affecting recall, however, are congruity, interference, and distinctiveness. These things can make items inaccessible, but not lost from memory. The current view holds that items in long-term memory cannot be lost, they remain there permanently, except in cases of physical damage to, or incapacitation of, the brain.
Congruity refers to the heightened ability of people to recall things, if told to recall them under the same conditions they remembered them. A simple example is when someone is asked to list the alphabet. If done in order, remembering is fast and easy since that is the way they were taught. Recall is much slower and more prone to errors if done in any other order. Other experiments have shown that when shown items as pictures, those items are
recalled more easily when presented with pictorial cues, rather than word cues or other types of cues. This is also referred to as the effect of "mode".
Distinctiveness has been shown to aid the recall of events as well. This refers to not only how remarkable a particular stimulus is, but to real-life dramatic events as well. Memory experts suggest that when we want to remember something, to think of a bizarre or distorted image of it, creating distinctiveness. Dramatic events, such as the Kennedy assassination and Challenger accident, have been shown to improve recall of information associated with the events.
1.4.5 Semantic memory
Episodic memory is insufficient, however, to accomplish human activity and understanding. If it were, computers would be able to perform all human function. The interrelation of information, the application of principles to situations, the extrapolation of meaning, in short the sum total of useful human function, requires semantic memory.
One attempt to understand semantic memory started back in the late 1960s, when Quillian (1969) constructed a semantic network, initially interested in teaching a computer to read a sentence. This idea of semantic memory as a network associating concepts to one another in memory has since been refined considerably, and has a great deal of merit in cognitive science. Baddeley (1990) suggests that it may be more of a modeling language than actually descriptive of physical memory. Despite concerns such as these, however, network techniques in cognitive modeling are extremely powerful and descriptive, and in many ways match the physical characteristics of the brain.
A competing model to Quillian's network is referred to as Bartlett's concept of schema. In 1932 Sir Frederic Bartlett proposed an interpretation of memory in which subjects used schemas to remember information. Little else was done with this until computers were developed to the point that they could help test Bartlett's theory. Marvin Minsky (1975), Rumelhart (1975), and Schank (1975) developed this theory along similar lines.
Schemas are packets of information, larger in scope than the nodes in the network model discussed above. They also can contain a wide range of information, from concrete items to very abstract concepts. A schema represents knowledge rather than definitions. Schemas are actively applied to perception to accomplish understanding.
This is by no means a complete description of episodic nor semantic memory. Several important theories and features have been omitted. I have attempted to
concentrate on those theories and features of direct relevance to air traffic control, which will be discussed shortly.
1.5 Situational awareness and mental models
So far I have described the disparate elements of how memory operates. These elements can be readily seen when dealing with relatively simple recall. Memory is of course used in accomplishing more complicated activities as well. Normal activity such as carrying on conversations, driving a car, playing sports or games, flying and controlling aircraft are all examples.
In analyzing how humans successfully accomplish these activities, the terms "situational awareness" and "mental models" have arisen. The most commonly accepted definition of situational awareness comes from Endsley (1988), who says it is the "perception of the elements in the environment within a volume of time and space, the comprehension of their meaning, and the projection of their status in the near future." A mental model is the representation of the task or object, including its properties, states and interrelationships with other objects or events. This model is within the mind of the subject, and is sometimes incomplete or inaccurate when compared with the actual task or object.
Situational awareness (SA) is a term that is used frequently in aviation. When a pilot or controller has good situational awareness, they have knowledge of all (or almost all) of the information required to make successful choices. One criticism of this concept is that the set of information required to make good choices can easily be considered nearly infinite. SA can be expanded to include nearly every element involved in a task, causing every error to be attributed to "poor SA". This approach does not lead to fruitful solutions.
Mental models have been used longer, and for a broader class of phenomena, than SA. Subjects develop a mental representation of the task, and use this to understand the data being received from the task, and to formulate action. Everyone has a mental model of their home, and could probably walk through most of it with their eyes closed. Positions of furniture are generally (perhaps not exactly) known. If we hear a sound from another room we can generally guess what it might be. Sometimes we may hear a sound we don't recognize, and upon finding it is coming from an open window, we add that sound (and its cause) to our mental model.
The two terms, then, overlap to some extent. Aviation researchers tend to use situational awareness, particularly when discussing a subject's recall of the environment. Cognitive researchers tend to use mental models, with recall being separate from the model. My approach will be the latter, since the task
accomplished during the experiment lends itself more naturally to mental models and recall.
Chapter 2
PERCEPTUAL GROUPING CONCEPTS
2.1 Introduction
Miller demonstrated that the span of immediate memory for one-dimensional stimuli is 7±2 items. One method to skirt that limitation is through clustering. Subjects in a study by Bousfield (1953) were asked to recall words from a long list. Rather than recall them in the order in which they were presented (or randomly), subjects recalled words in categories, such as "doctor, lawyer, fireman; fly, mosquito, spider; dog, cat, horse". Numerous experiments confirmed that this tendency is a necessary condition for long-term storage of information, and better organization led to better recall. Even in experiments using words apparently unrelated to one another, subjects would group items in some fashion to aid in remembering the items.
This grouping of unrelated items can be done in numerous ways. Making up sentences that include the words, forming images including the items and other mnemonics are all useful. These strategies are presented as methods to improve memory and recall, and have demonstrated startling results. Subjects trained in such methods can perform remarkable feats of memory, such as memorizing the contents of a magazine in 10 minutes. In such a magazine-remembering demonstration, the subject could recall all the details, including content and location, of any page called out at random.
Chunking is not limited to a conscious application of grouping schemes. If asked to recall a 22-letter sequence given only 2 seconds, most people would doubt their ability to accomplish this task. However, if that sequence is "TAKEMEOUTTOTHEBALLGAME", the task is a simple one. This type of chunking is automatic, using schemes that we have already internalized. The same can be done with any other type of information - a large set of lines that form the image of a house would be easier to recall than a random configuration.
It is not surprising, then, that grouping schemes have been found in a number of complex activities. Waiters and waitresses have been shown to have a specialized, automatic memorization scheme that helps them attribute orders to
spatial locations. Links were formed between orders and the spatial locations of patrons, allowing the waitperson to recall up to 8 orders (about 20 menu items). Chess players have also shown sophisticated yet internalized and automatic grouping strategies involving spatial relationships.
2.2 Object vs. space-based theories of attention
In order to understand perceptual organization, psychologists have examined how a person's attention is focused when viewing an object. Two main views of the process of attention have developed.
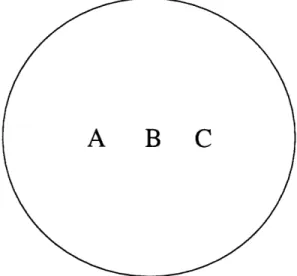
One view holds that attention is like a spotlight. A person's gaze tracks and holds on certain parts of a scene. Attention parses the perceived scene, and features within a certain radius of this focus are attended. Those outside are not. This locus of attention need not be "all-or-nothing". Generally comprehension of features decreases as the distance from the focus of attention increases, rather than sharply dropping off at some predefined radius. However, any items within the locus of attention are all attended. Figure 1 shows a configuration of three letters. Generally it would be impossible (under object-based theories of attention) to attend to "A" and "C" without also attending to "B".
Figure 1. Spotlight locus of attention.
Support for space-based theories comes from numerous experiments. Downing and Pinker (1985) showed that detection time for luminance changes increased as the distance from the focus of attention increased. Hoffman and
Nelson (1981) presented subjects with a four-letter display, with an open box superimposed on the image. The subjects were asked to determine which of two letters were not in the display, as well as the orientation of the box. Subjects were more accurate when the box was adjacent to the target letter. Similar support for space-based theories comes from LaBerge (1983), Podgorny and Shepard (1983) and Posner, Snyder and Davidson (1980).
In contrast to space-based attention is object-based attention. This theory assumes that attention is focused on one or more objects in the scene, regardless of location within the scene. Duncan (1984) superimposed two images, then asked subjects in one case to report two attributes of one object, or one attribute of each object in another case. Subjects were more accurate reporting two attributes of one object, despite both objects being within the locus of attention. Neisser and Becklen overlapped two sequences on videotape, then asked subjects to view the tapes and report any anomalous events in one or the other of the sequences. For example, if the video showed a pair of hands clapping
superimposed on a group of people playing catch, an anomalous event would be one of the subjects leaving and returning. Subjects performed very well in this task, but rarely noticed anomalous events in the unattended sequence.
Ongoing research by Kanwisher (1999, personal conversation) has identified specific regions of the brain that activate when a face is presented. This region is activated only for faces, not for other objects such as houses. During this
experiment subjects were presented with independent images in either eye. The "faciform" region of the brain would activate and deactivate as the subject's attention switched between the two images, both of which were being received by the brain. Subjects reported the same phenomenon, that of one image switching with the other, similar to the effect of a Necker cube.
While these results do not completely contradict space-based theories, they do show that there is at least some object-based influence to attention.
2.3 Bottom-up vs. top-down
If perceptual objects influence our attention, what determines the form of the perceptual object? Perceptual organization has long been considered a purely stimulus-driven, bottom-up process. This means that organization is influenced by the image properties alone, regardless of the goals of the task or the relative importance of the features. Typical features regarded as important are proximity, similarity, common motion, symmetry and good form ("Prignanz").
2.3.1 Gistalt psychology
One of the original Gestalt psychologists was Max Wertheimer. He published a very influential paper in 1923 that laid the framework for the Gestalt movement. Gestaltists believe that we do not experience a number of things, but rather larger, interrelated wholes.
Wertheimer's original examples used dots. When we see a picture such as that shown below, it is natural to see the dots as being grouped. In fact, it can be difficult to see them any other way. This figure demonstrates what Wertheimer called the "Factor of Proximity." In this case the dots close to one another are grouped.
, * * .** * (V)
Figure 2. Factor of proximity (Wertheimer, 1923).
The second factor is the "Factor of Similarity". If we take the same dots, space them equally, but change their color or shape, we again see grouping. One tends to group like objects together. This similarity factor is affected by the magnitude of dissimilarity as well. So if some of the dots were white, some black, and some shades of red, the shades of red would tend to be grouped together. If they were all shades of red, however, the different shades would be grouped separately.
00
*006
00 *O O
oo00
a
(xi)
Figure 3. Factor of similarity (Wertheimer, 1923).
If we take a group of dots, and shift several of them suddenly, the grouping of those dots may change in response. If they were previously grouped by proximity, the dots may subsequently be grouped according to shift in position. This is referred to as the "Factor of Common Fate" or "Uniform Density".
There are other factors as well. They all have one thing in common: certain arrangements are more compelling than other arrangements. Our perception of a scene is powerfully influenced by Gestalt factors.
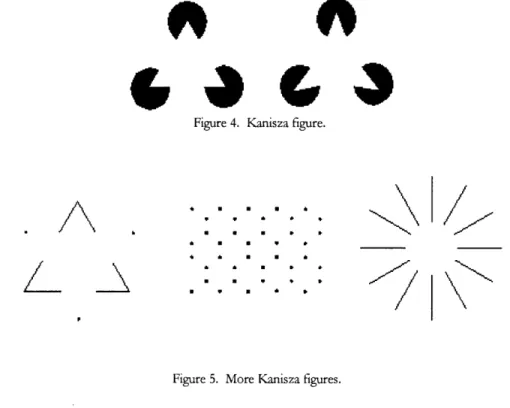
Kanizsa figures provide further evidence for the power of this grouping mechanism. We can see triangles and circles in figures 4 and 5 where none exist, because our brains fill in the missing information. When creating a sphere on a computer screen, the three-dimensional look is supplied by subtle and continuous shading. The human viewing this sphere would not see the continuous color shading that actually exists, but rather small polygons of equal shading separated by dark lines. These dark lines are our mind inserting edges where none exist; this illusion is well known within the discipline of computer graphics.
Figure 4. Kanisza figure.
Figure 5. More Kanisza figures.
Gestalt factors are, therefore, very commonly used in imparting structure on a visual task. In many cases they are automatic, and difficult or impossible to alter.
Some of the factors that regulate grouping are top-down or imposed somehow on the stimulus. Wertheimer included "past experience or habit" as one of the factors involved in grouping. Through training or experience, subjects could come to see patterns contrary to the Gestalt factors mentioned above. Proshansky and Murphy (1942) showed that subjects could change their perception of lines when the punishment/reward system was changed. There has been a large body of work following along the lines of the famous Pavlov's dog
experiment that showed subjects, when shown a pair of stimuli together frequently enough, would actually see both stimuli when presented with only one. Bruner (1947) showed that social and cultural factors, and even age, impacts perception of organization. Bruner (1949) also showed that while incongruity factors (such as playing cards where the suit colors were reversed) caused an increase in reaction time, once the subject expected incongruity this delay was eliminated.
The fact that one can intentionally switch attention when viewing a Necker cube is another example of this. Given a goal and proper training, perceptual organization can be influenced.
2.4 Perceptual group formation
Pylyshyn and Storm (1988) had subjects visually track a small number of target objects moving about a display among a number of identical non-target objects. At various times an object would flash and the subject would have to identify it as either target or non-target. Despite this task being highly demanding, subjects correctly identified over 90% of the objects. Further experiments showed that this result was inconsistent with the "spotlight" theory of attention. The conclusion was that the targets were being cognitively "indexed", allowing tracking independently of the visual task.
Yantis (1992) proposed that the targets are attended, but that they are grouped into a virtual object. It is this virtual object which is tracked. A similar experiment was performed, but the ability to group the targets into a virtual object was varied.
Previous work had determined that formation of virtual objects is a two-step process. The initial formation of the virtual object is stimulus-driven, controlled by the same bottom-up factors mentioned earlier (proximity, similarity, common motion, symmetry, Pragnanz). Once the object is formed, it must be maintained by reviewing the configuration of elements and updating the object if necessary.
Yantis first varied the factors that influence formation. Significant improvement in the task occurred, but only in the early trials. Subjects eventually learned to efficiently group targets, even when they were configured randomly. A next set of experiments varied the factors that control maintenance of the virtual object. Performance improved when maintenance was simplified. These results validate the earlier suggestion that perceptual grouping can be influenced by the objectives of the task. Subjects were able to track a virtual object from within a random configuration of identical elements.
ATC is in some respects a target-tracking task. As such perceptual grouping should play a significant role. Means et al. (1988) found evidence that aircraft are grouped in memory with related aircraft. Other research has suggested aircraft are recalled with respect to the sector, indicating a space-based attentional scheme.
Dougherty et al. (1997) conducted experiments to test the source of groupings in ATC. Controllers were run through an air traffic simulator, which was stopped at random intervals. Subjects then attempted to recreate the position and information of the targets on a map.
To demonstrate the presence of groupings, the subjects were videotaped performing the recall task to obtain timing information. Previous cognitive research has shown that if items are perceptually grouped, recall of one item facilitates recall of the other members of the group, resulting in decreased recall times. An example of this concept is if one were asked to list all possible first names. It is likely that the names of friends and acquaintances would be recalled in rapid succession, followed by a pause as other groups of people are recalled.
No such clusters appeared for the controllers in this task, suggesting that no aircraft-to-aircraft links exist. Although accuracy of recall was not reported for this experiment, it has been shown to be excellent in previous experiments. Controllers placed 95% of the aircraft in their sector within 10 nautical miles of their actual position in an experiment by Means et al. (1988). Recall was 90% in a study by Gronlund, Dougherty et al. (1997), most placed within 2.5 cm of their actual position. Gronlund, Ohrt, et al. (1997) found a 79.6% recall rate, with an average miss distance of about 9.6 nautical miles. Controllers reported an average of 8 aircraft (out of an average of 12.8 visible) with a mean distance error of 9.6 miles in an experiment by Endsley and Rogers (1996).
Since there were on average 14 aircraft in the sector in most of the aforementioned experiments, it is unlikely that this recall is due to strict memorization. Furthermore, the normal workloads of a controller would hinder memorization. An alternate suggestion is that there are aircraft to sector links that guide retrieval, although no suggestions for how this mechanism might work have been forwarded as yet.
One difficulty in using recall information to determine perceptual grouping in ATC tasks is the inability of subjects to remember the details being asked. In Means et al. (1988), controllers could associate aircraft types to call sign with a 28% accuracy. For ground speeds, recall was only 6%. Subjects in the Gronlund,
Ohrt, et al. (1998) study recalled 56.5% of the altitudes and 20.6% of the speeds of traffic in their sector. Endsley and Rogers' (1996) subjects identified the numerical part of the callsign with 38.4% accuracy, the correct altitude for 59.7%
of the aircraft, groundspeed for 28%, correct heading for 48.4% and reported whether the aircraft was in a turn with only 35.1% accuracy. However, controllers reported correctly 73.8% of the initial alphabetical part of the aircraft callsign (which indicates the operating company) and reported the control level (whether the aircraft was in their sector, about to be in their sector, etc.) also with
73.8% accuracy.
The better accuracy for altitude, control level and at least part of the call sign suggests that there are some details controllers recall better than others. Yet these details are all found in the data tag, at or near the iconic representation of the aircraft. If spotlight theories of attention are correct, there should be little or no difference in recall between these pieces of information. There is, therefore, some object-based attentional selection occurring.
Chapter 3
EYE MOVEMENTS
3.1 Introduction
From the results of Dougherty at al. (1997), it was found that recall-timing tests normally used to determine perceptual groups were ineffective. The finding that certain pieces of information were recalled fairly well, while others were not recalled suggests, however, that there is some clustering of the targets. An alternative method of determining conflicts is to examine eye movements. As will be shown, fixations on targets are, in the words of Stark & Choi (1996),
"repetitive and idiosyncratic to a particular picture and to a particular subject."
3.2 Eye movement basics
Eye movements can be separated into a sequence of fixations and the movements between those fixations, called saccades. Most information is perceived from foveal vision, high-resolution (approximately one-half arc-minute) vision with a small field of view (approximately one-half degree). Peripheral vision, on the other hand, has 120 to 180 degrees field of view, but is sensitive
only to flickering lights and motion.
Each aspect of vision can transmit about 40K bits per second. Foveal vision has fewer pixels but a (relatively) high bits per pixel, while peripheral vision has many pixels but generally only one bit per pixel. Given these limits, in order for a person to perceive a complex scene and extract information from it, a sequence
of fixations and saccades must occur. A normal scene contains items of interest areas of little interest or content. Some items of interest must be viewed for a period of time to process the level of detail required.
Each of these fixations imparts a piece of the scene to the brain. This is a rather sparse sampling of the information contained in the entire visual scene. In the lightning example given earlier, a very brief exposure to a scene still provides a sense of visual completeness to the subject. The subject, and each of us in everyday life, sees the "whole" world before us, even though only a small fraction of the information available reaches our brain. Stark & Choi (1996) refers to this as the "illusion of completeness".
3.3 Scanpath
If only a small part of the scene is actually viewed, there must be a mechanism for selecting what parts of the scene to view. One would expect to find the eye fixating on some area of interest, move to another, then another, and so on until as much as possible of the scene is viewed. This turns out not to be the case.
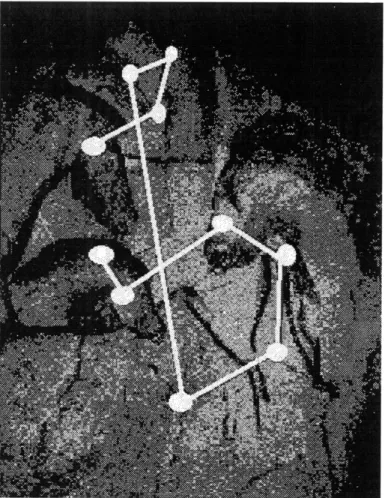
Noton and Stark (1971) showed that these sequences of fixations were "idiosyncratic" and "repetitive". Subjects' eye movements when viewing a scene showed repeated fixations on particular items of interest, and a pattern for revisiting those items which was different for different subjects, but generally consistent for an individual subject. An example of a scanpath is seen in figure 6. The white ovals are fixations, the white lines are saccades. If the same subject viewed this picture again, or a similar picture, the scanpath would be very similar.
If a different subject viewed it, the same features would be viewed, but the
scanpath would be different.
One opinion holds that features of the stimulus control fixations. Our eye is drawn to areas of contrast or some other objective criteria that is distinct from the object as a whole, or the goal of our viewing. The scanpath theory holds that an internal model of the object directs fixations. Fixations are a method of comparing and updating the model. The "illusion of completeness" that we have of the world being viewed is formed from the internal model and the sampling achieved by the scanpath.
Further support for the scanpath theory comes from viewing of ambiguous figures. Ambiguous figures are pictures which "switch" from one picture to another when viewed. Ellis and Stark (1978) showed that when attention shifted from one figure to another (such as from the vase to the opposing faces in figure 7), the scanpath changed as well.
Figure 7. Ambiguous figure.
The most convincing evidence comes from Brandt et al. (1989). Subjects viewed three different patterns of Xs, then were first asked to visualize the patterns on a blank screen, then draw the patterns on a blank screen. Similarity analysis of the visualized object's scanpath showed strong agreement with the scanpath of the viewed patterns. No stimulus was available to the eye or brain when visualizing, yet nearly the same scanpath resulted, confirming that a top-down cognitive model was the source.
Chapter 4
SUPERVISORY CONTROL CONCEPTS
4.1 Introduction
In a strict sense, air traffic control falls in the realm of manual control. No control loops are closed by automation, so that if the controller walks away from the scope, all control actions stop. There is significant processing of data by the computers, but they perform no actions on the aircraft. In a looser sense, however, the controller does act in a supervisory control role. Sheridan (1992) defined five basic supervisory functions as:
1. planning
2. teaching/programming 3. monitoring/detect failures 4. intervening
5. learning from experience
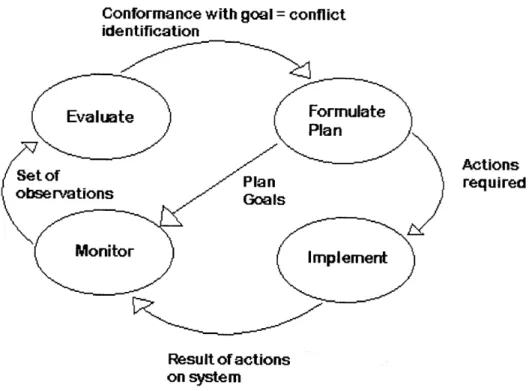
While these were meant to refer to automation (in the cases of 2, 3, and 4), they can equally apply to a process. Figure 8 is taken from a report on air traffic control complexity (Wyndemere, 1996). Note the similarities between this figure and Sheridan's five basic functions.
Conformance with goal = conflict identification Actions required Result of actions on system
Figure 8. Mental and physical processes required in ATC.
An analogy can be made between the teaching/programming function and the controller's sometimes-subtle interaction with other agents in the air traffic control system. In performing his/her duties, the controller informs (often implicitly) the other agents what the plan is for each aircraft to arrive at their goal state (landing at an airport, climbing/descending, traversing a sector to a fix, etc.). The controller automates the process of controlling to some extent by distributing information (either directly through instructions or comments, or via the fact that much of the information is shared through the party-line nature of the communications system).
The controller does not have control-performing automation to monitor. The conflict detection process, and the need for the controller to monitor compliance to instructions, can be substituted for this however. Controllers issue instructions, require the pilot to read back the instructions, and monitor the pilot's compliance to those instructions.
The controller also does not need to intervene in the sense of supplementing or taking over automatic control activities. The controller does need, however, to intervene in the normal sequence of events to prevent conflicts or increase efficiency.
So it is in this sense that we apply supervisory control concepts to air traffic control. Although there is no control-producing automation (at least not yet), the human interacts with the process in much the same way as a human operator interacts with automation. The analyses normally applied to automation can be applied to the human.
4.2 Workload and complexity
In describing the difficulty of a complex task, researchers try to define the terms "complexity" and "workload". There is some difficulty in ascribing objective values to these terms when evaluating tasks such as air traffic control. Complexity is independent of the subject, and can be viewed as a function of the number of states or possible events attributable to the task. Workload is usually broken into the amount of physical work being accomplished (physical workload) and the amount of cognitive work being accomplished (mental workload).
Mental workload has been very difficult to measure. Objective measures are task dependent, and their accuracy relies on our ability to understand what makes a task difficult mentally. Subjective measures are somewhat more reliable, and different scales have been developed. One such scale commonly used in aviation is a Cooper-Harper scale. This was used to evaluate the controllability of new aircraft designs. The subject would follow a decision tree, answering questions about errors, ability to perform the task, and mental workload to attribute a number to the mental workload. This scale has been modified for use in numerous other experiments. Sheridan and Simpson (1979) developed a three-dimensional scale, which separated out "time load", "mental effort load" and "stress load". The subject chooses the description which best fits their experience to come up with a rating in each category. This scale was used in the experiment described in the following sections.
The experiments which follow were intended to test subjects' ability to monitor conflicts and perform secondary tasks when confronted with high workload situations. Sheridan (1992) showed that as workload increases, performance does not degrade significantly, up to a point. Beyond that, very small increases in workload cause precipitous decreases in performance. Additionally, at very high workload situations, subjects begin to adopt an attention-switching strategy. In this situation they are no longer able to perform the task in an orderly fashion, but tend to "sample" the task, and performance
suffers as a result. Conversely, if workload is too low, vigilance suffers and performance also declines.
4.3 ROC analysis
Of particular interest in this paper is the application of the receiver operating characteristic (ROC) curve from signal-detection theory. This has been discussed and used in the context of human supervisory control for several years (see Sheridan, 1992; Kuchar, 1995).
In this analysis, one normally would crossplot the probability of having a false alarm (an alert issued when none is required), against the probability of having a missed detection (no alert issued when one is required). The result is a receiver operating characteristic (ROC) curve. The curve demonstrates a tradeoff between increasing correct detections and false alarms. For example, in a purely guessing strategy, the ROC would be a straight line connecting (0,0) with (1,1). As the system improves, the center of the curve distends towards the (0,1) point (upper left corner). This point is where we would have perfect correct detections and zero false alarms. The closer one gets to this point, the better the alerting system.
In automated alerting systems, only improving the sensors can modify the curve. In the human context, the curve can be improved through training, altering procedures, using different controllers, or other ways of modifying the conditions of the task or the human operator. The point on the curve at which one operates, however, can generally be changed easily. In an automated system, changing alert thresholds would accomplish this. For a human-based system, altering the rewards/penalties for alerting should cause the operating point to shift.
Chapter 5
TARGET TRACKING EXPERIMENTS
5.1 Introduction
Given the substantial evidence that top-down perceptual organization occurs in accomplishing complex tasks, and that eye movement is indicative of this organization, it was endeavored to examine whether this organization could be captured in an experimental setting. A first experiment manipulated factors which were expected to affect workload to determine if those factors might be a basis for clustering. A second experiment used an eye-tracking device to detect cognitive groupings. If air traffic controllers were perceptually organizing traffic, then the ease with which this organization occurs should impact task performance.
As noted earlier, previous attempts using recall techniques to capture perceptual grouping have been inconclusive. It was surmised that this is due to the generally poor level of recall of details often asked in recall questionnaires. If this is the case, recall may be poor, while task performance should remain good.
5.2 Experiment 1
The first experiment described below was an effort to examine recall and performance levels, and to establish elements of complexity to be examined as potential grouping criteria.
5.2.1 Setup and design
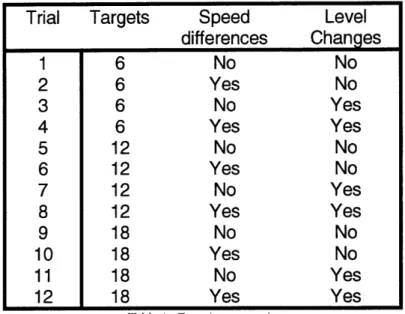
The experiments were run on a 486-based PC using a target-tracking program written by the author in C/C++. A typical screen is shown in figure 9. Each cycle the screen was updated and all targets moved. A cycle was a program timeout of 1000 msec, although the actual event time was slightly less (approximately 990 msec) due to the way Microsoft Windows processes these timeout events.
Figure 9. Experiment 1 screen shot.
The subject's task was to accept targets as they appeared on the screen (by using the mouse to select the target and pressing the "A" key), "handoff" the targets before they left the screen (by using the mouse to select the target and pressing the "H" key), and monitor for conflicts. A conflict was defined as any targets within 10 levels of each other that would touch as they traversed the screen. For instance, if one target was at level 200 and another was at level 190, and the subject believed they were going to collide on the screen eventually, he would select the two targets as a conflict (by using the mouse to select the two targets and pressing "C"). The subject was also asked to deselect pairs no longer in danger of conflicting, but this instruction was routinely ignored and was removed from the analysis.
This latter finding may be of interest if studied further. There may be a distinction between tracking an individual target and a combined pair of targets, and it may be difficult to focus on the two things simultaneously. In other words, if the subject was supposed to track only pairs of potentially conflicting aircraft, it may be easy to do. However here the subject was supposed to track individual aircraft (accepting, handing off, watching for conflicts), and it may be difficult to combine tracking individual targets with pairs of targets.
--- - -- --- -- 5 r*h • is i ls to : + moi zo r4+ * us In~£+s:, .IU)r:-Ml;i*ii-Y ~~~~ ~~-~-~~ ~~~~-~~~~~~-~~-~~~~~ ;;..-..B i~l l ;~ ~: : :: .-- - ... . ... .. _---+_ j