Supporting Information
for Adv. Sustainable Syst., DOI: 10.1002/adsu.201900101
Polydopamine Nanoparticle Doped Nanofluid for Solar
Thermal Energy Collector Efficiency Increase
Daniel Hauser, Lukas Steinmetz, Sandor Balog, Patricia
Taladriz-Blanco, Dedy Septiadi, Bodo D. Wilts, Alke
Petri-Fink, and Barbara Rothen-Rutishauser*
1
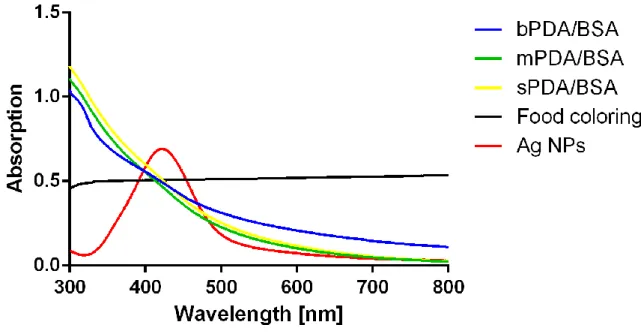
Figure S1. Absorbance spectra of the used NP suspensions: bPDA/BSA NPs (blue line),
mPDA/BSA NPs (green line), sPDA/BSA NPs (yellow line), food coloring (black line) and Ag NPs (red line). The PDA/BSA and Ag NPs are at a concentration of approx. 1 mg/mL while the food coloring is a commercial product with unknown concentration.
2
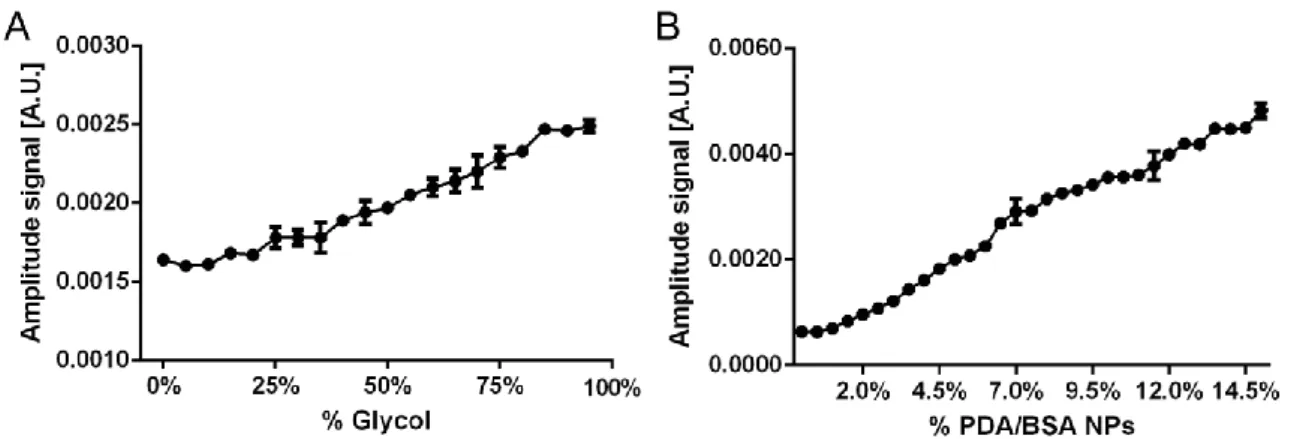
Figure S2. (A) Amplitude signal of 250 g/mL bPDA/BSA NP suspension with increasing percentage of glycol. Mean with SD; N = 3. (B) Amplitude signal of bPDA/BSA NP
3
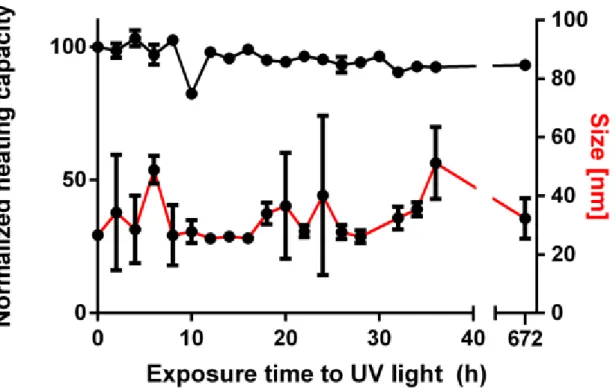
Figure S3. Normalized heating ability (black line) and size (red line) of a sample of
bPDA/BSA NPs after being subjected to an UV lamp for a prolonged time (i.e. 672h). The energy to which the bPDA/BSA NPs were subjected to equals the mean energy reaching Switzerland in 6.5 years.
4
Figure S4. (A) 3D rendering of the home-made flow circuit and photograph of the actual
system (B) with pump (1), reservoir with adjacent temperature sensor (2), flow sensor (3), 3D printed flow chamber (4), solar simulator (5) and power supply (6); inset: CAD model used to 3D print the flow chamber.
5
6
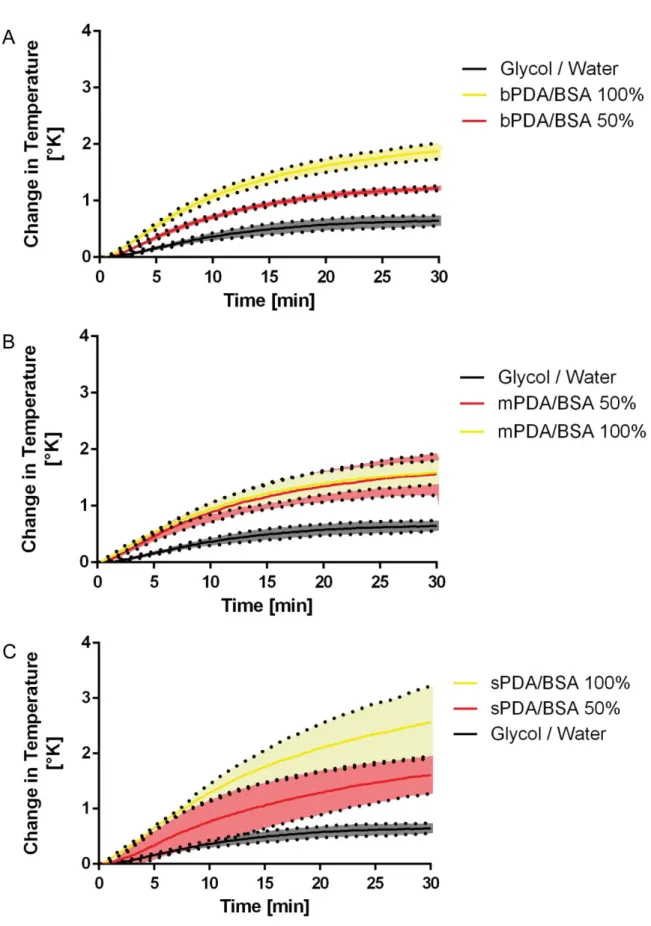
Figure S6. (A) Change in temperature for 100% concentrated bPDA/BSA NPs (yellow line),
50% (i.e. 50% of the NP concentration) concentrated bPDA/BSA NPs (red line) and glycol / water mixture (black line). (B) Change in temperature for 100% concentrated mPDA/BSA NPs (yellow line), 50% concentrated mPDA/BSA NPs (red line) and glycol / water mixture (black line). (C) Change in temperature for 100% concentrated sPDA/BSA NPs (yellow line), 50% concentrated sPDA/BSA NPs (red line) and glycol / water mixture (black line). N ≥ 3, dotted lines = SD.
C
D
E
7
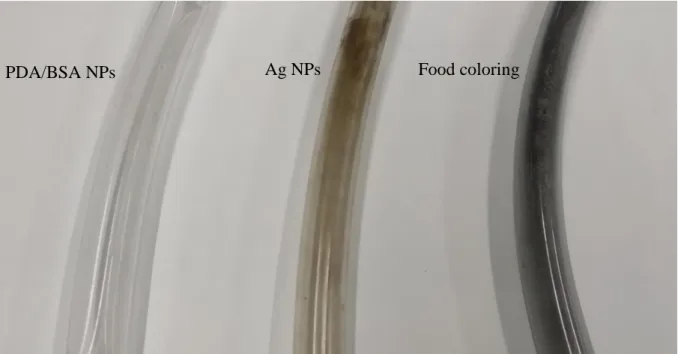
Figure S7. Tubing after experimentation with PDA/BSA NP suspensions (left), Ag NP