HAL Id: hal-02993865
https://hal.archives-ouvertes.fr/hal-02993865
Submitted on 7 Nov 2020
HAL is a multi-disciplinary open access
archive for the deposit and dissemination of
sci-entific research documents, whether they are
pub-lished or not. The documents may come from
teaching and research institutions in France or
abroad, or from public or private research centers.
L’archive ouverte pluridisciplinaire HAL, est
destinée au dépôt et à la diffusion de documents
scientifiques de niveau recherche, publiés ou non,
émanant des établissements d’enseignement et de
recherche français ou étrangers, des laboratoires
publics ou privés.
Emission of Gas and Al2O3 Smoke in Gas–Al Particle
Deflagration: Experiments and Emission Modeling for
Explosive Fireballs
Isabelle Ranc-Darbord, Gérard Baudin, Marc Genetier, David Ramel, Pierre
Vasseur, Julien Legrand, Vincent Pina
To cite this version:
Isabelle Ranc-Darbord, Gérard Baudin, Marc Genetier, David Ramel, Pierre Vasseur, et al.. Emission
of Gas and Al2O3 Smoke in Gas–Al Particle Deflagration: Experiments and Emission Modeling for
Explosive Fireballs. International Journal of Thermophysics, 2018, 39, pp.36 (28). �hal-02993865�
Emission of gas and Al
2O
3smoke in gas-Al particle deflagration:
experiments and emission modeling for explosive fireballs
Isabelle Ranc-Darbord
1,a), Gérard Baudin
2, Marc Genetier
2,
David
Ramel
1,b), Pierre Vasseur
1,c), Julien Legrand
2, Vincent Pina
11Laboratoire Energétique Mécanique Electromagnétisme, UPL, Univ Paris Nanterre 50 rue de Sèvres, 92410, , FRANCE 33(0)1 40 97 48 71
2CEA, DAM, GRAMAT, F-46500, GRAMAT, FRANCE
Emission of gas and Al2O3 smoke within the deflagration of H2-O2-{N2-CO2}-Al particles has been studied
in a closed combustion chamber at pressures of up to 18bar and at gas temperatures of up to 3700K. Measurements of radiance intensity were carried out using a 5 wavelength pyrometer (0.660, 0.850, 1.083, 1.260, 1.481µm) and a grating spectrometer in the range (4.10
-
4.30)µm. In order to characterize the aluminum-oxide smoke size and temperature, an inversion method has been developed based on the radiation transfer equation and using pyrometer measurements and thermochemical calculations of Al2O3 smoke volume fractions. Temperaturesin combustion gas have been determined using a method based on the assumed blackbody head of the 4.26 µm CO2 emission line and on its spectral shift with pressure and temperature. For validation purpose, this method has
been applied to measurements obtained when calibrated alumina particles are injected in a combustion chamber prior to gaseous deflagrations. This mathematical inversion method was developed to investigate explosive fireballs.
Symbols
particle diameter (µm) volume fraction
spectral absorption coefficient (m-1)
k absorptive part of the complex refractive index spectral radiance (W.m-2.sr-1.µm-1)
spectral blackbody radiance m complex refractive index
n refractive part of the complex refractive index P pressure (bar)
T temperature (K)
x molar fraction or abscissa
c)current address: EDF-France 10/12 rue James Watt 93285 SAINT-DENIS CEDEX, FRANCE
Greek letters
emissivity
extinction coefficient
scattering coefficient or standard deviation wavelength (µm)
I. INTRODUCTION
Detonation of solid high explosives (HE) is a supersonic reactive shockwave propagating at high velocities (6km/s to 9km/s) which converts the solid explosives into detonation products (DP) composed of gases and particles (aluminum, carbon, etc.) at high pressures, 20
GPa
to 40GPa,
and high temperatures (3000K to 5000K)
. Chemical reactions behind the detonation front are very fast (a few nanoseconds). Its chemical energy is released in a thin reaction zone (less than 1mm for many HE) leading to a high-temperature high-pressure peak. This peak is then followed by a release wave along which pressure and temperature drop down. The interaction between the detonation wave with the surrounding air generates both a shockwave and a release wave which propagates respectively in air and in DP. At the early stage of the DP expansion in air, the shock-heated air is warmed enough so as to be ionized. Many authors consider the fireball to be the DP air interface [1-2]. Due to the strong radiations of the ionized air, this fireball cannot be observed in the visible range, even by fast-speed color cameras, at the beginning of DP expansion in air. As the shock wave propagates in air far from the explosive charge, its pressure and temperature decrease. Then, the fireball becomes visible on fast-speed videos when air ionization stops. A selection of photographs, extracted from a fast-speed video recording of a fireball created by the detonation of a 0.385kg spherical HMX pressed charge, is presented on Fig. 1. It illustrates the fireball expansion and the air-shock propagation at a rate of 30 000fps. At the early stage of expansion (66 s), the photon emission of ionized air saturates the camera so that the fireball is not visible. Concentrations of the main species in the fireball determined through real gas thermochemical equilibrium computations (CHEETAH code / BKW-C equation of state) are 3.7mol/kg of explosive for N2, 2.1mol/kg for H2O, 1.4mol/kg for CO2, 2.8mol/kg for COand 1.6mol/kg for H2. Solid carbon appears at large fireball expansions. The fireball velocity is around 8
k
m/s atFIG. 1: Evolution of the fireball of a 0.385 kg spherical charge of pressed HMX charge ( 0 ~1860 kg/m3), high-speed video at 30 000 fps, at exposure time 1/253000 s and 1/266000 s (zoom) on the same experiment, performed at CEA Gramat. The background grid is 5 cm.
In the case of an explosion in a closed vessel, secondary shock waves reflect on the walls of the vessel at high velocities, leading to a homogeneous pressure after several reflections, contrary to the temperature field which keeps in memory the temperature field in the vessel for the time period of the first few milliseconds. It is also known that a secondary turbulent combustion occurs between air and the DP due to the presence of particles (carbon and aluminum), H2, CO and hydrocarbon components within the DP. High-speed videos of the explosion
of a melt-cast TNT spherical charge inside a small scale bunker suggest the inhomogeneity of temperature [2]. Due to limited knowledge of this secondary combustion, its modeling has been difficult. Hence, experimental data are necessary to discriminate different models in literature. Generally, measurements focus on overpressures in air and luminance temperatures.
To obtain real temperatures or to simulate fireball radiation, thermal radiation properties are necessary: the spectral absorption-scattering coefficients in the pressure and temperature ranges achieved during DP expansion. Chapman-Jouguet isentropic curve calculations [3] obtained with the CHEETAH code suggests that DP have
milliseconds after detonation. In these conditions, typical aluminum concentrations before combustion are less than 400 g/m3.
The dominant gases in the DP are listed in Table 1together with their main absorption lines, given by currently used databases, Hitran [4-5], Hitemp [6] and CDSD [7]. These databases were developed for temperatures up to 5000K for CO2 in Hitemp and CDSD, but at ambient pressure only. The dominant DP species emitting in the
spectral range of interest (visible-IR) associated to fireball thermal effects are H2O, CO2, CO, solid carbon,
aluminum and alumina. The problem then becomes more complex when aluminum is present in HE.
TABLE 1: Band location (wavelength) of the main absorption lines [8]
Species up to 5µm
N2 4.30µm
CO 4.70µm 2.35µm
CO2 4.26µm 2.70µm 2.00µm
H2O 2.70µm 1.87µm 1.38µm 0.96µm 0.82µm 0.72µm 0.65µm 0.59µm
AlO 0.464µm 0.486µm 0.507µm (three main) Al particles Continuous spectrum
Al2O3 particles Continuous spectrum
Solid C particles Continuous spectrum
The objectives of this work are (i) to understand how aluminum combustion and aluminum oxide smoke contribute to the radiation in the pressure range of 1
bar to
18bar and at gas temperatures of up to 3700K, (ii) to measure pressure-temperature state of DP in these ranges in order to validate thermochemical computations. By limiting the study to the visible-near infrared 520nm to 1480nm range (VIS-nIR) and to the infrared 4.1µm to 4.3µm range (IR), the dominant radiation effects are those of CO2 and Al2O3 smoke. In this study, CO2 and Al2O3particles are heated by a controlled H2-O2-diluent deflagration propagating inside a cylindrical closed combustion
chamber at pressures up to 18bar and gas temperatures of up to 3700K. The diluents are N2 and CO2.
II. REVIEW ON WORKS DEDICATED TO AL2O3 SMOKE IN GAS-AL DEFLAGRATION
Many studies on aluminum particle combustion characteristics have been published[9-11]. Nevertheless, all of them dealt with lower pressures than the pressure range of this work. Badiola et al [9] studied the combustion characteristics of 1
µm
to 22 m aluminum particles in O2/N2 mixtures using pyrometry. Zhu et al. [10] studiedaluminum powder in CO2/O2 mixtures through thermogravimetric analyses and X-Ray diffraction measurements.
Using a resolved spectroscopy technique, Goroshin et al[11] thoroughly studied the spectra emitted by stabilized Bunsen-type flames of 5 m aluminum suspensions in air and oxygen-argon/helium mixtures. The spectral
measurements have been performed in the nUV-Vis-nIR range 350
nm
to 1000 nm at an Al concentration of 500 g/m3. The spectra clearly exhibit a continuous spectrum and the blue-green B2 + - X2 + AlO vapor lines. In[12], the gas temperature was derived from these lines. A polychromatic fitting of the low resolution spectra continuum to was used to compute the particle cloud temperature. The light emission cross-section model is based on the Rayleigh diffusion limit considering a 1/ decrease of the absorption index of the molten bulk aluminum oxide. The temperature distribution lies between 3000K and 3550K across the flame. These data are useful for understanding the basics of dust cloud combustion. However, the emission model proposed in paper is not deduced rigorously from the theory of particle scattering. A more rigorous determination of the emission model can be achieved from the work of Parry and Brewster [13] by using an inverse solution of optical properties of the continuous spectra. These studies were performed at ambient pressure. They cannot be directly applied to the DP or to the deflagration waves in which pressures of about 10
bar
to 30bar can be observed.In another work, Goroshin et al [14] used a pyrometer and several spectrometry techniques at the same wavelength range to study the emission of fireballs from metalized explosives. Several explosives were investigated, Al-Nitromethane mixtures among them. The spectra of the latter are similar to those of an Al suspension in air or O2. No temperatures were deduced from these spectra, but the reliability of such techniques is
clearly demonstrated.
Useful data were also obtained by Cashdollar and Zlochover [15]who studied the explosion hazard conditions of metals and other elemental dust clouds (2µm to 180 m size) in air using a 20 L test chamber. The authors used a six wavelength IR pyrometer in the range 1.57
µm to
5.00 m to measure the dust cloud temperature. Explosion pressure, rate of pressure rise and explosion temperature, were determined as a function of the dust concentration for pressures and temperatures respectively below 10bar and 2800K. The experimented dilution of Al was 330g/m3 of Al. These authors used a grey body emissivity model to compute the dust cloud temperaturesfrom radiation measurements. In the IR 2.00-4.26 m wavelength range, CO2 has 3 dominant radiation lines,
III.THE COMBUSTION CHAMBER
The combustion chamber, designed in a previous study [16], is a closed stainless steel tube of 600 mm length and of 150mm internal diameter (Fig. 2). The tube is closed by two stainless steel flanges. The front one is equipped with a spark igniter (A). The optical access is a sapphire window (20mm diameter, 5mm thickness) placed on the cylinder axis throw the end flange (B). The injection of the different gases (C) within the vacuum chamber is controlled by partial pressure measurements using a transmitter Kristal RAG25A2BC1H with an accuracy of 1mbar.
FIG. 2: Combustion chamber.
The particle injection system is a horizontal fluidized bed placed inside the gas injection tube. The system has been designed to maximize the suspension time. The quality of the particle cloud has been examined by a laser sheet video-tomography. The laser sheet, obtained on a limited sector of 23°, is created inside the combustion chamber through the lateral sapphire windows placed at different distances from the spark igniter. Two laser sheet tomography examples, illustrating the difference between sedimentation and no-sedimentation of the particle clouds, are presented on the right side of Fig. 3.
FIG. 3: -200 mesh Aldrich powder stereo microscopy, particle size distribution and examples of laser tomography.
N2, air, CO2 and H2 are successively injected in the chamber. The adopted fluidization technique consists in
introducing particles within the last gas flow inside the chamber in order to induce a strong turbulence. This turbulence enables to maintain the particle cloud in suspension during around 6 s, thus ensuring a good gas-particle mixing. The delay time to fire must be reduced as possible (less than 7 s) in order to minimize deposition on the chamber wall. A cloud of suspended particles is needed in order to properly account for their volume fraction in the thermophysical model of the cloud radiation. This particle injection system anables controlling the particle volume fraction inside the chamber by quantifying the mass introduced into the fluidized bed.
Two types of particles are injected: aluminum and alumina. The aluminum-powder is the -200 mesh Aldrich powder with the product specification <75 m and >99.95
%
purity. The particle size distribution is plotted on the left side of Fig. 3. The Sauter diameter d32 of the particles is about 59 µm. Its density is 2700kg/m3 at 298K.Aluminum is highly reactive in H2-O2-CO2 gaseous mixtures and generates an Al2O3 smoke at the end of
combustion. The mass of aluminum powder introduced in the chamber is 4g, determined so as to obtain a volume fraction of 1.4×10⁻⁴ and a dilution of 400g/m3. The aluminum oxide powder is a -325 mesh alpha-Al
2O3 CERAC
with a purity superior to 99.99%. Particle sifters are used to obtain calibrated particles of around 44 m size. The particle density is 3900kg/m3 at 298K. Its melting temperature is 2323K at 1atm. As its evolution in the range
1
bar
to 20bar is small enough, it has been considered constant in the following. The mass control system leads to a volume fraction of 0.967×10⁻⁴. As the added alumina introduced in the gas phase behaves like an inert material[17], the experiments done with this powder will be shown to validate the inversion method developed for the Al2O3 smoke cloud (section VII-B). The mean particle size and the volume fraction of the alumina suspension
have been selected so as to be in the independent scattering regime in the - plane [8,18]. This will be also the case for the Al2O3 smoke generated by the aluminum particle combustion.
The dynamic pressure induced by the H2-O2-diluent deflagration is measured by a piezoelectric sensor Kistler
Model 6061b, placed above the sapphire window at the end flange (B). The radiation intensity emitted by the mixture of gases and particles is collected through the sapphire window by a fast CCD camera coupled to a grating spectrometer (Fig. 4) or by a six wavelengths optical pyrometer (Fig. 5). The whole bench (CCD camera, spectrometer, and optical collecting system) is placed under a controlled N2 atmosphere to limit ambient H2O and
CO2 absorptions. The optical measuring devices are described in the following section.
FIG.4: Experimental setup for IR spectral measurements
FIG.5: Experimental setup for Visible-IR spectral measurements
IV.THE OPTICAL MEASURING DEVICES
The IR measuring device (Fig.4) is composed of a parabolic mirror, a JOBIN YVON TRIAX 180 grating spectrometer, a CaF2 lens and a fast CCD camera ORION of CEDIP IR system (now marketed by FLIR). The
grating is blazed at 2500nm with a groove density of 120graduations per millimeter. The flux is collected as a parallel light beam from the sapphire window. The radiation entering the spectrometer is focused by the parabolic mirror. At the spectrometer outlet, the image of the spectrum is collected through a CaF2 lens on the IR camera
matrix. The spectral range of the camera is 1.5
µm to
5.0 µm and the frame rate is 6000Hz. The analysis of the signal is limited to the range of 4.1µm to 4.3 µm, within which the optical system is achromatic.For pyrometer measurements, the previous device is replaced by an optical probe to collect the radiation flux in the VIS-nIR range, connected to the pyrometer by an optical fiber. The pyrometer splits the flux on 6 wavelengths: 0.521, 0.660, 0.850, 1.083, 1.260 and 1.481µm. The detectors are Si photodiodes for the first three wavelengths and InGaAs for the last three. The electric signals are amplified and recorded using numerical scopes. No significant signals have been obtained at the 0.521µm wavelength.
For both measuring devices, the records are synchronized on the spark igniter pulse. The wavelength pixel correspondence on the IR CCD is calibrated with the spectrum of the CO2 4.26 m emission band of a Bunsen
burner methane flame placed behind the spark igniter hole. The electric signal luminance calibration is performed in the range 1000
K to
1773K on a blackbody PYROX placed at the back of the combustion chamber, instead of the flange A (in Fig.2). The intensity is then obtained in W.m-2.sr-1.µm-1.All radiances which will be illustrated from now have been measured when the flame front quenches at the end of the chamber or equivalently when the measured pressure reaches its maximum [16]. At this time, the radiance of hot deflagration gases is free of any absorption of fresh gases, otherwise still present ahead of the flame front when the deflagration propagation remains unfinished. Numerical simulations performed by Davidenko [19] exhibit a uniform pressure inside the combustion cylinder at each step of the flame propagation: in such a closed configuration, no gas cooling occurs behind the flame during its propagation. When the deflagration reaches the sapphire window, pressure, temperature and gas concentrations are uniform and correspond to an adiabatic constant volume explosion (no heat exchange between the gases and the vessel walls for the flame velocities obtained here). This has also been demonstrated by Santhanam and Dreizin [20] when using perfect gas equations of state with a constant polytropic index for both unreacted gases and deflagration products. Thus, the spectra obtained at the end of deflagration propagation can be easily analyzed by considering a uniform column of gas particles.
V. METHODS DEVELOPED TO DETERMINE GAS TEMPERATURE AND PARTICLE CLOUD EMISSIVITY AND TEMPERATURE
Gas temperature on the one side, alumina particle cloud temperature and mean diameter on the other side, can be determined from measured radiances, by assuming a known volume fraction and an adequate absorption-scattering Al2O3 droplet model to integrate the radiative transfer equation. Particle mean size and temperature are
A. Determination of gas temperature
At the emission band located at 4.26µm, broadening of the CO2 lines due to pressure and temperature increase
is exploited. Computations of the CO2 spectra in the limited range of 4.13to 4.20µm at several
pressure-temperature couples, using the HITRAN 2012 database, illustrate this behavior in Fig.6. Beyond 4.17µm, heated CO2 is opaque in the experiments whereas CO2 is transparent at ambient temperature, so atmospheric CO2 does
not contribute to the signal). The originality of the method proposed here is the exploitation of this property to determine the temperature of the deflagrating gases using a spectroscopic technique and Planck law [21],
(1)
= 1.19×10⁸W.m-2.µm4.sr-1 ( : speed of light in vacuum, : Planck constant)
14388µm.K ( is Boltzmann constant).
FIG.6: Transmission of a 600 mm depth gas column under several thermodynamic conditions and at several dilutions: Shots R14 and R16 at the final deflagration state with CO2 molar fractions of 0.057 (R14) and 0.1622 (R16), and Shot R14 at ambient state. The pressure and temperature conditions are given in Table 2. The calculations were performed using Hitran on the Web 2012 (http://hitran.iao.ru).
Typical spectra and pressure evolutions are given in Fig. 7, Fig. 8 and Fig. 9 for two levels of the deflagration pressure. They correspond to H2-O2 stoichiometric combustions in N2-CO2 mixtures with the initial compositions
reported in Table 2 (shots R16 and R17). The maximum combustion pressure and IR radiation is achieved when the expanding flame reaches the sapphire window and quenches. Fig. 7 and Fig. 8 clearly exhibit the broadening of the CO2 emission lines at the band location 4.26µm due to the increase of pressure and temperature conditions
during the flame propagation. The maximum combustion pressures and temperatures will be further compared to equilibrium thermochemical computations obtained with SIAME, a new thermochemical code developed at the CEA for energetic material combustion, deflagration and detonation. 32 experiments were performed in various
initial configurations in the ranges 6-20 bar and 2200
-
3700 K. Many experiments were performed and analyzed twice to ensure reproducibility (see Table 2). No carbon soot production has been observed as suggested by the cleanliness of the internal surface of the combustion chamber after the experiments. This is also retrieved by the thermochemical computations.FIG. 7: Typical measured radiance for Shot R16 (P=7.9 bar). See the conditions in Table 2.
FIG.9: Typical measured pressures for Shots R16 (P=7.9 bar) and R14 (P=16.1 bar)
B. Determination of the Al2O3 smoke mean size and temperature
Al2O3 smoke is formed by aluminum combustion following a complex chemical scheme. The combustion of
aluminum powder with CO2 and H2O leads to final products composed of Al2O3. Many papers have addressed the
physics of aluminum combustion. Beckstead [22] summarized all the studies until 2002 with around 400 experimental data and proposed the most recent chemical scheme [23] for aluminum oxygen combustion with eight elementary reactions comprising surface reactions, evaporation/dissociation, gas phase chemistry and condensation. These elementary reactions produce AlO gas having emission lines in the green-blue wavelength range. These lines are well-known and well-modeled at atmospheric pressure. At high pressures (typically > 5bar in the experiments of this study), no valid modeling is still available. In a deflagration, the aluminum combustion is generally assumed to generate a bimodal Al2O3 particle size distribution. Indeed, Al2O3 smoke is composed both
of large particles due to alumina condensation on the surface of aluminum particles and of submicron ones due to the condensation of the vapor-phase alumina in the gaseous products (Parry and Brewster [13]). The alumina volume fraction is small enough to consider independent scattering [8]. Under this assumption, the bimodal-distributed alumina particles follow both optical geometry diffusion (large particles) and Rayleigh diffusion (micron particles) regimes. Following Parry and Brewster[13], the radiation of submicron particles dominates in a range of possible diameters of 0.86
µm
to 1.08µm due to their large specific surface area. The diffusion of large particles of Al, covered by Al2O3, can thus be neglected. Generally, authors consider a Rayleigh scattering regimefor the micron particles. Parry and Brewster [13] used the Mie scattering theory. As the size range of particles is of the same order as the wavelength range of our optical pyrometer, the Mie scattering theory will further be used.
Complex refractive index value for alumina is assumed by = independently of the wavelength according to French [24]. Bityukov and Petrov [25] published a critical compilation of available experimental data on the absorption and refractive indexes of alumina between 2320
K
and 3000K. More recently, Lynch et al [26] proposed models for the emissivity of micro and nano-alumina particle clouds heated by a reflected shock wave in shock tube experiments. These models have been established with the use of a visible emission spectrometry technique, but they have neglected the influence of the volume fraction of particles in the cloud. In their configuration, motion of the particles during the shock wave propagation hardens the estimation of their volume fraction. Volume fraction of particles is known to strongly influence the emissivity of a particle cloud which can then be optically thin or thick, following the Mie theory.The good agreement between the experimental and calculated absorption and refractive indexes obtained by Parry and Brewster [13] leads us to retain their model. It is based on the classical Lorentz dispersion theory of the complex dielectric function where:
(2)
(3)
being the plasma wavenumber, the effective wavenumber, the wavenumber, and the damping
coefficient. In this model, , with the characteristic wavenumber
.
For alumina, two oscillators were considered by Parry and Brewster [13] with wavelengths
µm and µm. The dispersion parameters and are represented with polynomial
functions such as:
(4) depending on a scaled temperature given by:
(5)
The parameters are given in [13]. Temperature and wavelength evolutions of the complex index are compared to experimental values in Fig. 10. This model is strictly valid in the temperature range 2320
K to
3000K and inbe extrapolated to temperatures higher than 3000 K with and in order to preserve the physical tendencies for the absorptive and the refractive indexes.
FIG. 10: absorptive and refractive indexes versus the temperature and the wavelength and experimental data.
The absorption and scattering coefficients and are computed using the Python code which can be found on the page https://code.google.com/p/scatterlib/wiki/Spheres. The initial version of this code is due to Bohren and Huffman [27].
In the VIS-nIR range, the only emitting gas is H2O with low intensity (~10-5 W.cm-2.sr-1.cm1 at the
temperatures and pressures considered in this work). The spectrum is clean of other deflagration gase emission lines.
In [13], the equation of radiative transfer for a non-emitting one-dimensional parallel slab is solved by a discrete ordinate method. This method is useful for a problem with a well-characterized refractive index for low-pressure combustion. However H2 O2 deflagration leads to a pressure range of 8
bar
to 20 bar. As no data hasbeen found in the literature for the refractive index evolution in this pressure range, a simpler method based on a two-stream approximation to radiative transfer has thus been assumed to be a sufficient approach. Meador and Weaver [28] proposed unified two-stream equations for plane parallel atmospheres with assumptions of time independence, elastic scattering, no internal sources and no thermal emission, with incident collimated flux. An adaptation of these equations, for an emitting media without incident flux, is proposed for the diffused radiance:
where is Planck law, and the forward radiance, the backward radiance (Fig. 11), , with being the extinction coefficient ( ). The coefficients depend on the two-stream approximation considered. The simplest one is the hemispheric constant approximation in which the are given by the expressions:
(8)
(9)
(10)
where g is the asymmetric factor and is the particle cloud albedo.
FIG.11: schematic two-stream approximation in the combustion chamber
The boundary conditions considered in the configuration of this study are zero fluxes both through the sapphire window ( , with
,
being the deflagration cell length), and from the back flange of thechamber ( ). Indeed, temperature on the internal surface, evaluated from the heat conduction transfer between gases and steel, is in the range of 300-310 K. The only additional possible source of parasite radiations may come from the spark plug.
As previously stated, the temperature, pressure and particle concentration are uniform at the end of the deflagration propagation. In these conditions, equations (6) and (7) of radiation transfer in a plane, parallel and uniform media, admit an analytical solution for the net flux received on the optical head of the pyrometer:
(11)
where and
Temperature, diameter of the molten alumina droplets and their volume fraction can be deduced from radiance pyrometric measurements with the help of a mathematical inversion of this analytical solution. This inversion method assumes negligible emissions of both H2O and large particles generated by alumina condensation on the
surface of aluminum particles. The mathematical inversion consists in finding a solution for which a given objective function reaches its global minimum. The objective function is here chosen in the following form:
(13)
where is the standard deviation of the radiance measurements and the standard deviation of
the noise at the wavelength . These have been quantified at 3 to 6% of the radiance measurements, depending on the wavelength.
We thoroughly studied the sensitivity of the net flux to the volume fraction , the particle mean diameter and the temperature for values in the respective ranges of 4×10⁻⁵-4×10⁻⁴, 1-20 µm and 2320-3000 K. This
sensitivity analysis exhibits a complex behavior of the net flux characterized by a high sensitivity to temperature and to the particle diameter. the evolution of spectral emissivity with the previous three parameters is analyzed as illustrated on Fig. 12. The oscillations of the spectral emissivity observed on this figure are physically due to the two-oscillators representation of the dielectric function associated with the Mie scattering theory. The gray body behavior (independence on for ) in the visible wavelength range is obtained for large particle sizes only. A full mathematical inversion, for , and , presents several local minima. For alumina particle diameters of about 1 µm, which is the size obtained by Parry and Brewster [13] in a propellant combustion, the sensitivity to the volume fraction is small. Thus, the volume fraction which were considered here is the maximum value obtained by the thermochemical code SIAME when considering a fully aluminum combustion. Special attention was paid to the minima of obtained with different initial values of and in the optimization process, so that the optimized solution can be given without any ambiguity.
FIG. 12 Spectral emissivity for different values of temperature, Alumina particle diameter and volume fraction
Unlike [11] [26], this mathematical inversion method gets rid of any assumption on the particle cloud global emissivity with the wavelength. In our method, the emissivity is physically modeled which leads to a regularization of the mathematical inversion. This thermal emission model represents accurately both the micro alumina particle cloud spectral emissivity tendencies measured by Lynch [26] and the classic optical thickness evolutions with particle size and volume fraction. Applied to synthetic radiances computed with the direct model, the mathematical inversion retrieves both the given temperature and mean particle diameter. It has also been validated by measurements on Al2O3 calibrated particle clouds heated by deflagration
of gaseous mixtures as explained in the following section.
VI. EXPERIMENTAL CONDITIONS AND RESULTS
Two levels of deflagration pressure have been investigated. The experimental initial conditions have been chosen to produce deflagration pressure ranges of 7.3-8.8bar (Group A) and 15.5-18.2bar (Group B). They are given in Table 2, together with the thermal diagnostics used (IR or Vis-nIR) and the final deflagration state (gas pressure and temperature). Calculated particle cloud temperatures and mean diameters from the previous inversion method are given in Table 3. Uncertainties on the final gas deflagration pressure are evaluated at 1.5 % for Group A and at 3.9% for Group B, based on five experiments for each group, with a probability of 95% (corresponding to two standard deviations). Maximum uncertainty on gas temperature, established with the uncertainties propagation method described in [29], is evaluated at 1.6%. Uncertainties on particle diameter and temperature are estimated by Monte-Carlo drawings applied on the direct model, thanks to which the maximum values determined are respectively of 23.1% and 2.3% with a probability of 95%. Particle temperature uncertainty is
consequently greater than gas temperature one, due to the propagation of and measured radiances uncertainties.
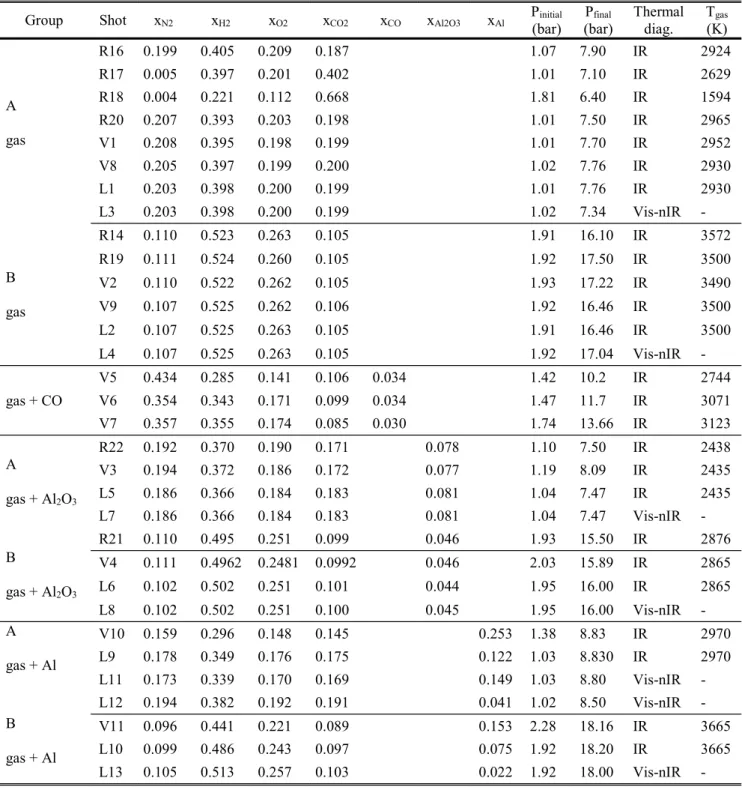
TABLE 2: Experimented mixtures (initial molar fractions), initial and final deflagration pressures, thermal diagnostics (IR : 4.10 4.30 µm, Vis-nIR : 0.660 1.481µm) and gas temperatures. The initial temperatures are in the range of 293 K to 300 K.
Group Shot xN2 xH2 xO2 xCO2 xCO xAl2O3 xAl P(bar) initial (bar) Pfinal Thermal diag. T(K) gas
A gas R16 0.199 0.405 0.209 0.187 1.07 7.90 IR 2924 R17 0.005 0.397 0.201 0.402 1.01 7.10 IR 2629 R18 0.004 0.221 0.112 0.668 1.81 6.40 IR 1594 R20 0.207 0.393 0.203 0.198 1.01 7.50 IR 2965 V1 0.208 0.395 0.198 0.199 1.01 7.70 IR 2952 V8 0.205 0.397 0.199 0.200 1.02 7.76 IR 2930 L1 0.203 0.398 0.200 0.199 1.01 7.76 IR 2930 L3 0.203 0.398 0.200 0.199 1.02 7.34 Vis-nIR - B gas R14 0.110 0.523 0.263 0.105 1.91 16.10 IR 3572 R19 0.111 0.524 0.260 0.105 1.92 17.50 IR 3500 V2 0.110 0.522 0.262 0.105 1.93 17.22 IR 3490 V9 0.107 0.525 0.262 0.106 1.92 16.46 IR 3500 L2 0.107 0.525 0.263 0.105 1.91 16.46 IR 3500 L4 0.107 0.525 0.263 0.105 1.92 17.04 Vis-nIR - gas + CO V5 0.434 0.285 0.141 0.106 0.034 1.42 10.2 IR 2744 V6 0.354 0.343 0.171 0.099 0.034 1.47 11.7 IR 3071 V7 0.357 0.355 0.174 0.085 0.030 1.74 13.66 IR 3123 A gas + Al2O3 R22 0.192 0.370 0.190 0.171 0.078 1.10 7.50 IR 2438 V3 0.194 0.372 0.186 0.172 0.077 1.19 8.09 IR 2435 L5 0.186 0.366 0.184 0.183 0.081 1.04 7.47 IR 2435 L7 0.186 0.366 0.184 0.183 0.081 1.04 7.47 Vis-nIR - B gas + Al2O3 R21 0.110 0.495 0.251 0.099 0.046 1.93 15.50 IR 2876 V4 0.111 0.4962 0.2481 0.0992 0.046 2.03 15.89 IR 2865 L6 0.102 0.502 0.251 0.101 0.044 1.95 16.00 IR 2865 L8 0.102 0.502 0.251 0.100 0.045 1.95 16.00 Vis-nIR - A gas + Al V10 0.159 0.296 0.148 0.145 0.253 1.38 8.83 IR 2970 L9 0.178 0.349 0.176 0.175 0.122 1.03 8.830 IR 2970 L11 0.173 0.339 0.170 0.169 0.149 1.03 8.80 Vis-nIR - L12 0.194 0.382 0.192 0.191 0.041 1.02 8.50 Vis-nIR - B gas + Al V11 0.096 0.441 0.221 0.089 0.153 2.28 18.16 IR 3665 L10 0.099 0.486 0.243 0.097 0.075 1.92 18.20 IR 3665 L13 0.105 0.513 0.257 0.103 0.022 1.92 18.00 Vis-nIR - Table 3 summarizes the results: mean deflagration gas pressure and temperature, Al2O3 particle cloud
temperature, mean diameter, emissivity, and related figures. These data are compared with temperatures and gray body emissivity [11]. This method leads to non-physical emissivity for the Shot L13. Temperature discrepancies between the two methods are of at least 100 K.
TABLE 3: Inversion results: final deflagration pressure, final gas temperature, final temperature of the particles, smoke mean size and uncertainties, emissivity obtained after inversion, values obtained by Goroshin in [11]
Group Mixture Shots Mean P(bar) gas TMean gas (K)
TAl2O3
(K) Alfraction 2O3 vol. (µm) dpart 850nm
Tpart [11] (K) [11] Fig. A gas L1, L3, R20, V1, V8 7.62 0.11 2944 47 - - - 13,14,16 gas + Al2O3 L5 ,L7, R22,V3 7.47 0.11 2436 39 <Tfus 0.97 10-4 - - 2380 0.1 no fig. gas + Al L11 L12 8.50 0.12 8.80 0.13 2970 47 2786+64 - 2630+61 1.83 100.50 10-4-4 2.1 0.5 2.6 0.6 0.5 0.6 2905 2767 0.4 0.5 16 B gas L2, L4, R14, V9,R19 16.61 0.64 3518 56 - - - 14,15 gas + Al2O3 L6, L8, R21,V4 15.85 0.62 2869 46 2548 59 0.97 10-4 43 11 0.7 2709 0.5 15 gas + Al L13 18.00 0.70 3665 59 2727 63 1.83 10-4 18.4 4.3 0.9 2624 1.2 17. VII.DISCUSSION A. Gas
A typical evolution of the radiance intensity measured in the IR range (4.1-4.3µm) is presented as a function of time on the right side of Fig. 13. The lower curve (t=1ms) corresponds to the beginning of the flame propagation inside the gaseous mixture, just after its ignition. The highest curve (t=15ms) has been recorded when the flame has reached the sapphire window corresponding to the maximum of the pressure signal as illustrated on the left side of Fig. 13. This pressure evolution is classically observed in such a confined configuration ([12] [16] [20]). These records exhibit the maximum of the CO2 emission line and the absorption of this radiation by the cold CO2
in the fresh gases in front of the flame. The intensity of the maximum radiance increases. Simultaneously, the absorption of cold CO2 in the fresh gas decreases when the front flame moves towards the sapphire window,
because of the reduction of the fresh gaseous mixture thickness. However, to observe this decrease, thickness must be small enough. The last curve (obtained here at 15ms) corresponds to the radiation emitted by heated CO2 in
the burned gases. This last curve is exploited to determine gas temperature by considering that the head of the 4.26 µm CO2 emission band behaves like a blackbody. The results obtained for Groups A and B are given on Fig.14.
This figure highlights the CO2 head band shift due to the elevation of pressure and temperature. The HITRAN
FIG. 13a
FIG. 13b
FIG.13: Measured pressure (13a) and radiances in experiment L1 in the IR range at several times (13b)
FIG.14: Measured radiances in experiments L1 and L2 in the IR range when the deflagration reaches the sapphire window.
B. Validation of the inversion method on the deflagration of gas Al2O3 particle mixtures
For Group A, the inversion method applied in the VIS-nIR wavelength range gives a temperature lower than Al2O3 melting temperature (2320K). By considering the optical index of solid alumina, the transmission
coefficient is supposed to be greater than 0.9. This value suggests then that, in the conditions of Group A, the measured flux comes both from plug and particle emission. The method is consequently no longer valuable.
For Group B, the radiances measured with and without particles are given on Fig. 15. Particles are at 2548K and have melted. The particle temperature is significantly lower (at least 317K) than the gas temperature. The gas and particles are not in thermal equilibrium as physically expected. The diameter of the injected particles is retrieved by the inversion method.
FIG. 15a
FIG. 15b
FIG. 15: Results for shots L4 and L8
C. Application to the deflagration of gas Al particles mixtures
Group A evolutions of the measured radiance intensity in the VIS-nIR range are presented as a function of time for a deflagration with and without 4g of aluminum (L11 and L3, Fig.16). For L3, no significant radiance has been recorded at the wavelengths of 0.660 and 0.850µm. The radiances registered at 1.481 and 1.260µm, probably coming from the hot spark igniter, are consequent compared to particle radiation. Hence, 1.481 and 1.260µm signals of Shot L11 have not been used in the radiative heat transfer equation inversion. At the
wavelength 1.083 µm, a transmission coefficient of 0.48 and a temperature of 2785 K have been obtained thanks to the inversion method. This confirms a negligible parasite flux at this wavelength. Although the alumina smoke dimensions deduced from the experiments are micronic (Table 3), they are in a thermal non-equilibrium with regards to the surrounding gas since their temperatures are 184+10K lower than that of gas deduced from the IR signal of experiment L11 as described in section VII-A. As expected, radiance intensity in the Vis range increases with the amount of aluminum.
FIG.16: Measured radiances in experiments L3 and L11
Group B evolutions of the radiance intensity measured in the VIS-nIR range are presented as a function of time for a deflagration with and without 4g of aluminum (L13 and L4, Fig.17). A signal was recorded for all the pyrometer channels. As previously, the signals at 1.481µm and 1.260µm are not retained for the inversion of the radiative equation. The particle diameter is still micronic. The gas temperature is greater than that of Group A whereas Al2O3 droplet temperature is similar. Thermal equilibrium is here again not achieved.
FIG. 17b
FIG.17: Measured radiances as a function of time for Shots L13 and L4
D. Comparison with thermochemical computations
Deflagration products, temperatures and pressures are calculated with the thermochemical code SIAME by considering an adiabatic constant volume explosion under the assumption that pressure and temperature are in equilibrium between particles and gas. The real gas BKW equation of state for the gaseous mixture and the Cowan equation of state for condensed species (C, Al, Al2O3)[29] are used with the BKWC database published in [30].
In the case of aluminum additives, the computations are performed considering unburned (inert) or totally burned (reacted) particles. The computed temperatures and pressures are compared to the experimental data on Fig.18 and Fig.19.
FIG.18: Comparisons between computed and experimental gas temperatures.
For shots with aluminum particles, the maximum deviations on pressure between experiments and computations reaches +90%, when assuming totally burned particles. However, when considering non-reactive particles, it reaches -13%. The experimental pressure is systematically close to the computed one when unburned aluminum particles are considered. For temperature, the maximum deviation reaches +51% when assuming totally burned particles and -17% when unreacted particles are considered. Experimental temperature is always
between the totally burned and unburned aluminum computed values for initial molar fractions of 0.149 and 0.075. Initial particle content strongly influences gas and alumina cloud temperatures. The thermochemical code is unable to predict these effects.
For alumina, computation systematically overestimates pressure and temperature with maximal deviations of respectively 14% and 8%.
The discussion on experimental data and the good accuracy of the thermochemical computations for gas mixtures have led to the conclusion that non-equilibrium between particles and gas, which is not-taken into account in SIAME, does not strongly influence the deflagration pressure. Lack of sensitivity of the emission model to the volume fraction of alumina particles makes difficult to conclude about the aluminum total combustion or lack of it in the deflagration wave.
VIII.SUMMARY AND CONCLUSION
The emission of gas and Al2O3 smoke in H2-O2-{N2-CO2}-Al deflagration has been measured in a closed
combustion chamber up to 17bar and 3700K. Measurements have been performed in the VIS-nIR range of wavelengths for smoke and in the IR spectral range 4.10
-
4.30µm for the CO2 emission lines. Gas temperature hasbeen deduced from the radiation intensity measured at the head of the 4.26µm CO2 emission band. This radiation
intensity has been considered as the one emitted by a blackbody and it has appeared to be very sensitive to gas temperature.
From the Vis-nIR experimental results, an inversion method has been developed to evaluate Al2O3 particle
cloud temperature and mean diameter, formed by aluminum combustion, by considering a two-stream approximation of the radiative heat transfer equation and the Mie scattering model. This method has been validated thanks to a calibrated Al2O3 suspension heated by gaseous deflagrations: particle mean size is retrieved, gas cooling
and thermal non equilibrium between gas and particles have been observed, as physically expected.
The method was applied to Al2O3 smoke generated by H2-O2-{N2-CO2}-Al deflagrations. Experimental
results have been compared to thermochemical calculations obtained with the SIAME code developed by CEA:
- for gas mixtures, calculated and experimental data are in good agreement and within 11% error for pressure and 8% for temperature.
- for particle and gas mixtures, experimental temperatures have been found between those calculated considering either inert or totally reacted aluminum, whereas calculated pressures obtained when considering inert aluminum have been observed to be closer to the experimental ones.
Initial aluminum concentration strongly influences cloud emissivity and consequently, gas and Al2O3 particle
temperatures. For the experimented volume fractions of Al particles, Al2O3 smoke clouds are optically thin.This
Al volume fractions range leads to an Al2O3 smoke volume fraction of about 10-4, which is representative of
explosive fireball expansions. The originality of the proposed inversion method applied to radiance measurements is that thermal non-equilibrium between gas and particles is assumed. Yet, this thermal non-equilibrium has had to be left aside in the thermochemical SIAME calculations. More effort is still needed to characterize the effects of aluminum initial concentrations and particle gas non-equilibrium in the thermochemical computations.
ACKNOWLEDGMENTS
The authors are grateful to Vladimir M. Belski from the Russian Federal Nuclear Center-VNIIEF, Institute of Physics of Explosion, Sarov, Nizhni, Novgorod, Russia, for their help to characterize the -200 mesh Aldrich aluminum powder. They are also grateful to the anonymous referees and to the English advisors for their valuable help in improving the quality of the manuscript.
REFERENCES
1. A.L. Kuhl, Mixing in explosion, Lawrence Livermore National Laboratory , Livermore, Report, UCRL-JC-115690, (1993).
2. L. Munier, PhD Thesis, Univ. Provence, Aix Marseille I, France, (2011).
3. L.E. Fried, W.M. Howard, P.C. Souers, Cheetah 2.0 u l, Lawrence Livermore National Laboratory, Livermore, CA, Report, UCRL-MA-117541, Rev. 5, (1998).
4. L.S. Rothman, I.E. Gordon, A. Barbe, D. Chris Benner, P.F. Bernath, M. Birk, V. Boudon, L.R. Brown, A. Campargue, J.-P. Champion, K. Chance, L.H. Coudert, V. Dana, V.M. Devi, S. Fally, J.-M. Flaud, R.R. Gamache, A. Goldman, D. Jacquemart, I. Kleiner, et al, J. Quant. Spectrosc. Rad. Transfer, 110 (9-10) 533-572, (2009)
5. L.S. Rothman et al, J. Quant. Spectrosc. Rad. Transfer, 130 (9-10) 4-50, (2013)
6. L.S. Rothman, I.E. Gordon, R.J. Barber, H. Dothe, R.R. Gamache, A. Goldman, V. Perevalov, S.A. Tashkun, and J. Tennyson, J. Quant. Spectrosc. Rad. Transfer 111 2139-2150, (2010)
7. S.A. Tashkun, V.I. Perevalov, J. Quant. Spectrosc. Rad. Transfer 112 (9) 1403-1410, (2011)
8. M.F. Modest - Radiative Heat Transfer, Mc Graw-Hill, 1993.
9. C. Badiola, R.J. Gill, E.L. Dreizin, Combust. Flame 158 2064-2070, (2011).
10. X. Zhu, M. Schoenitz, E.L. Dreizin, J. Phys. Chem. C 113, 6768-6773, (2009).
11. S. Goroshin, J. Mamen, A. Higgins, T. Bazyn, N. Glumac, H. Krier, Proc. Combust. Inst. 31, 2011-2019, (2007).
12. P. Escot Bocanegra, Ph.D.thesis, Univ. Orléans, France, (2007)
13. D.L. Parry, M.Q. Brewster, J. Thermophysics, 5 (2) 142-149, (1991).
14. S. Goroshin, D.L. Frost, J. Levine, A. Yoshinaka, F. Zhang, Prop., Explos., Pyrotech. 31 (3) 169-181, (2006).
16. P. Chelin, C. Camy-Peyret, V. Pina, P. Alkhoury and D. Davidenko, Combust. Flame, 140 319-331 (2005)
17. A. Lefrançois, G. Baudin, C. Le Gallic, P. Boyce, J.P. Coudoing, Proceedings of the 12th International
Conference Symposium on detonation, San Diego, California, (2002).
18. C.L. Tien, B.L. Drolen, Annual review of numerical fluid mechanics and heat transfer 1 1-32 (1987)
19. D. Davidenko, , PhD Thesis, Univ. Orleans, France (2005)
20. P.R. Santhanam, E.L. Dreizin, Characteristics of metal combustion obtained from constant volume explosion experiments , 48th AIAA Aerospace Sciences Meeting, Orlando, Florida, paper 2010-0178, (2010).
21. D. Ramel, PhD Thesis, Univ. Paris Nanterre, France, (2008).
22. M.W. Beckstead, 2004).
23. M.W. Beackstead, Liang Y., and K.V. Pudduppakkam, Combust., Explos. Shock Waves, 41, n°6, 622-638, (2005).
24. R. H. French, H. Müllejans, and D. J. Jones, J. Am. Ceram. Soc, 81(10), 2549 (1998).
25. V. K. Bityukov, V. A. Petrov, Appl. Phys. Research, 5 (1) 51-71, (2013)
26. P. Lynch, H. Krier and N. Glumac, J. Thermophysics, 24 (2) 301-308, (2010)
27. C.F. Bohren, D.R. Huffman, Absorption and Scattering of Light by Small Particles, Wiley, New York, (1983)
28. Meador W.E. and Weaver W.R., J. atmos. Sci. 37, 630-643 (1980)
29. BIPM, IEC, IFCC, ISO, IUPAC, IUPAP and OIML guide to the expression of uncertainty measurement 2nd
edition, ISBN 92-67-10188-1995 (French normative document NF ENV 13005), (1995).

![TABLE 1: Band location (wavelength) of the main absorption lines [8]](https://thumb-eu.123doks.com/thumbv2/123doknet/13032000.381925/5.892.107.794.395.610/table-band-location-wavelength-main-absorption-lines.webp)


![TABLE 3: Inversion results: final deflagration pressure, final gas temperature, final temperature of the particles, smoke mean size and uncertainties, emissivity obtained after inversion, values obtained by Goroshin in [11]](https://thumb-eu.123doks.com/thumbv2/123doknet/13032000.381925/20.892.54.848.149.435/inversion-deflagration-temperature-temperature-particles-uncertainties-emissivity-inversion.webp)

