Le développement des plantations de thuya occidental (Thuja
occidentalis L.) à l’intérieur et à l’extérieur des ravages de
cerfs de Virginie
Mémoire
Olivier Villemaire-Côté
Maîtrise en sciences forestières
Maître ès sciences (M. Sc.)
Québec, Canada
Le développement des plantations de thuya occidental (Thuja
occidentalis L.) à l’intérieur et à l’extérieur des ravages de
cerfs de Virginie
Mémoire
Olivier Villemaire-Côté
Sous la direction de :
Jean-Claude Ruel, directeur de recherche
Luc Sirois, codirecteur de recherche
iii
Résumé
Le thuya occidental (Thuja occidentalis L.) vit un déclin en abondance depuis plusieurs décennies et sur une grande partie de son aire de répartition. Ce déclin serait lié à un manque de semenciers, à des problèmes d’établissement de la régénération naturelle et à une grande pression de broutement. Les stratégies sylvicoles présentement mises de l’avant pour la restauration du thuya préconisent les coupes partielles afin de promouvoir la régénération naturelle et de permettre la reprise de croissance de la régénération préétablie, mais peu d’attention a été accordée aux plantations de thuya. Cette étude offre une première caractérisation des taux de croissance, de la forme des tiges et des taux de survie des thuyas en plantation. Elle évalue les effets de la compétition, des traitements sylvicoles et du broutement par le cerf, l’orignal et le lièvre sur la croissance et la forme du thuya planté. Des plantations monospécifiques et mixtes âgées de 5 à 27 ans et situées au Bas-Saint-Laurent, Québec, ont été échantillonnées. À l’intérieur comme à l’extérieur des ravages de cerfs de Virginie, les thuyas plantés montrent des taux de survie élevés et sont généralement sujets à une faible pression de broutement, mais 45% des tiges sont fourchées. La production des plants en pépinière et la grande disponibilité de lumière pourraient expliquer l’abondance des fourches, mais plus de recherche est nécessaire afin de mieux comprendre le processus de formation et le développement des fourches. Les thuyas plantés montrent des taux de croissance élevés et une forte réaction à l’élimination de la végétation compétitrice. Les résultats suggèrent qu’en l’absence de compétition, une exclusion des herbivores de 9 ans pourrait être suffisante pour établir des peuplements de thuya de plus de 3m de hauteur et à l’abri du broutement.
Table des matières
Résumé ... iii
Table des matières ... iv
Liste des tableaux ... v
Liste des figures ... vi
Remerciements ... vii
Avant-propos ... viii
Introduction générale ... 1
Development of Northern White Cedar (Thuja occidentalis L.) Plantations within and outside Deer Yards ... 6 Abstract ... 6 Introduction ... 7 Methods ... 10 Study area ... 10 Experimental design ... 10 Sampling ... 12 Statistical analyses ... 14 Results ... 17
Overview of cedar plantations ... 17
Forking ... 20 Browsing ... 21 Competition indices ... 22 Cedar growth ... 23 Discussion ... 26 Cedar growth ... 26 Forking ... 27 Browsing ... 28 Management implications ... 30 Conclusion ... 33 Conclusion générale ... 34 Bibliographie ... 36
Appendix A: Average root collar diameter growth as a function of time since plantation for Age-5 plantations ... 40
Appendix B: Average root collar diameter growth as a function of time since plantation for Age-15 plantations ... 41
Appendix C: Average root collar diameter growth as a function of time since plantation for Age-25 plantations ... 43
v
Liste des tableaux
Table 1. Number of plantations inside and outside deer yards. No Age-25 cedar plantations were found outside deer yards. ... 11 Table 2. Tested distance-independent competition indices ... 16 Table 3. Site information. Values are averages ± standard deviation ... 18 Table 4. Results of competition index selection based on AICc. ∆AICc is compared to the model with the lowest AICc. ... 22 Table 5. Results of model selection for diameter growth prediction using AICc ... 25 Table 6. Model averaged parameter estimates and 95% confidence intervals ... 25
vi
Liste des figures
Figure 1. Study area and sites location in Bas-Saint-Laurent, Québec, Canada. ... 12 Figure 2. Diameter class distribution for Age-25 with deciduous cover (A), Age-25 with thinned deciduous (B), and Age-25 with mixed cedar-spruce (C). ... 19 Figure 3. Proportions of forked dominant cedars according to fork height, site number, and age group... 20 Figure 4. Distribution of stems (%) among browsing score categories, outside and inside deer yard, for cedar and four selected highly abundant and highly palatable species, pin cherry (Prunus p.), beaked hazel (Corylus c.), mountain maple (Acer s.), and willows (Salix spp.) ... 22 Figure 5. (A) Average dominant cedar height (m) and (B) root collar diameter growth as a function of time since plantation (years) for non-suppressed cedar plantations ... 23 Figure 6. Root collar diameter growth (cm) as a function of time since plantation (years) for (A) site 21 (Age-15, with fir) and for (B) Age-25, deciduous cover plantations ... 24
vii
Remerciements
Je tiens d’abord à remercier mon directeur de recherche, Jean-Claude Ruel, pour sa disponibilité inégalable, l’autonomie qu’il m’a accordée, sa rigueur et son sens critique. Merci également à mon codirecteur, Luc Sirois, pour ses conseils pertinents, son soutien et son accueil à Rimouski. Il a su bien m’épauler malgré la distance.
Merci à mes coéquipiers de laboratoire et amis : Simon, Christine, Louis-Philippe, Pierre-Yves, Célia, Laurence et Marine, et mes autres collègues du Abitibi-Price. Je dirais bien que vous m’avez aidé à passer à travers la grisaille, mais comme nous n’avons pas de fenêtre, je ne sais pas trop…
Merci à Jérôme Laliberté pour son aide considérable sur le terrain, ses connaissances en botanique et ses histoires de trappeur. Merci au Fond de recherche du Québec – Nature et technologies pour l’appui financier qui a permis la réalisation du projet.
Finalement, merci à ma famille et mes amis et merci à Émilie d’avoir écouté mes discours [semble-t-il] incompréhensibles et indigestes sur les statistiques et de m’accompagner chaque jour avec ses folies passagères absolument hilarantes.
viii
Avant-propos
Ce mémoire est constitué d’un article rédigé en anglais, ainsi que d’une introduction et d’une conclusion générale. L’article a été accepté pour publication dans la revue Forests. Je suis l’auteur principal de l’article. J’ai élaboré le protocole de recherche avec l’aide de mon directeur et de mon codirecteur, récolté les données qui ont servi aux analyses, réalisé les analyses statistiques, interprété les résultats et rédigé le manuscrit. Mon directeur de recherche, Jean-Claude Ruel, a participé à l’élaboration du protocole de recherche, fourni d’indispensables avis tout au long du projet sur la méthodologie et l’analyse des résultats, et a corrigé et commenté l’ensemble du manuscrit tout au long de sa rédaction. Il est ainsi second auteur de l’article inséré. Mon codirecteur, Luc Sirois, a participé à l’élaboration du protocole de recherche et a contribué à l’interprétation des résultats et à la rédaction par ses corrections et ses commentaires. Il est ainsi troisième auteur de l’article inséré.
1
Introduction générale
Le thuya occidental (Thuja occidentalis L., ci-après thuya) est d’une importance écologique considérable. Il a un rôle important dans la chaine trophique de plusieurs insectes et oiseaux tels les fourmis charpentières (Camponotus spp.) et la paruline couronnée (Seiurus aurocapilla L.) (Johnston 1990). Il est également utilisé par les Premières Nations depuis bien avant la colonisation européenne à des fins culturelles et médicinales et pour sa durabilité naturelle (Boulfroy et al. 2012), et est encore aujourd’hui utilisé en médecine moderne pour ses propriétés pharmacologiques (Naser et al. 2005). Il offre une nourriture d’hiver appétente aux herbivores tels le cerf de Virginie (Odocoileus virginianus Zimmerman; ci-après cerf), le lièvre d’Amérique (Lepus americanus Erxleben; ci-après lièvre) et l’orignal (Alces alces Gray) (Ullrey et al. 1968; Johnston 1990). Son aire de répartition s’étend au Canada du Manitoba à la Nouvelle-Écosse, et aux États-Unis du Minnesota au Maine et vers le sud jusqu’au Tennessee et à la Caroline du Nord (Boulfroy et al. 2012). Bien que relativement marginal, le thuya a une importance économique considérable, avec un volume de récolte actuel d’environ 275 000 à 350 000 m3 dans l’ensemble de son aire de répartition.
Sa légèreté et sa résistance à la moisissure en font un matériau de choix pour des produits à valeur ajoutée tels les bardeaux et les meubles extérieurs (Boulfroy et al. 2012).
Le thuya est une essence très longévive et ubiquiste, pouvant croître sur une grande variété de sols organiques et minéraux (Johnston 1990). Il est généralement dominant sur les sites humides et sur les escarpements rocheux, et est souvent retrouvé en position sous-dominante ou opprimée dans les peuplements mixtes (Hofmeyer, Kenefic & Seymour 2009; Ruel et al. 2014). Il est par contre réputé avoir une meilleure croissance sur les sites mésiques avec sol minéral (Johnston 1990; Boulfroy et al. 2012), et était d’ailleurs autrefois plus dominant et prévalent sur pentes modérées et sites mésiques (Dupuis et al. 2011). Le thuya peut vivre à l’ombre pendant de très longues périodes, et devient généralement dominant après avoir survécu et succédé à des espèces moins longévives (Johnston 1990; Bergeron 2000). Il est perçu comme ayant une croissance lente, ce qui semble être associé au fait qu’il ne devienne généralement dominant qu’en fin de succession et qu’il croisse
2
souvent en conditions sous-optimales (Bergeron 2000). Par contre, le thuya a un taux de croissance à l’ombre similaire à celui de ses compétiteurs résineux (Hofmeyer, Seymour & Kenefic 2010; Larouche & Ruel 2015). Le thuya est également trouvé dans des conditions de pleine lumière (Hofmeyer, Seymour & Kenefic 2010), mais cette situation est rare puisque celui-ci a tendance à devenir rapidement dominé par des espèces associées (Larouche 2009). La plupart des peuplements de thuya sont régénérés par régénération préétablie (Hofmeyer, Kenefic & Seymour 2010), mais certains peuplements sont connus comme ayant émergé après des perturbations majeures comme le feu (Verme & Johnston 1986).
Le thuya fournit également une protection de qualité contre la neige, et est ainsi considéré comme un élément important des aires d’hivernage de cerf (ci-après ravages). Les cerfs se regroupent dans les ravages en hiver, et ceux-ci sont ainsi essentiels au maintien des populations à la limite nordique de leur répartition (Morrison et al. 2003; Dumont et al. 2005). L’aménagement des ravages vise ainsi la création et le maintien de la protection et de la nourriture hivernale en créant des peuplements plurispécifiques et hétérogènes, en privilégiant la régénération naturelle et les coupes partielles, et en excluant la récolte du thuya à cause des problèmes de régénération (Hébert et al. 2013). La concentration hivernale de cerfs dans les ravages peut par contre créer des problèmes localisés de régénération du thuya (Rooney et al. 2002).
Un déclin substantiel de l’abondance du thuya est observé sur l’ensemble de son aire de répartition depuis le début du 20e siècle (Cornett, Frelich et al. 2000; Dupuis et al. 2011;
Hofmeyer, Kenefic & Seymour 2009), un phénomène en partie lié aux pratiques sylvicoles (Boulfroy et al. 2012). Le thuya est généralement retrouvé comme composante mineure de peuplements mixtes et a une valeur écologique et commerciale distincte de ses espèces compagnes typiques, et l’aménagement forestier a tendance à favoriser d’autres essences au détriment du thuya (Boulfroy et al. 2012). Le broutement hivernal par le cerf est aussi reconnu comme étant un obstacle majeur à la régénération du thuya (Cornett, Frelich et al. 2000; Heitzman et al. 1997; Rooney et al. 2002; Verme & Johnston 1986). Les populations
3
de cerfs sont en effet réputées avoir atteint des niveaux sans précédent avec le déclin des populations de ses prédateurs (Knox 1997; McCabe & McCabe 1997), atteignant dans certains cas la surabondance (Côté et al. 2004), et ces populations nombreuses peuvent avoir des impacts considérables sur la régénération du thuya, en particulier dans les ravages (Heitzman et al. 1999; Morrison et al. 2003; Verme & Johnston 1986). Le lièvre utilise également le thuya comme nourriture d’hiver lorsque les feuillus deviennent moins abondants (Gauthier et al. 2008), et est ainsi reconnu comme un obstacle à la régénération du thuya, bien qu’à un niveau plus faible que le cerf (Johnston 1972). Il préfère les habitats fournissant à la fois protection et nourriture, et se retrouve ainsi en hiver dans de jeunes et denses peuplements résineux avec présence d’un couvert arbustif (Pietz & Tester 1983). L’orignal est quant à lui réputé ne consommer le thuya en hiver que lorsque ses autres sources de nourriture deviennent insuffisantes (Peek et al. 1976). Des populations élevées d’orignal pourraient ainsi avoir une influence sur la régénération du thuya.
Les espèces associées au thuya, autant herbacées qu’arbustives ou arborescentes, peuvent influencer la susceptibilité du thuya au broutement. La présence d’une plante voisine appétente peut accroître la détection et le dommage fait au thuya par les herbivores (susceptibilité associative; Barbosa et al. 2009), ou peut au contraire concentrer le broutement sur ces espèces appétentes et ainsi diminuer le broutement sur le thuya (neighbour contrast defense; Alm Bergvall et al. 2006). La présence d’une plante voisine rebutante peut quant à elle diminuer la détection et le dommage fait au thuya par les herbivores (résistance associative; Barbosa et al. 2009; Smit et al. 2006), ou rediriger le broutement vers le thuya (neighbour contrast susceptibility; Alm Bergvall et al. 2006). Un brout d’été sur les compétiteurs appétents du thuya pourrait également être indirectement favorable à la croissance de celui-ci en diminuant la compétition (Rooney & Waller 2003).
Même en l’absence de traumatisme, la faible dominance apicale du thuya contribue au développement de multiples fourches et branches latérales qui peuvent être d’un diamètre considérable par rapport à la tige principale (Ishii et al. 2007). Ces fourches ont un impact
4
sur la valeur commerciale des tiges, puisque les tiges non fourchues produisent des produits de valeur plus élevée et occasionnent moins de résidus de transformation (Boulfroy et al. 2012). Malgré l’observation d’un accroissement du nombre de fourches en conditions de pleine lumière (Logan 1969), les facteurs menant à la formation de fourches chez le thuya restent peu connus.
Grâce à sa tolérance à l’ombre et à sa tendance à marcotter, le thuya peut établir et maintenir une régénération avancée sous couvert (Johnston 1990). Le broutement, notamment par le cerf, peut par contre limiter le recrutement de la régénération vers des classes de hauteurs élevées (Larouche & Ruel 2015; Cornett, Frelich et al. 2000; Heitzman et al. 1997; Rooney et al. 2002; Verme & Johnston 1986). De plus, le thuya réagit bien à l’ouverture du peuplement, même après une très longue période d’oppression (Heitzman et al. 1997; Hofmeyer, Kenefic & Seymour 2010; Ruel et al. 2014). Les stratégies sylvicoles visant le maintien ou la restauration du thuya utilisent donc généralement des coupes partielles afin de dégager la régénération de thuya préétablie tout en évitant de stimuler la croissance des espèces compétitrices moins tolérantes à l’ombre (Larouche & Ruel 2015; Ruel et al. 2014). Bien que quelques travaux aient porté sur la régénération naturelle du thuya après coupes partielles (Heitzman et al. 1999; Verme & Johnston 1986), le potentiel des plantations de thuya pour la restauration de l’essence n’a toujours pas été évalué. Ces plantations ont pourtant le potentiel d’accroitre la présence du thuya et ainsi de diminuer la pression sur cette ressource en déclin, de diminuer les problèmes de broutement inhérents à la régénération naturelle sous couvert adéquat pour le cerf, et de fournir des taux de croissance considérablement plus élevés.
L’objectif général de ce projet était ainsi d’évaluer la pertinence des plantations de thuya après coupe totale pour la restauration de l’essence et la production de bois. Les objectifs spécifiques étaient 1) de produire une première caractérisation du taux de croissance, de la forme des tiges et du taux de survie des thuyas plantés, et 2) d’évaluer les effets de la compétition, des traitements sylvicoles et du broutement par le cerf, l’orignal et le lièvre sur
5
la croissance et la forme des thuyas plantés. Considérant les faibles populations de cerf dans la région (<0,5 cerf/km2; Huot & Lebel 2012), l’influence du broutement sur la
croissance et la branchaison du thuya a été comparée entre l’intérieur et l’extérieur d’un ravage.
6
Development of Northern White Cedar (Thuja
occidentalis L.) Plantations within and outside Deer
Yards
Abstract
Regional surveys done over the last decades show a clear decline in abundance of Northern white-cedar (Thuja occidentalis L.) throughout its range. A lack of seed trees, difficulties in the establishment of natural regeneration and high browsing pressure caused by increasing deer populations have been identified as plausible causes. Current silvicultural strategies for cedar restoration recommend partial cutting to promote and release natural regeneration, but there is also a need to restore the species in areas where it became absent. Yet, little attention has been given to cedar plantations. This study provides a first characterisation of the effects of competition, silvicultural treatments and deer, moose and hare browsing on planted cedar growth, survival, and stem form. Pure and mixed cedar plantations aged 5-27 years located in Eastern Québec were sampled. Both inside and outside deer yards, planted cedars showed high survival rates and were generally subject to low browsing pressure, but 45% were forked. Cedars showed high growth rates and strong reaction to stand opening. Results suggest that at reduced competition levels, a 9-year browser exclusion could be sufficient to establish safe-from-browsing cedar stands of >3 m in height.
7
Introduction
Northern white-cedar (Thuja occidentalis L., hereafter cedar) is of considerable ecologic value, in part due to its high longevity and shade tolerance (Johnston 1990). As it offers palatable winter food, cedar is an important source of winter browse for herbivores such as deer (Odocoileus virginianus Zimmerman; hereafter deer), snowshoe hare (Lepus americanus Erxleben; hereafter hare) and moose (Alces alces Gray) (Ullrey et al. 1968; Johnston 1990). Cedar also provides browse and protective cover during winter, when snow hampers deer movement, and is as such an important element of deer wintering areas (hereafter deer yards), which are essential to maintain deer populations at the northern limit of their range (Morrison et al. 2003; Dumont et al. 2005). Deer yard management therefore aims at creating or maintaining winter cover and food by creating mixed and heterogeneous forests, promoting natural regeneration and partial cutting, and excluding cedar harvesting in order to conserve existing cedar stands (Hébert et al. 2013). Cedar also has considerable economic value, with current annual harvests averaging 275,000 to 350,000 m3 over its range (Boulfroy et al. 2012). Its naturally rot-resistant wood is used for value added products such as shingles and outdoor furniture (Boulfroy et al. 2012).
A substantial decline in cedar abundance has been observed in most areas across all of its natural range since the beginning of the 20th century (Cornett, Frelich, et al. 2000; Hofmeyer,
Kenefic & Seymour 2009; Dupuis et al. 2011; Danneyrolles et al. 2017), a phenomenon likely linked to silvicultural practices (Boulfroy et al. 2012). Cedar is often found as a minor component of mixed species stands and its silvics are distinct from its typical neighbors. Forest management tends to focus on other species at the expense of cedar (Boulfroy et al. 2012) and to limit the amount of large woody debris, which has been linked with improved seed germination and seedling survival (Cornett et al. 1997; Simard et al. 2003). Deer browsing is also recognized as one of the limiting factors for cedar regeneration (Verme and Johnston 1986; Heitzman et al. 1997; Cornett, Frelich, et al. 2000; Rooney et al. 2002; White 2012). Following the exclusion of their main predators, deer populations are thought to have reached unprecedented levels (Knox 1997; McCabe and McCabe 1997; Rooney and Waller
8
2003), in some cases reaching overabundance (Côté et al. 2004). As a result, browsing pressure can have considerable impacts on cedar regeneration, especially in deer yards (Verme and Johnston 1986; Heitzman et al. 1999; Morrison et al. 2003). Snowshoe hare also uses cedar as winter feed when deciduous leaves become scarce (Gauthier et al. 2008), and is therefore recognized as an obstacle to cedar regeneration, although to a lesser extent than deer (Johnston 1972). Moose is also known to use cedar as winter feed, but only when other food sources are insufficient (Peek et al. 1976).
Browsing can have significant impacts on growth and survival of trees, and can also induce multiple morphological changes such as forking on the main stem (Danell et al. 1994). The impact of browsing can be exacerbated on cedar considering its low apical dominance which already contributes, even in the absence of trauma, to the development of multiple lateral branches and forks of considerable diameter relative to the main stem (Briand et al. 1992; Ishii et al. 2007; Hofmeyer, Seymour & Kenefic 2009), especially under high light conditions (Logan 1969). These forks impact the commercial value of stems, as sound and straight stems of large diameters produce higher valued products and lead to less milling waste (Boulfroy et al. 2012). Although long-lived (Johnston 1990), cedar is susceptible to decay, which could be due to its low density and exacerbated by tree damage during forest operations (Hofmeyer, Seymour & Kenefic 2009). While no differences in decay have been observed between cedars in all upper canopy positions (Hofmeyer, Seymour & Kenefic 2009), high resource availability in plantations could lead to increased growth rates and pathogen defenses, or conversely to allocation to growth instead of defensive compounds.
The growth rate and response to stand opening of natural cedar regeneration has been described under various levels of canopy closure and after various partial harvest treatments in natural stands (Verme and Johnston 1986; Heitzman et al. 1999; Cornett, Reich, et al. 2000; Hannah 2004; Hofmeyer, Kenefic & Seymour 2010; Ruel et al. 2014; Larouche and Ruel 2015). These assessments have however not been made for cedar plantations. Yet, plantations have the potential to increase the abundance of cedar and therefore
9
counterbalance the declining trend of cedar, to circumvent the browsing problems inherent to natural cedar regeneration near the northern limit of its range, and to provide higher growth yields.
The objective of this study was to evaluate the suitability of cedar plantations following clearcutting for wood production and cedar stand restoration. The specific objectives were 1) to provide a first characterization of planted cedar growth rate, stem form and survival rates, and 2) to evaluate the effects of competition, silvicultural treatments and browsing by deer, moose and hare on planted cedar growth and stem form. Given the small regional deer populations, below 0.5 deer/km2 (Huot and Lebel 2012), the influence of deer browsing
on cedar plantations inside the deer yard was contrasted with that of deer browsing outside the deer yard.
10
Methods
Study area
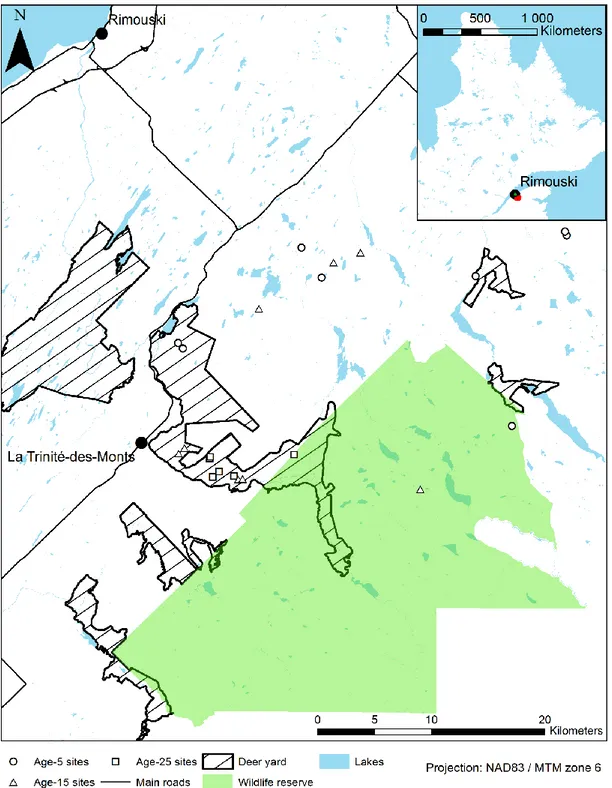
The study area is located on public forest land in eastern Québec (48°05’ - 48°17’ N, 67°58’ - 68°26’ W; Figure 1) in the eastern balsam fir – yellow birch bioclimatic subdomain (Saucier et al. 2009). The area is characterised by mean annual temperatures between 1.5 and 2.5oC
and mean annual precipitations between 900 and 1100 mm (Saucier et al. 2009). The studied stands are plantations established following clearcutting. The planted species on the sites include cedar, black spruce (Picea mariana Mill.), and white spruce (Picea glauca Moench). Natural tree regeneration includes white birch (Betula papyrifera Marshall), yellow birch (Betula alleghaniensis Britt.), pin cherry (Prunus pensylvanica L.f.), red maple (Acer rubrum L.), sugar maple (Acer saccharum Marshall), trembling aspen (Populus tremuloides Michx.), and balsam poplar (Populus balsamifera L.). Brush competition is also present: mountain maple (Acer spicatum Lam.), willows (Salix spp.), American mountain ash (Sorbus Americana Marshall), bitter-berry (Prunus virginiana L.), and beaked hazel (Corylus cornuta Marshall).
Experimental design
Cedar plantations were started in the late 1980s in eastern Québec, and 614 hectares of cedar were planted on public land in the Bas-Saint-Laurent region as of 2013 (Gagnon et al. 2014). Data was collected in the summer of 2015 on 22 of these plantations. The objective was to obtain a balanced sampling design inside and outside deer yards and between three age categories: Age-5 (5-8 years old), Age-15 (12-16 years old) and Age-25 (26-27 years old). However, the small number of Age-25 plantations and of Age-5 plantations within deer yards, as well as the heterogeneity between sites in terms of age, tree and shrub composition, and silvicultural treatment timing, prevented the achievement of a balanced design. Given the exploratory nature of this study, sites with few or no repetitions were still sampled in order to get a representative overall picture of cedar plantations. All sites were
11
clear-cut, scarified, and planted with square spacing of 2 by 2 m (2500 stems per hectare) or 2.25 by 2.25 m (2000 stems per hectare) either with cedar only or with a mix of cedar and spruces. Sites were selected using Québec forest inventory maps. Age-15 and Age-25 plantations were planted at a density of 2500 stems per hectare, and Age-5 plantations at 2000 stems per hectare. Small planting stock (approx. 25 cm in height) was used in the Age-25 plantations, while large planting stock (approx. 40 cm height) was used in Age-5 and 15 plantations. In some cases, sparse residual cedars were maintained, and most Age-5 and Age-1Age-5 plantations were neighboring natural mature cedar patches. Mixed plantations were done by alternating species from one row to the next. All plantations were brushed and/or thinned. The selected plantations are located on mesic sites, which are common in the region (Cyr 2014) and where most cedar plantations were established.
Deer yards are home to small deer populations in the study area, and while their boundaries are stable on maps, their populations fluctuate through time. Site selection aimed at contrasting high deer browsing pressure inside deer yards with low deer browsing pressure outside deer yards (Table 1).
Deer yards are home to small deer populations in the study area, and while their boundaries are stable on maps, their populations fluctuate through time. Site selection aimed at contrasting high deer browsing pressure inside deer yards with low deer browsing pressure outside deer yards (Table 1).
Table 1. Number of plantations inside and outside deer yards. No Age-25 cedar
plantations were found outside deer yards.
Inside deer yard Outside deer yard
Age-5 3 5
Age-15 4 4
12
Figure 1. Study area and sites location in Bas-Saint-Laurent, Québec, Canada.
Sampling
On each site, six plots were established using a systematic grid with a random starting point; on five smaller sites, only five plots could be laid without overlap. In each plot, subplots were established. Trees of DBH (diameter at breast height) greater than 9.1 cm were diameter
13
measured within a 400 m2 circular plot, and the height of three dominant trees was measured
to determine canopy height. Five 40 m2 subplots (one central and one at each cardinal point,
intersecting the 400m2 plot boundary) and eight 4 m2 circular subplots (one in the centre of
each external 40 m2 subplot and one halfway between the plot centre and the 400 m2 plot
boundary at each cardinal point) were established in each plot. In the 40 m2 circular subplots,
trees with a DBH of 1.0 to 9.0 cm were diameter measured, and a browsing score corresponding to the % of potentially available shoots (up to 3 m high to reflect maximum moose browsing reach (Muiruri et al. 2015)) that were actually browsed was given for each species following a scale from 0 to 4 (0 = no browse, 1 = 1-25%, 2 = 26-50%, 3 = 51-75%, 4 = 76-100%). The herbivore was also identified based on scars left on browsed twigs: cut (hare) or sheared (ungulate). In the 4 m2 subplots, all trees and shrubs of DBH <1 cm and
taller than 10 cm were tallied by height class (10-30 cm, 31-130 cm, 131-225 cm, >225 cm, based on availability to deer browsing (Saunders and Puettmann 1999)). A visual estimate of cover (by 5% class) per species and height class was completed, and a browsing score was given for each species and each height class within the subplot. On the tallest cedar in each 40 m2 subplots (hereafter referred to as dominant cedars) and 4 m2 subplots, additional
information was gathered: height, DBH, root collar diameter (D0), tree-level browsing score
and herbivore, number and height class of forks on the stem, and presence of a curve at the base of the tree (deviation of at least 30o from verticality on the main stem within the first
meter in height). Additionally, the dominant cedar in each central 40 m2 subplot (hereafter
referred to as central tree) was selected for a detailed stem analysis. For each central tree, a disc was removed at the root collar and at each subsequent available 1 m height increment, and total height was measured. When forks were present, the stem with the greater diameter was selected for analysis. All collected discs were sanded and aged by two different observers to evaluate height growth through time. Discs collected at the root collar were scanned at high resolution and their ring widths were measured using the CooRecorder software (Larsson 2016). To evaluate canopy closure, a hemispherical photograph was taken at a height of 1 m in the center of each plot early in the day under uniform sky lighting.
14
Canopy closure (in %) was calculated using the DHPT software (Loffredo et al. 2016), which calculates canopy closure from hemispherical photographs using hue-enhancing methods and automatic thresholding calculations. Site characteristics such as slope, drainage, indicator species, and soil texture were evaluated to confirm that conditions were consistent between sites.
Statistical analyses
In order to determine the most appropriate competition index (CI) for cedar diameter growth prediction, multiple linear mixed models were compared using the second-order Akaike information criterion corrected for small samples (AICc (Burnham and Anderson 2002; Mazerolle 2006)). Nine distance-independent CI which proved satisfactory in other studies (Table 2) and the measured canopy closure were evaluated in models to determine which metric(s) to include in the growth model. Distance-dependent indices were not tested as spatial information on tree location was not collected and natural regeneration prevented inference from plantation spacing. CI were tested independently as adding them to the growth model selection would have created too many models to compare given the sample size and number of tested parameters (Burnham and Anderson 2002). The most appropriate CI for radial growth prediction was determined by fitting linear mixed models of root collar diameter growth as a function of each individual CI and the root collar diameter (Equation 1). Multicollinearity between variables was tested using variance inflation factor (VIF) with a cut-off value of 3 (Zuur et al. 2010). The response variable was square-root transformed in order to meet linear mixed models assumptions.
√𝐷𝑖𝑎𝑚𝑒𝑡𝑒𝑟 𝑔𝑟𝑜𝑤𝑡ℎ=𝛽0+ 𝛽1𝐶𝐼 + 𝛽2𝐷0+ 𝐵𝑖 (1)
where Diameter growth is the average annual diameter growth (in cm) at root collar over the last 3 years in order to reduce the interannual variations caused by environmental factors and climate, β parameters are fixed effects, D0 is the root collar diameter of the subject tree
15
growth was also tested for the last year and the last 5 years, with no major differences in the outcomes of the analyses.
To evaluate which measured factors had an effect on recent cedar diameter growth, multiple linear mixed models were compared using AICc, as in the CI selection process. The response variable was the average root collar diameter growth over the last 3 years. The tested independent variables were: root collar diameter (D0), hare browsing score for central
tree (Hare), ungulate browsing score for central tree (Ungu), the previously selected CI, ratio of softwood basal area over the total basal area of each subplot (RATIO), plantation age (Age), and dummy variables for the presence of large planting stock size (Plant), wet microsite (Wet), curve at the base of the tree (Curve), and fork(s) below 30 cm height (Fr). Multicollinearity between variables was detected, so the Age and Plant factors were removed as other variables were deemed more influential. The null model (Equation 2) was defined as including D0, and used the square root of diameter growth as a response variable
in order to meet linear mixed models assumptions.
√Diameter growth = 𝛽0+ 𝛽1𝐷0+ 𝐵𝑖 (2)
When using AICc for model selection, a model with an AICc weight ≥ 0.9 is supported strongly enough to justify the selection of the model (Burnham and Anderson 2002). In the absence of a model with an AICc weight ≥ 0.9, multimodel inference was used in order to obtain a weighted average of each parameter based on the AICc weight of each model containing the parameter (Burnham and Anderson 2002). Model averaging was applied to all models with an AICc weigth > 0.01 to avoid a bias away from 0 for underrepresented parameters (Burnham and Anderson 2002). When using model averaging, parameters which 95 % confidence intervals excluded zero were considered good predictors of square-root transformed square-root collar diameter growth.
All statistical analyses were performed using the R statistical programming environment (Team 2016). Linear mixed models were programmed using the lme4 package (Bates et al.
16
2015). Pseudo-R2 for linear mixed models (Nakagawa and Schielzeth 2013) were calculated
using the MuMIn package (Barton 2016). Model selection and multimodel inference based on AICc were performed using the AICcmodavg package (Mazerolle 2016).
Table 2. Tested distance-independent competition indices
Index name Index formula Reference
DIq
𝑑𝑠
𝑑𝑞 (Tomé and Burkhart 1989)
DIqdom
𝑑𝑠
𝑑𝑑𝑜𝑚 (Tomé and Burkhart 1989)
DImax
𝑑𝑠
𝑑𝑚𝑎𝑥 (Tomé and Burkhart 1989)
BIq
𝑔𝑠
𝑔𝑞 (Tomé and Burkhart 1989)
BIqdom
𝑔𝑠
𝑔𝑑𝑜𝑚 (Tomé and Burkhart 1989)
BImax
𝑔𝑠
𝑔𝑚𝑎𝑥 (Tomé and Burkhart 1989)
BAPBA ∑ 𝑔𝑔𝑠 𝑐 (Kiernan et al. 2009) BAL ∑ 𝑔𝑐∙ 𝑦, where 𝑦 = {1, 𝑖𝑓 𝑑𝑐> 𝑑𝑠 0, otherwise (Wykoff 1990) BAB ∑ 𝑔𝑐∙ 𝑦 ∑ 𝑔𝑐 , where 𝑦 = { 1, 𝑖𝑓 𝑑𝑐> 𝑑𝑠
0, otherwise (Kiernan et al. 2009)
Canopy Closure From hemispheric photographs
where ds is the subject tree DBH, dq is the quadratic mean DBH of the stand, ddom is the quadratic mean DBH of
the 100 dominant trees/ha, dmax is the maximum stand DBH, gs is the subject tree basal area (BA), gq is the
quadratic mean BA for all trees in the stand, gdom is the quadratic mean BA of the 100 dominant trees/ha, gmax is
the BA of the maximum DBH in the stand, gc is competitor tree BA where all trees in the plot, both of smaller
17
Results
Overview of cedar plantations
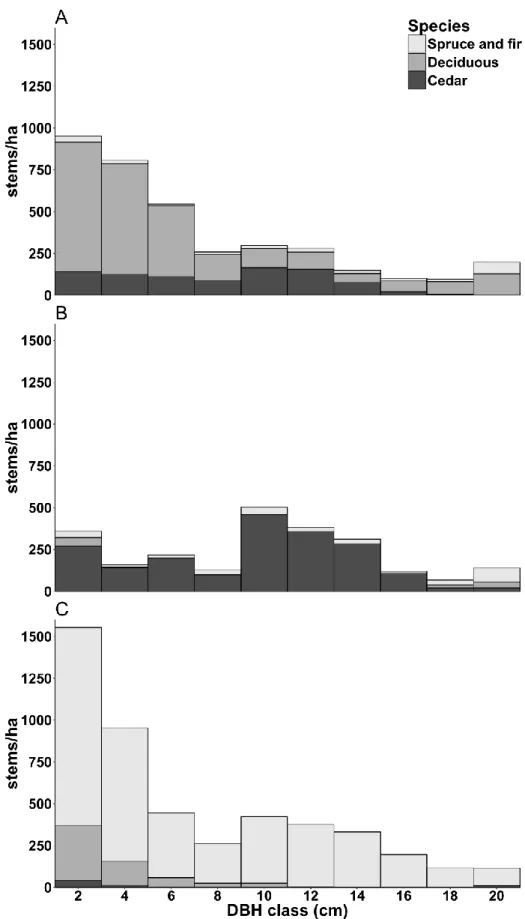
Seven plantation types were identified (Table 3). Age-5 plantations were free of dominant competition, except for both eight year old sites where deciduous species were starting to overgrow planted cedars. Information regarding stand history was incomplete, especially for Age-25 plantations, but all Age-15 and Age-25 plantations were brushed and/or thinned. While the timing of these silvicultural treatments was consistent within each stand type, it was not consistent from one stand type to the other (Appendices B and C). Age-15 plantations had open canopies (Table 3), and while the softwood competitors were taller than cedar, competition for light was still limited. On some Age-15 sites (sites 21 and 25), dominant cedars had attained merchantable diameter (>9 cm DBH). Age-25 sites had closed canopies (Table 3): two showed small cedars suppressed under a dominant spruce canopy, three showed cedars in an intermediate position under a dominant deciduous canopy (white birch, yellow birch, pin cherry, sugar maple), and one showed cedars in a codominant position alongside sparse balsam fir following a 2009 thinning of deciduous trees (Figure 2). Merchantable diameter was attained for 40–55% of cedars on the Age-25 plantations with deciduous cover and for 64% of cedars on the Age-25 plantation with thinned deciduous. Stem density on the Age-25 plantation with thinned deciduous is driven up by the high number of forks, while stem density on the Age-25 plantations with deciduous cover is driven down by the low survival rate on site 14.
Planted cedar survival rates exceeded 90% on all but three Age-25 plantations. Two of these plantations (sites 4 and 5) were planted with black spruce (50/50 ratio) and showed low survival within the first few years, which led to in-fill planting with spruce. On the remaining plantation (site 14), two of the six subplots were located in a poorly drained area and had low survival rates.
18
Table 3. Site information. Values are averages ± standard deviation. The n value shows the
number of samples used to calculate height and root collar diameter averages. Site Cedar plantation
type Deer Yard Age n Dominant tree height (cm) Root collar diameter (cm) Competition height (m) Canopy closure (%) 7 Age-25, deciduous cover, pure cedar planted Inside 27 30 661 ± 145 14.85 ± 4.46 11.7 ± 2.9 92 ± 5.1 15 Inside 27 30 652 ± 170 15.09 ± 4.62 13.2 ± 2.0 95 ± 0.0 14 Inside 27 26 499 ± 223 12.05 ± 6.12 13.6 ± 2.5 95 ± 0.0 19 Age-25, thinned deciduous cover, pure cedar planted Inside 26 30 646 ± 116 18.39 ± 4.89 12.7 ± 0.9 77 ± 13.3 4 Age-25, mixed cedar-spruce planted Inside 26 18 232 ± 116 4.58 ± 2.15 11.2 ± 2.1 95 ± 0.0 5 Inside 26 9 96 ± 63 2.24 ± 2.07 10.6 ± 2.1 87 ± 5.1 13 Age-15, pure cedar planted, no fir Outside 13 29 330 ± 63 6.36 ± 1.32 N/A 18 ± 5.2 1 Outside 13 26 285 ± 59 7.29 ± 2.62 N/A 27 ± 14.7 21 Age-15, pure cedar planted, with fir Inside 16 29 437 ± 47 12.01 ± 2.01 8.7 ± 2.6 36 ± 20.4 20 Inside 16 23 308 ± 113 7.82 ± 3.74 9.1 ± 2.3 53 ± 9.8 25 Outside 12 30 415 ± 53 11.17 ± 2.48 5.8 ± 0.6 32 ± 15.1 26 Outside 12 27 283 ± 63 9.12 ± 2.17 5.4 ± 0.7 18 ± 8.2 11 Age-15, mixed cedar-spruce planted Inside 14 19 150 ± 74 2.78 ± 1.49 6.7 ± 0.7 41 ± 11.4 3 Inside 12 24 272 ± 91 5.81 ± 2.61 6.8 ± 1.0 50 ± 0.0 17 Age-5, pure cedar planted Outside 8 29 299 ± 37 6.36 ± 1.32 4.2 ± 0.5 22 ± 20.4 16 Outside 8 30 279 ± 27 6.75 ± 1.60 3.3 ± 0.4 8 ± 5.2
18 Outside 6 30 184 ± 30 4.59 ± 0.85 N/A N/A
12 Outside 6 25 181 ± 26 4.52 ± 0.87 N/A N/A
22 Inside 5 24 167 ± 22 3.26 ± 0.68 N/A N/A
24 Inside 5 25 122 ± 27 2.52 ± 0.66 N/A N/A
8 Outside 5 23 117 ± 30 2.74 ± 0.71 N/A N/A
19
Figure 2. Diameter class distribution for Age-25 with deciduous cover (A), Age-25 with thinned
20
Forking
The proportion of forked cedar stems averages 45% for Age-5 plantations, 58% for Age-15 plantations and 26% for Age-25 plantations (Figure 3). However, within each age class, the proportion of forked stems varies substantially between sites and within stand types. 86% of all forks are located within the first 30 cm of the stem. Planted cedars are also susceptible to curving at the base of the tree, the proportion of curved stems averaging 11%.
Figure 3. Proportions of forked dominant cedars according to fork height, site number, and age
21
Browsing
All plantations showed evidence of ungulate and/or hare browsing. However, browsing was generally concentrated on competitor species (shrubs and small trees such as beaked hazel, willows, mountain maple and pin cherry) on Age-5 and Age-15 plantations. Age-5 plantations generally had low abundance of competitor species, stand tending having occurred recently, and Age-15 sites had a high abundance of competitor species. Of all cedars available for browsing (>30 cm in height), 13% were browsed, and 83% of browsed cedar had <50% of available foliage consumed. One Age-5 plantation (site 23), located within the most densely populated part of the deer yard, had 29% of its cedar browsed by deer. All other Age-5 plantations showed little sign of cedar browsing, with less than 7% of cedars browsed by deer and no hare browsing. On Age-15 sites, both inside and outside the deer yard, browsing was highly variable but abundant on palatable competitive species (pin cherry, beaked hazel, mountain maple, willows) (Boulet 2013) and consistently sparse on cedar (Figure 3). One of the Age-15 plantations (site 26) was located in a moose rut area, itself located in a wildlife reserve with high moose populations, and showed clear signs of moose browsing, with high densities of beaked hazel systematically browsed at approx. 130 cm in height. Although fir was four times less abundant than cedar on that site, 85% of all fir was browsed, while 25% of cedar was browsed. Hare browsing on cedar was present on some Age-15 plantations, the ratio of hare-browsed cedar ranging from 0–19%. Both suppressed Age-25 plantations showed systematic hare browsing on suppressed cedar, with >40% of cedars having >50% of available foliage browsed. All other Age-15 and Age-25 plantations showed signs of light cedar browsing by hare and/or ungulates.
22
Figure 4. Distribution of stems (%) among browsing score categories, outside and inside deer
yard, for cedar and four selected highly abundant and highly palatable species, pin cherry (Prunus p.), beaked hazel (Corylus c.), mountain maple (Acer s.), and willows (Salix spp.). Error
bars show maxima and minima.
Competition indices
Of the nine tested CI and the canopy closure metric, two had a lower AICc value than the null model (Table 4). The model with the lowest AICc value had an AICc weight ≥ 0.9, and BAL was therefore selected as the most reliable CI (Burnham and Anderson 2002).
Table 4. Results of competition index selection based on AICc. ∆AICc is compared to the model
with the lowest AICc.
Model AICc ∆AICc AICc weight Marginal
pseudo R2 D0 (null model) -128.81 19.05 0.00 0.41 D0 + BAL -147.86 0 0.99 0.59 D0 + Canopy Closure -133.35 14.51 0.01 0.46 D0 + DIq -127.14 20.72 0.00 0.42 D0 + DIqdom -127.11 20.75 0.00 0.42 D0 + BIq -127.10 20.76 0.00 0.42 D0 + BImax -126.83 21.03 0.00 0.40 D0 + BIqdom -126.81 21.04 0.00 0.41 D0 + BAPBA -126.65 21.21 0.00 0.40 D0 + BAB -126.64 21.22 0.00 0.40 D0 + DImax -126.64 21.22 0.00 0.41
The selected CI was used to validate stand suppression. Age-15 and Age-5 sites had CI values below 1.44. The Age-25 pure cedar plantations had CI values ranging from 2.87 to 3.04, while the Age-25 mixed plantations (sites 4 and 5) had CI values between 5.01 and 5.68. This gap in
23
CI values, as well as annual radial growth measurements, suggests that sites 4 and 5 were suppressed.
Cedar growth
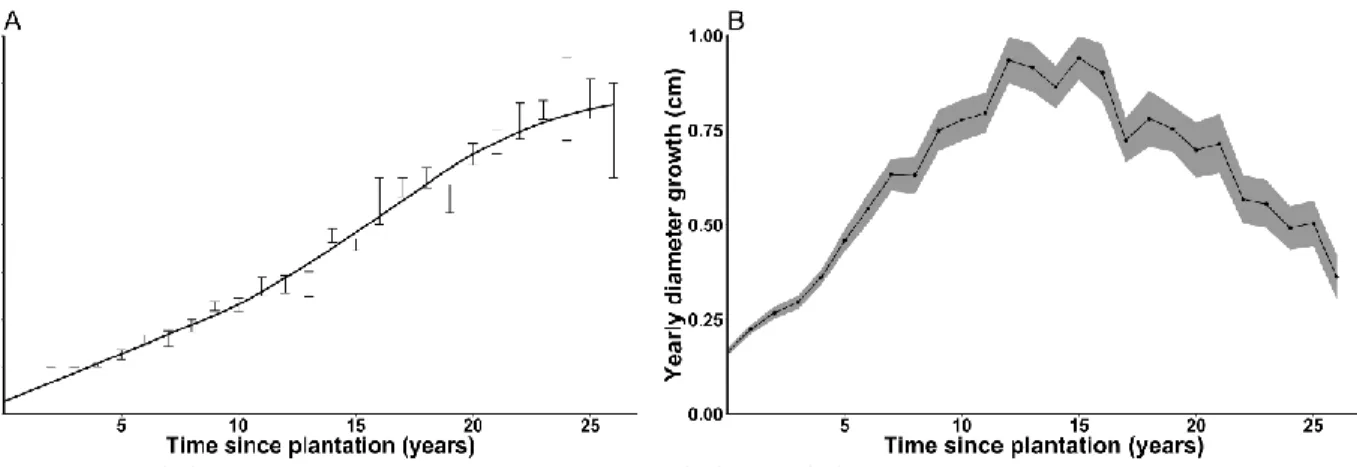
A reconstruction of age vs. height and age vs. root collar diameter growth was done for all non-suppressed plantations (Figure 5) in order to show planted cedar growth potential. Yearly cedar root collar diameter growth reached as high as 2.15 cm on cedars with no overtopping competition (site 13, Age-15). Average yearly root collar diameter growth peaked at 1.12 cm for Age-15 plantations, and at 0.69 cm for Age-25 plantations. Maximum cedar height averaged 860 cm after 26–27 years on non-suppressed Age-25 plantations, and height growth peaked at >50 cm/year for all three age categories. On suppressed sites (not shown in Figure 5 to better show the potential growth of cedar), diameter growth went as low as 0.01 cm in the case of systematically hare-browsed individuals (site 4, Age-25).
Figure 5. (A) Average dominant cedar height (m) and (B) root collar diameter growth as a
function of time since plantation (years) for non-suppressed cedar plantations. Error bars and ribbon show standard errors.
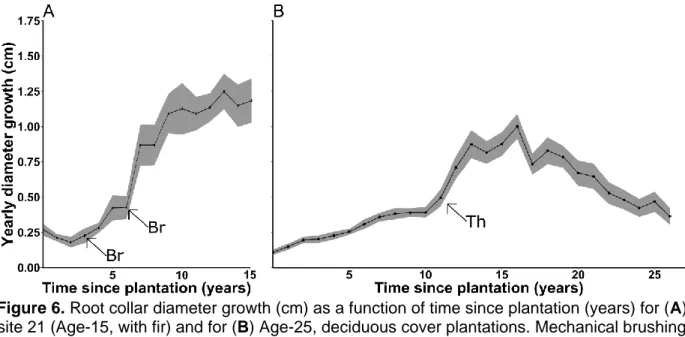
To portray cedar growth response to brushing or thinning, average root collar diameter growth as a function of time since plantation is shown for one Age-15, with fir plantation and for all Age-25, deciduous cover plantations (Figure 6). Not all sites could be regrouped on the same figure if growth releases were to be well portrayed because of inconsistencies in intervention timing between sites, and only two representative growth curves are shown for brevity (All sites are shown in Appendices A, B and C). Growth response of cedar to early brushing (1–3 years after plantation) is inconsistent in intensity between sites, but all brushed sites show a stable or decreasing growth rate just before brushing and a growth increase just after brushing. On
non-24
suppressed Age-25 plantations, diameter growth rates doubled within 2 years following stand brushing or thinning, and were maintained for >5 years before declining.
Figure 6. Root collar diameter growth (cm) as a function of time since plantation (years) for (A)
site 21 (Age-15, with fir) and for (B) Age-25, deciduous cover plantations. Mechanical brushing (Br) and thinning (Th) interventions are identified with arrows. Ribbons show standard error.
Of the 52 tested models fitted to predict diameter growth, 12 had AICc weights >0.01 (Table 5). All of these models contained the CI parameter, and none contained the Fr parameter. The unconditional confidence intervals (UCI) obtained with multimodel inference (Table 6) for CI and D0 excluded zero, which suggests that they contribute to explain root collar radial growth variation.
The UCI obtained for Wet, Curve, RATIO, and the interactions between D0 and Hare and between
D0 and Ungu included zero, which suggests that they did not contribute to root collar radial growth
variation. The Fr parameter was not included in the top 11 models (Table 5), and no parameter estimate could therefore be calculated using model averaging. D0 is positively correlated with root
25
Table 5. Results of model selection for diameter growth prediction using AICc. The K value
shows the number of parameters in the model. Only models with an AICc weight >0.01 are shown for concision.
Model K AICc ∆AICc AICc
weight Cumulative AICc weight Marginal pseudo R2 D0 + Wet + Curve + CI D0 + Wet + CI
D0 + Wet + Curve + CI + RATIO D0 + CI
D0 + Wet + CI + RATIO D0 + Curve + CI D0 + CI + RATIO
D0 + Curve + CI + RATIO
D0Hare + D0Ungu + Wet + Curve + CI D0Hare + D0Ungu + Wet + CI
D0Hare + D0Ungu + CI
D0Hare + D0Ungu + Wet + Curve + CI + RATIO
Table 6. Model averaged parameter estimates and 95% confidence intervals. Shaded lines
show parameters that contribute to root collar radial growth variation according to model averaging.
Parameter Estimate Lower UCI Upper UCI
Curve 0.06 -0.02 0.15 CI -0.08 -0.11 -0.06 Wet -0.12 -0.24 0.01 Fr NA NA NA RATIO 0.06 -0.03 0.15 D0Hare 0.00 -0.01 0.00 D0Ungu 0.00 -0.01 0.01 D0 0.04 0.03 0.04
26
Discussion
To our knowledge, no previous study was conducted on cedar plantations established following clear-cutting. Results show that cedar plantations could be suitable for cedar restoration on rich sites and under low browsing pressure. Cedar growth was considerably higher than for natural cedar in other studies with low shade levels, i.e., after strip clear-cutting on rich swamps, with or without advanced regeneration (Verme and Johnston 1986; Heitzman et al. 1999). While browsing was detected on most sites, it could not be linked to any detectable changes in growth rates. The high prevalence of forks on most sites and the lack of site history data also prevented drawing conclusions regarding a potential link between browsing and forking. Following release, planted cedar had a doubling in growth rate, and generally higher survival rates. While the reasons for the low survival of planted cedars on a small number of sites are unknown due to the lack of stand history data, possible causes include browsing, wet microsites, and the potential inability for manual brushers to see small cedar seedlings under competing vegetation.
Cedar growth
Growth rates were highly variable between sites, and some of this variability could not be explained by the measured factors. For instance, 2-fold differences in diameter growth were observed between sites as soon as one year after planting, and can therefore not be attributed to competition. These differences could be attributed in part to planting and seedling quality, and did not seem to affect growth for subsequent years.
The analysis of growth rate through time (Appendices A, B and C) shows that all 15 and Age-25 plantations were suppressed to some extent under competing vegetation at a young age. However, all but both suppressed Age-25 plantations had healthy live crowns and did not show signs of imminent mortality (>50% live crown ratios). Although the growth response to brushing of Age-15 plantations was inconsistent between sites, growth rates continued to increase more than 10 years after brushing (Figure 5A and Appendix B), likely due to the limited competition by softwood and the consequently open canopy. As Age-5 and Age-15 plantations still had open canopies, fast growing competing vegetation such as pin cherry and mountain maple could still pose a competition problem should they come back after brushing. In contrast, non-suppressed Age-25 plantations were brushed 10–11 years after planting, and while their growth rates increased slowly during the first 10 years, they doubled within 2 years after brushing. Growth rates then remained stable for the Age-25, thinned deciduous plantation, likely due to the still fairly low canopy closure level, while they stabilised and then declined after a few years for the Age-25,
27
deciduous cover plantations (Figure 5B and Appendix C), likely due to the presence of an overtopping deciduous canopy. This growth decline suggests that non-suppressed Age-25 cedars could benefit from the thinning of their overtopping deciduous competitors, which would allow for a growth release and leave dense, nearly pure, and well-established cedar stands. This thinning intervention is not necessary for cedar survival, as cedar can survive for extended periods in a suppressed position and still react well to release (Heitzman et al. 1997; Hofmeyer, Kenefic & Seymour 2010; Ruel et al. 2014). However, in the context of cedar production, thinning should significantly shorten the duration of the rotation by avoiding the suppressed stage altogether. The competition index (CI) was used to quantify the relative competition for cedar trees and was identified as a contributing factor for variations in cedar growth (Tomé and Burkhart 1989). It was a better predictor of cedar growth than the canopy closure metric. The ratio of softwood basal area to total basal area (RATIO) was tested as a factor affecting cedar growth rates because softwood cover and browse are preferred during the winter by both deer and hare (Forester et al. 2008) and because an increase in softwood content has been linked to a decrease in diameter growth after partial cutting (Ruel et al. 2014). However, it was not identified as a contributing factor to variations in cedar growth, which can be explained in part by the high RATIO values found on most sites and by the lower influence of RATIO values on sites with open canopies.
Forking
Forking had no significant influence on cedar growth in this study on a 27-year timeframe. However, forks cause structural weaknesses, which could be problematic considering the low density and structural weakness of cedar wood (Hofmeyer, Seymour & Kenefic 2009). Fork presence also has consequences for cedar processing, as cedar mills generally cannot process forked stems. Forks located at the base of the tree reduce the usable volume, while forks located higher on the stem could prevent a stem from meeting minimum length requirements. The impact should be smaller for shingle production as the process can use smaller sections and therefore allow for the elimination of the fork without discarding the entire log, but substantial waste nonetheless remains. Forks could also be an entryway for pathogens causing wood decay, which is thought to cause cedar to allocate more resources to defense mechanisms at the expense of growth (Hofmeyer, Seymour & Kenefic 2010).
The lack of stand history data hinders the identification of the causes of forking in the studied plantations. However, the high frequency of forked stems in all plantation types (Figure 2) is consistent with the known tendency of cedar to fork (Johnston 1990), except for the Age-25,
28
deciduous cover plantations and the Age-25, mixed cedar-spruce plantations, where few forks were observed. Possible causes of forking include browsing, which breaks apical dominance (Côté et al. 2004) and causes the replacement of the damaged branch by an adjacent branch (Briand et al. 1992), damage by snow and frost, and low apical dominance (Johnston 1990). However, as 86% of forks are located within the first 30 cm of height of the tree, the cause of forking is likely not ungulate browsing, as winter browsing availability starts at tree height 30–50 cm due to snow cover (Saunders and Puettmann 1999). High light availability is a more likely cause of stem forking in this study; Logan (1969) found near-consistent forking at the root collar of planted cedar, and found that cedar forking was exacerbated under full light conditions by the considerable increase in foliage and branch development. The lower prevalence of forked stems in the Age-25, deciduous cover plantations could therefore be explained in part by the presence of overtopping deciduous competition during the first years of the plantation, and in part by the use of small seedlings which would have less time to fork in the high light availability of the nursery. In this context, the presence of overtopping deciduous competition could be beneficial for cedar in terms of stem form, especially considering its shade tolerance.
All nursery stock has to meet strict criteria for plantation, and manual fork clipping can be done in some circumstances to meet these criteria. Cedar is however distinct from typically planted softwoods such as spruce and pine, notably because of its low apical dominance, its sylleptic growth (Briand et al. 1992), and its marked tendency to fork, particularly in response to trauma. Observation of cedar production at the nursery which provided cedar seedlings for the study area and of recent cedar plantations aged <2 months confirms that forking is already common at the time of planting. Future work on cedar plantations should therefore give more attention to planting stock production and planting process in order to determine the exact causes behind stem forking <30 cm.
Browsing
Although the sampling was designed to compare browsing impacts inside and outside mapped deer yards, cedar recruitment into safe-from-browsing height classes (>3 m) was not a general problem in the study area, in contrast to reports originating from areas with high deer or hare browsing pressure (Johnston 1972; Heitzman et al. 1999; Forester et al. 2008). As the deer yard populations change considerably through time, not all plantations were located in zones with high deer density during vulnerable years. Within the yard, none of the Age-25 plantations and half of the Age-15 plantations were in contact with high deer populations as the population had gone
29
down substantially and dispersed towards the northern end of the yard (Bélanger and Hélie 2006; Huot and Lebel 2012). The remaining plantations were close to known deer populations from the plantation year onward, and were therefore more likely to have been subject to winter deer browsing. Only the two suppressed Age-25 plantations showed recruitment problems, and only one site, located inside the deer yard, had a high number of cedar stems browsed by deer. This browsing remained at a low level, and its influence on cedar growth could not be detected as only one of its central trees happened to have been browsed. Cedar was near-systematically browsed by deer on non-suppressed Age-25 sites, but the damage was limited to the first 2 m of the 6–8 m high stems, and was therefore considered non-limiting to cedar height growth. While moose populations are low over most of the natural range of cedar, they are very high in the study area, averaging 11.4 individuals/10 km2 over the region (Lefort and Massé 2015). Moose browsing on
cedar was however restricted to a single site and remained at a low frequency and intensity, which confirms the limited preferential browsing of cedar by moose (Peek et al. 1976). Cedar browsing was observed on most sites and was constant within sites, but varied in prevalence and intensity between sites (Figure 3). Given the consistency of browsing within sites and the use of sites as a random effect factor in the mixed models, not identifying browsing as a factor contributing to variations in cedar growth was expected, the site effect being confounded to some extent with the browsing effect. Moreover, browsing damage can become undetectable through time and could be too recent for its impact to be detectable on cedar growth given that the sampling year was not included in the growth models in order to analyze only complete growth years.
Ungulates and hares did not generally browse on the same sites, but no differences in stand characteristics could be associated to this selection. Within deer yards, deer select their habitat based not only on browse availability and cover, but also on the characteristics of surrounding sites, connectivity, and stand shape (Morrison et al. 2003). While the little amount of deer browsing on cedar can be partly explained by the currently low deer population levels, deer could also be avoiding young cedar plantations because of their lack of winter cover, especially when located farther away from forest edges (Morrison et al. 2003).
Hare browsing was more abundant than ungulate browsing in the study area, which is consistent with the fact that although hare damage is recognized as less detrimental than deer damage, the opposite can be observed locally on natural cedar regeneration (Johnston 1972; Johnston 1990). All Age-25 plantations and Age-15 plantations with spruce or fir provide good winter cover for hare, and have abundant winter browse in the form of cedar. For instance, all cedars on both suppressed Age-25 sites with dense spruce canopies had their terminal shoots and branches
30
systematically browsed by hare, which likely created constant resprouting and prevented the creation of sizeable forks. Planting cedar together with a faster growing softwood such as spruce could accelerate the creation of good hare winter cover, therefore increasing the vulnerability of cedar to browsing before it can reach a safe-from-browsing height.
Both inside and outside the deer yard, ungulates appeared to have preferentially browsed fir over cedar, and preferentially browsed palatable competitor species (beaked hazel, willows, yellow and white birch, mountain maple and pin cherry) over cedar. This browsing decreased competition, and could therefore be a factor contributing to the high cedar growth rates observed in this study (Rooney and Waller 2003). The species associated with cedar could also influence the susceptibility of cedar to browsing: the presence of a palatable neighbour could increase detection and damage by herbivores (associative susceptibility) (Smit et al. 2006; Barbosa et al. 2009), or concentrate browsing on these palatable neighbours, therefore decreasing browsing on cedar (neighbour contrast defense) (Alm Bergvall et al. 2006); on the other hand, the presence of unpalatable neighbours could decrease detection and damage by herbivores (associative resistance) (Smit et al. 2006; Barbosa et al. 2009), or redirect browsing towards cedar (neighbour contrast susceptibility) (Alm Bergvall et al. 2006). In this study, the homogeneity of species communities within age categories prevented further statistical analysis, palatable competitive species being abundant and systematically browsed on all sites with open canopy. However, the ratio of unbrowsed cedar remained constant within deer yard while the ratio of unbrowsed competitive species declined within deer yard, which suggests neighbour contrast defense and/or associative resistance. The indirect effects that browsing on competing vegetation has on cedar could therefore have a considerable influence on cedar regeneration and development, and should be further investigated in a more controlled experiment.
Management implications
Some authors suggest that cedar becomes safe from browsing once it reaches 2 m in height (Cornett, Frelich, et al. 2000). However, considering the high browsing pressure in some areas and the effective winter browsing reach of deer and hare, a more conservative minimum safe height to avoid overbrowsing can be fixed at 3 m, height at which the top third of the tree is generally safe from browsing (Heitzman et al. 1999). This safe-from-browsing height does not take moose into account as moose browsing on cedar appears less preferential and is generally not recognized as a problem for tall cedar recruitment (Peek et al. 1976), as was observed in this study. Results show that a safe-from-browsing height of 3 m can be reached within 13 years, on
31
average, for non-suppressed sites and under low browsing pressure, and within 9 years on sites where overtopping competition was never present (Figure 5). This suggests that under similar growing conditions and with proper timing of silvicultural treatments, a 10-year browser exclusion would be sufficient to obtain a safe-from-browsing planted cedar stand.
This study drew a first portrait of cedar plantation development, and direct growth rate comparisons with other studies are therefore imperfect. However, given the ability of cedar to produce advanced regeneration because of its high shade tolerance and layering potential (Johnston 1990) and its ability to react well to stand openings even after a long suppression period (Heitzman et al. 1997; Hofmeyer, Kenefic & Seymour 2010; Ruel et al. 2014), the comparison is deemed pertinent to assess the full growth potential of the species. Maximum height growth rate for short cedars (<200 cm) under full light conditions was more than double the maximum height growth rate observed under a 25–36% canopy transmittance on sites of lower fertility in Québec (Larouche and Ruel 2015). Similarly, maximum height growth rate for tall cedars (>200 cm) was more than double that of mature even-aged cedar stands on rich and wet sites in Vermont (Hannah 2004). On rich swamps in Michigan, cedars remained vulnerable to browsing for 20–40 years following strip clear-cutting in cedar stands in the absence of competition and deer browsing (Verme and Johnston 1986; Heitzman et al. 1999), while cedars reached 2 m after an average of 36 years under partial shade and lower fertility in Québec (Larouche and Ruel 2015), and after 30–50 years under shade and high fertility in Minnesota (Cornett, Frelich, et al. 2000). Old stems harvested in Maine on fertile sites were found to reach 1 m in as little as 4 years and 4 m in as little as 19 years (Hofmeyer, Kenefic & Seymour 2010).
This study confirms previous findings suggesting that cedar can be, under the right conditions, a productive softwood species (Hofmeyer, Seymour & Kenefic 2010; Larouche and Ruel 2015). While cedar is shade tolerant and often starts growing in the shade as advanced regeneration (Hofmeyer, Kenefic & Seymour 2010), it can reach considerable growth rates under low browsing pressure and competition. The growth rates measured in this study, twice as high as previously reported, suggest that cedar could be regenerated by taking advantage of much narrower windows of opportunity than previously thought. Such was seemingly the case in the deer yard evaluated in this study, where most of the plantations were able to reach safe-from-browsing heights with no detectable growth suppression from browsing.
The much lower proportion of forked stems in the Age-25, deciduous cover plantations suggests that in the presence of deciduous competition, delaying brushing operations until cedars are well