HAL Id: hal-02627570
https://hal.inrae.fr/hal-02627570
Submitted on 26 May 2020
HAL is a multi-disciplinary open access archive for the deposit and dissemination of sci-entific research documents, whether they are pub-lished or not. The documents may come from teaching and research institutions in France or abroad, or from public or private research centers.
L’archive ouverte pluridisciplinaire HAL, est destinée au dépôt et à la diffusion de documents scientifiques de niveau recherche, publiés ou non, émanant des établissements d’enseignement et de recherche français ou étrangers, des laboratoires publics ou privés.
Distributed under a Creative Commons Attribution| 4.0 International License
Two large reciprocal translocations characterized in the
disease resistance-rich burmannica genetic group of
Musa acuminata
Marion Dupouy, Franc-Christophe Baurens, Paco Derouault, Catherine
Hervouet, Céline Cardi, Corinne Cruaud, Benjamin Istace, Karine Labadie,
Chantal Guiougou, Lyonel Toubi, et al.
To cite this version:
Marion Dupouy, Franc-Christophe Baurens, Paco Derouault, Catherine Hervouet, Céline Cardi, et al.. Two large reciprocal translocations characterized in the disease resistance-rich burmannica genetic group of Musa acuminata. Annals of Botany, Oxford University Press (OUP), 2019, 124 (2), pp.319-329. �10.1093/aob/mcz078�. �hal-02627570�
This is an Open Access article distributed under the terms of the Creative Commons Attribution License (http://creativecommons.org/licenses/ by/4.0/), which permits unrestricted reuse, distribution, and reproduction in any medium, provided the original work is properly cited. © The Author(s) 2019. Published by Oxford University Press on behalf of the Annals of Botany Company.
Two large reciprocal translocations characterized in the disease resistance-rich
burmannica genetic group of Musa acuminata
Marion Dupouy1,2, Franc-Christophe Baurens1,2, Paco Derouault1,2, Catherine Hervouet1,2, Céline Cardi1,2,
Corinne Cruaud3, Benjamin Istace3, Karine Labadie3, Chantal Guiougou4, Lyonel Toubi5, Frederic Salmon4,
Pierre Mournet1,2, Mathieu Rouard6, Nabila Yahiaoui1,2, Arnaud Lemainque3, Guillaume Martin1,2,† and
Angélique D’Hont1,2,†,*
1CIRAD, UMR AGAP, F-34398 Montpellier, France, 2AGAP, Université Montpellier, CIRAD, INRA, Montpellier SupAgro,
Montpellier, France, 3Genoscope, Institut de biologie François-Jacob, Commissariat à l’Energie Atomique (CEA), Université
Paris-Saclay, Evry, France, 4CIRAD, UMR AGAP, F-97130 Capesterre Belle Eau, Guadeloupe, France, 5CIRAD, UMR
AGAP, F-97170 Petit-Bourg, Guadeloupe, France and 6Bioversity International, Montpellier, France
†These authors contributed equally to this work.
* For correspondence. E-mail dhont@cirad.fr
Received: 18 February 2019 Returned for revision: 9 April 2019 Editorial decision: 1 May 2019 Accepted: 9 June 2019
• Background and Aims Banana cultivars are derived from hybridizations involving Musa acuminata subspe-cies. The latter diverged following geographical isolation in distinct South-east Asian continental regions and islands. Observation of chromosome pairing irregularities in meiosis of hybrids between these subspecies sug-gested the presence of large chromosomal structural variations. The aim of this study was to characterize such rearrangements.
• Methods Marker (single nucleotide polymorphism) segregation in a self-progeny of the ‘Calcutta 4’ acces-sion and mate-pair sequencing were used to search for chromosomal rearrangements in comparison with the
M. acuminata ssp. malaccensis genome reference sequence. Signature segment junctions of the revealed
chromo-some structures were identified and searched in whole-genome sequencing data from 123 wild and cultivated
Musa accessions.
• Key Results Two large reciprocal translocations were characterized in the seedy banana M. acuminata ssp.
burmannicoides ‘Calcutta 4’ accession. One consisted of an exchange of a 240 kb distal region of chromosome
2 with a 7.2 Mb distal region of chromosome 8. The other involved an exchange of a 20.8 Mb distal region of chromosome 1 with a 11.6 Mb distal region of chromosome 9. Both translocations were found only in wild ac-cessions belonging to the burmannicoides/burmannica/siamea subspecies. Only two of the 87 cultivars analysed displayed the 2/8 translocation, while none displayed the 1/9 translocation.
• Conclusion Two large reciprocal translocations were identified that probably originated in the burmannica genetic group. Accurate characterization of these translocations should enhance the use of this disease resistance-rich burmannica group in breeding programmes.
Key words: Musa acuminata, banana, chromosomal rearrangement, reciprocal translocation, paired-end sequencing, genotyping by sequencing.
INTRODUCTION
Bananas (Musa genus) provide staple food for millions of people in Asia, Africa, Latin America and Oceania, and represent a major cash crop around the world. Most current cultivars are de-rived from Musa acuminata (A genome, 2n = 2x = 22), some-times combined with Musa balbisiana (B genome, 2n = 2x = 22).
Musa acuminata diverged following the Pliocene geographical
isolation in distinct South-east Asian continental regions and
is-lands (Daniells et al., 2001; Perrier et al., 2009; Janssens et al.,
2016; Rouard et al., 2018). It has been divided into 6–9 partially interfertile subspecies (M. a. ssp. burmannica, burmannicoides,
siamea, malaccensis, truncata, errans, microcarpa, zebrina
and banksii) based on morphology and geographic distribution (Simmonds, 1962; Perrier et al., 2009). The current domestication
scenario suggests that plants were transported during human mi-grations, leading to hybridization between Musa species and
subspecies (Perrier et al., 2011). This resulted in the emergence
of inter(sub)specific hybrids with reduced fertility (Dodds and
Simmonds, 1948; Shepherd, 1999). Early farmers would then have selected parthenocarpic diploid and triploid hybrids produ-cing edible fruits with high flesh and low seed content. These hybrids were then propagated clonally. The hundreds of current cultivars are thus products of centuries – in some cases millennia – of vegetative propagation. Only a few of them are cultivated at a large scale and one clonal cultivar group, i.e. Cavendish, accounts for >50 % of world banana production. These large-scale mono-cultures have favoured the emergence of diseases and extensive
pesticide use (Lescot et al., 2008).
Dupouy
Observations of chromosomal pairing during meiosis showed irregularities in the M. acuminata and M. balbisiana interspe-cific hybrid and in M. acuminata intersubspeinterspe-cific hybrids, with
the presence of univalents and multivalents (Shepherd, 1999;
Jeridi et al., 2011). Within subspecies, meioses were generally found to be regular with bivalents. In addition, genetic map-ping studies involving M. acuminata hybrids revealed sub-stantial segregation distortion involving a few linkage groups (Fauré et al., 1993; Hippolyte et al., 2010; Mbanjo et al., 2012; Noumbissié et al., 2016). The presence of large chromo-somal structural variations between species and subspecies was suggested to be responsible for these irregularities. Based on the study of pairing configurations in a limited number of
M. acuminata intersubspecific hybrids, Shepherd (1999)
pro-posed that six translocation groups exist, differing from a ‘Standard’ (ST) group by 1–3 translocations. These groups are only partly concordant with subspecies delimitation, with the ‘Standard’ group being the largest one and comprised banksii,
microcarpa and malaccensis ssp. accessions.
The availability of a M. acuminata reference genome
se-quence (D’Hont et al., 2012; Martin et al., 2016) allowed us
to implement next-generation sequencing (NGS) technologies and comparative genomics to investigate large structural vari-ations within Musa. A first large reciprocal translocation be-tween chromosomes 1 and 4 was identified as compared with the M. acuminata reference genome sequence obtained from the ‘DH-Pahang’ M. acuminata ssp. malaccensis accession. Among wild accessions, this 1/4 translocation was found only in some of the ssp. malaccensis accessions, suggesting that it
emerged within this subspecies (Martin et al., 2017). The 1/4
translocation was suggested to correspond to the ‘Northern
Malayan’ karyotypic group proposed by Shepherd (1999), and
the M. acuminata reference genome sequence was suggested to correspond to the ST group. Strong segregation distortion and reduced recombination were observed around transloca-tion breakpoints in progeny from structurally heterozygous ac-cessions. Interestingly, the ‘Northern Malayan’ structure was
found to be preferentially transmitted to the progeny (Martin
et al., 2017).
Another large reciprocal translocation between chromosomes 1 and 3 and a large inversion on chromosome 5 were charac-terized in M. balbisiana as compared with the M. acuminata
reference genome sequence (Baurens et al., 2019). A high
pro-portion of aneuploids was observed, involving chromosomes 1, 3 and 5, in the progeny of a tetraploid accession bearing this
M. balbisiana chromosome structure in one copy and three
copies of the standard M. acuminata structure. Moreover, high segregation distortion and reduced recombination were
ob-served for these chromosomes (Baurens et al., 2019).
These studies showed that large structural variations cause segregation distortion and recombination reduction or suppres-sion in Musa structural hybrids, as observed in several other
plants such as Lens, Helianthus and peach (Tadmor et al., 1987;
Quillet et al., 1995; Jáuregui et al., 2001). Characterizing such rearrangements is thus important to facilitate the use of genetic resources in breeding programmes, in particular to improve dis-ease resistance.
In this study, we analysed the segregation of a self-progeny of a wild M. acuminata ssp. burmannicoides accession and
detected two large reciprocal translocations compared with the
M. acuminata ssp. malaccensis reference sequence. We then
ac-curately characterized breakpoints of these structural variations through discordant mate-pair read analysis. We developed an in
silico approach based on signature segment junctions to detect
translocation breakpoints in paired-end sequences from 123 ac-cessions representative of M. acuminata germplasm.
MATERIALS AND METHODS
Plant and sequencing material
A self-progeny of 76 individuals from the ‘Calcutta 4’ acces-sion (PT-BA-00051, CRB Plantes Tropicale, Guadeloupe) was produced at the CIRAD research station in Guadeloupe. DNA was extracted, and sequencing libraries were constructed using a genotyping by sequencing (GBS) approach and sequenced
on the GeT-PlaGe platform (https://get.genotoul.fr/) using the
Illumina Hiseq3000 sequencer.
Other banana plant material was obtained either from CRB
Plantes Tropicales (Guadeloupe, French West Indies, http://
crb-tropicaux.com/Portail) or from the Bioversity International
Musa Germplasm Transit Centre (Ruas et al., 2017)
(Supplementary data Table S1).
A total of 123 accessions were sequenced to obtain standard Illumina 2 × 150 paired-end reads using the HiSeq4000
plat-form at Genoscope (http://www.genoscope.cns.fr).
For 11 of these accessions, 5 kb insert mate-pair libraries were constructed and sequenced using the Illumina Hiseq2500
platform at Genoscope (http://www.genoscope.cns.fr).
This data set was supplemented by Illumina 5 kb mate-pair
sequencing data generated by Rouard et al. (2018) for three
accessions (‘Banksii’, ‘Maia’Oa’ and ‘Calcutta 4’) and de-posited in the National Center for Biotechnology Information (NCBI) Sequence Read Archive (SRA) under run IDs SRR7013759, SRR7013765 and SRR7013755. The assembly of the M. acuminata ssp. banksii accession ‘Banksii’ published by these authors, as well as PacBio reads related to this project (SRA ID SRR7013757), were also used.
Finally, ‘Calcutta 4’ and ‘Maia’Oa’ accessions were sequenced with a MinION nanopore sequencer from Oxford
Nanopore Technologies (Jain et al., 2016). As described by
Belser et al. (2018), a 30× sub-set of the longest nanopore reads was extracted from the total read set. These reads were then
as-sembled using the Smartdenovo assembler (Jue Ruan, https://
github.com/ruanjue/smartdenovo, git-commit 3d9c22e) with –k 17, as advised by the developer for larger genomes, and –c 1 to generate a consensus sequence.
SNP marker segregation analysis
Raw GBS sequencing data from the self-progeny were
demultiplexed using GBSX version 1.2 (Herten et al., 2015)
and adaptors were removed with cutadapt (Martin, 2011).
Variant calling was processed as described by Garsmeur et al.
(2018), using the VcfHunter package (https://github.com/ SouthGreenPlatform/VcfHunter). Mapping was performed on
the M. acuminata reference sequence version 2 (Martin et al.,
2016). Sites with read depths of <10 and >1000 were excluded.
Sites with a minor allele frequency of <5 % were considered homozygous. Sites with an alternate allele frequency of >15 % supported by at least three reads were considered heterozygous. Other sites were converted into missing data. single nucleotide polymorphism (SNP) markers were then filtered out based on their segregation ratio in the mapping population: a P-value
threshold of 4e-06 was applied with a χ2 test to compare the
observed marker segregation with the expected marker segre-gation (1:2:1 with a self-population). SNP markers with >2.5 % missing data and individuals with >1% missing data were re-moved from the SNP data set. Finally, 67 individuals were kept and 5281 SNP markers were selected to build the genetic map.
Five kilobase discordant mate-pair read analysis
To refine the location of the rearrangement breakpoints and to characterize the chromosome structures of 14 accessions, large insert mate-pair reads from the 14 mate-pair sequenced acces-sions were aligned to the M. acuminata ‘DH-Pahang’ reference genome sequence (version 2) available on the Banana Genome
Hub (Droc et al., 2013). They were analysed to identify
dis-cordant read clusters according to the methodology described in Martin et al. (2017), using Scaffremodler tools (Martin
et al., 2016) available on the South Green platform (Southgreen Collaborators, 2016). Discordant read clusters were viewed
using CIRCOS software (Krzywinski et al., 2009).
Alignment of translocation breakpoints between ‘DH-Pahang’ and ‘Calcutta 4’
To precisely compare the rearrangement breakpoints be-tween ‘DH-Pahang’ and ‘Calcutta, the four genomic regions of the ‘DH-Pahang’ reference genome (version 2) corres-ponding to translocation breakpoint regions (chromosome 1 between 8.23 and 8.27 Mb, chromosome 2 between 29.26 and 29.28 Mb, chromosome 8 between 37.715 and 37.735 Mb and chromosome 9 between 11.57 and 12.61 Mb) were aligned to the ‘Calcutta 4’ preliminary assembly using blastn (BLAST+
2.6.0; Camacho et al., 2009) with an e-value threshold of 1e-20
and without masking low-complexity regions. Then com-parisons between sequences were performed using Gepard (Krumsiek et al., 2007) (Supplementary data Table S2).
Signature segment junction detection
In order to characterize the chromosome structure of the 123 studied Musa accessions, paired reads from 123 accessions were aligned to the complete M. acuminata ‘DH-Pahang’ reference genome, the ‘Calcutta 4’ assembly, the ‘Maia’Oa’ assembly and the ‘Banksii’ corrected assembly using bowtie2 in very sensitive mode (see next section). Pairs properly mapped with reads on either side of a signature segment junction (SSJ; i.e. the junc-tion between two genomic segments that is specific to one of
the chromosome structures; Supplementary data Fig. S1) in a
flanking window of 1000 bp around the SSJ were counted.
Local reassembly of the chromosome 8 translocation break-point in ‘Maia’Oa’ and ‘Banksii’ accessions
To precisely characterize the positions of the SSJs relative to the breakpoint region of chromosome 8 in two accessions rep-resentative of zebrina and banksii subspecies, long reads from ‘Maia Oa’ and ‘Banksii’ were compared with the M. acuminata ‘DH-Pahang’ reference chromosome 8 breakpoint region. Raw long reads from ‘Maia’Oa’ and ‘Banksii’ accessions were
corrected using the correct option of Canu 1.6 (Koren et al.,
2017) with default parameters. Corrected reads were aligned
to the M. acuminata ‘DH-Pahang’ reference genome version 2
using Graphmap (Sović et al., 2016) with default parameters.
For each accession, the longest read overlapping the two SSJs of M. acuminata ‘DH-Pahang’ reference chromosome 8 was kept. Selected long reads were corrected by aligning Illumina
short reads from their respective accessions with bwa mem (Li
and Durbin, 2009) with default parameters. Consensus between
short reads was calculated with bcftools (Li, 2011).
The resulting consensus sequences were compared with the 37.718–37.732 Mb region of M. acuminata ‘DH-Pahang’ ref-erence chromosome 8 using Gepard. Then we compared the ‘Maia’Oa’ consensus sequences of the chromosome 8 break-point with the ‘Maia’Oa’ scaffolds and the ‘Banksii’ consensus sequences of the chromosome 8 breakpoint with the ‘Banksii’ scaffolds using blastn, with an e-value threshold of 1e-20, while not masking low-complexity regions to confirm that the region has been correctly assembled. An inconsistency between the ‘Banksii’ corrected long read and its assembly was noticed, probably due to a short read assembly error. The genomic re-gion in the original assembly was thus replaced by the new consensus sequence. Finally, the corresponding regions of the ‘Banksii’ and ‘Maia’Oa’ assembly were aligned and compared with the 1000 bp flanking window around the two M. acuminata ‘DH-Pahang’ reference chromosome 8 SSJs.
Factorial analysis using SNP data
To investigate the distribution of the translocated chromo-somes in M. acuminata, a factorial analysis was performed. Paired-end reads (2 × 150) Illumina sequencing data from the 83 M. acuminata diploid accession studied were used to pro-duce a genotype call for each accession using vcfHunter tools (Garsmeur et al., 2018; https://github.com/SouthGreenPlatform/ VcfHunter). The process_reseq_1.0.py and VcfPreFilter.1.0.py programs were used to (1) align Illumina reads along the
M. acuminata ‘DH-Pahang’ reference genome sequence
(ver-sion 2) (Martin et al., 2016) using Burrows–Wheeler Alignment
version 0.7.15; (2) remove duplicates using the MarkDuplicates
option of Picard Tools (version 2.7) (http://broadinstitute.
github.io/picard/); (3) locally realign reads around indels using the IndelRealigner tool of the GATK software package (version
3.6) (McKenna et al., 2010); (4) count all mapping bases that
had a mapping quality ≥10 with the bam-readcount program (https://github.com/genome/bam-readcount); and (5) call a genotype based on the maximum likelihood of the genotype ac-cording to a binomial distribution assuming a sequencing error rate of 0.005. The variant calling file was formatted in VCF format. The VCF file was then filtered using the vcfFilter.1.0.py program with the following options: a minimal coverage by
Dupouy
accession of 10 (–MinCov 10), a maximal coverage by acces-sion of 119 (–MaxCov 119), a minimal relative allele frequency by accession of 0.1 (–MinFreq 0.1), a minimal absolute allele frequency by accession of 3 (–MinAl 3), no missing genotypes in a line allowed (–nMiss 0), filtering out indels (–RmType INDELS) and non-diallelic sites (–RmAlAlt 1:3:4:5). A sub-set of 3092 polymorphous SNPs dispersed along the 11 chromo-somes of the reference sequence was used to calculate a dis-similarity matrix using vcf2dis.1.0.py script. The disdis-similarity index between two accessions was calculated from the VCF file as the proportion of unmatching alleles between two acces-sions. The dissimilarity matrix was used to perform a factorial
analysis using R version 3.2.4 software (http://www.r-project.
org). Since the cultivated accessions originated from the wild
banana genepool, the factorial analysis was performed with the 32 wild accessions. The 51 cultivated accessions were then pro-jected along the synthetic axes.
RESULTS
Genetic evidence of two large reciprocal translocations in the ‘Calcutta 4’ accession
A self-progeny from the ‘Calcutta 4’ accession was genotyped by sequencing. A total of 5281 markers segregating in 67 indi-viduals with a 1:2:1 ratio were selected. Pairwise associations between ‘Calcutta 4’ markers projected on the 11 M. acuminata reference chromosome sequence showed, for most markers physically close on the reference sequence, strong
gen-etic linkage, as expected (Supplementary data Fig. S2A, B).
However, a complete break in genetic linkage was observed within a few chromosomes. Linkage breaks were observed on chromosome 2 at position 29.2 Mb and on chromosome
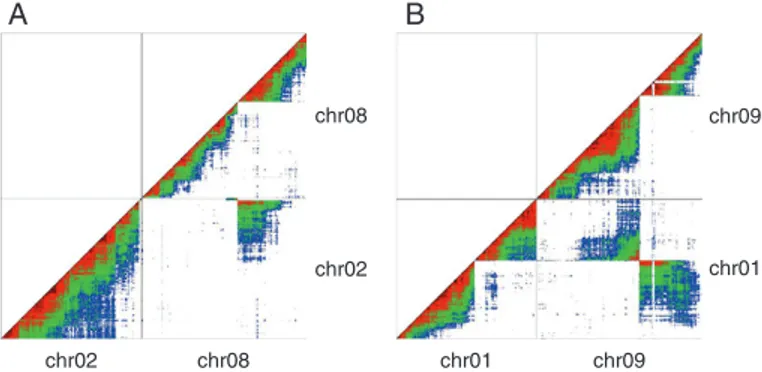
8 at position 37.7 Mb (Fig. 1A). In addition, a small cluster
of markers (four markers) from the distal region of reference chromosome 2 was found in ‘Calcutta 4’ genetically linked with chromosome 8 markers, whereas a distal part of reference chromosome 8 was found to be linked with chromosome 2 in ‘Calcutta 4’.
A similar situation was observed for chromosomes 1 and 9. Linkage breaks were observed on chromosomes 1
and 9 at 8.2 and 11.4 Mb, respectively (Fig. 1B). Markers
surrounding these breaks linked, in ‘Calcutta 4’, a distal re-gion of reference chromosome 1 to reference chromosome 9 and the rest of chromosome 1 to a distal part of reference chromosome 9.
These observations suggested the presence of distinct chromosome structures in ‘Calcutta 4’ as compared with the
M. acuminata reference sequence. These structures resulted
from two reciprocal translocations, one involving chromosomes 1 and 9 and the other involving chromosomes 2 and 8. The ob-served linkage breaks were complete, indicating that ‘Calcutta 4’ is structurally homozygous for these translocations.
Characterization of the translocation breakpoints
Translocation breakpoints were further characterized using 5 kb mate-pair reads from ‘Calcutta 4’ aligned to the ‘DH-Pahang’ reference sequence to search for discordant read alignments.
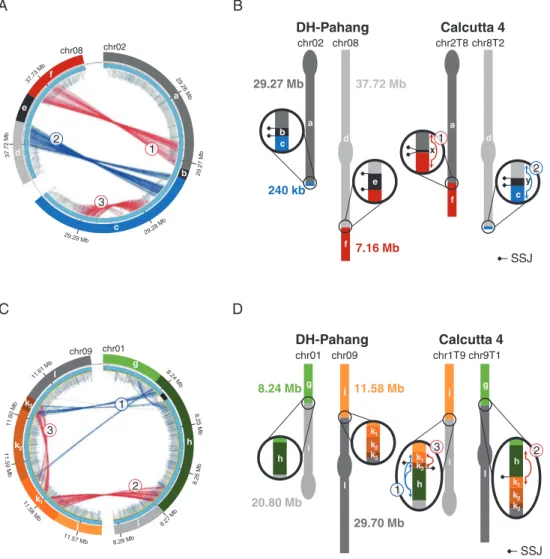
For chromosomes 2 and 8, two clusters of discordant reads were detected in the region of chromosomes 2 and 8 and found to be genetically linked in the self-progeny of
‘Calcutta 4’ (Fig. 2A). Using Scaffremodler, these discordant
read clusters were identified as resulting from the presence of a reciprocal translocation in ‘Calcutta 4’ as compared with
the reference sequence (Fig. 2B). Cluster 2 linked a distal
re-gion of 240 kb (c) of chromosome 2 to 45 Mb of chromosome 8 (d), resulting in a distinct chromosome structure hereafter
referred to as 8T2 (Fig. 2B). Cluster 1 linked a distal region
of 7.2 Mb from chromosome 8 (f) to 29.3 Mb of chromo-some 2 (a), resulting in a distinct chromochromo-some structure
here-after referred to as 2T8 (Fig. 2B). On reference chromosomes
2 and 8, the two discordant read clusters are separated by small chromosome segments of 3 kb (e) and 1.2 kb (b), re-spectively, that were not covered by any read sequences in ‘Calcutta 4’, thus suggesting their absence in this accession (Fig. 2A). No concordant reads overlapped the breakpoint re-gions, thus indicating that ‘Calcutta 4’ is homozygous for this translocation.
For chromosomes 1 and 9, the Scaffremodler program could not automatically interpret the discordant read cluster pattern. Therefore, we manually explored discordant read clusters linking those chromosomes and found a complex pattern of interchromosomal and intrachromosomal
dis-cordant read clusters (Fig. 2C). Discordant read cluster 3
and concordant reads along the k2 segment indicated the de-letion of this segment in one chromosome. Discordant read
cluster 1 linked the k1–k3 segment to the h segment, resulting
in k1–k3–h and k1–k2–k3–l chromosome fragments. Finally,
cluster 2 linking the h fragment to the k1 fragment reduced
possible combinations to reconstruct the chromosome
re-gions, without missing any segment, to a g–h–k1–k2–k3–l
structure for one chromosome and a j–k1–k3–h–i structure
for the other. These chromosome structures corresponded to a reciprocal translocation that occurred in two distinct chromosomes. The first one, hereafter referred to as 1T9, linked a 8.24 Mb distal region of chromosome 1 (g) with 29.7 Mb of chromosome 9 (l). The second one, hereafter re-ferred to as 9T1, linked an 11.6 Mb distal region of
chromo-some 9 (j), with 20.8 Mb of chromochromo-some 1 (i) (Fig. 2D).
chr02 chr08 chr02 chr08 chr01 chr09 chr01 chr09 A B
Fig. 1. Genetic linkage between SNP markers in the ‘Calcutta 4’ self-progeny projected on M. acuminata reference chromosomes 2 and 8 (A) and 1 and 9 (B). Each dot represents linkage between two markers. Linkage intensity is
repre-sented by a warm–cool colour gradient from dark red (strong) to blue (weak).
Refining the translocation breakpoints in ‘Calcutta 4’
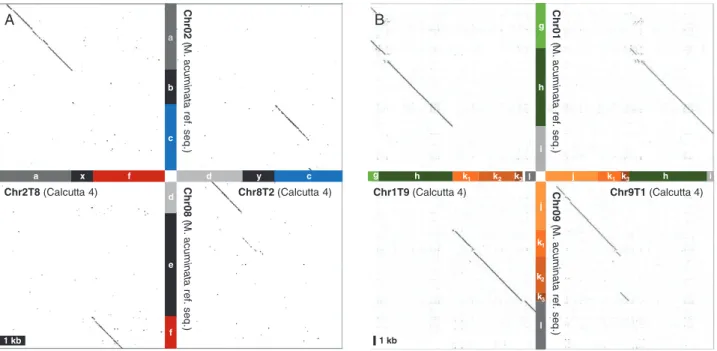
A ‘Calcutta 4’ preliminary assembly was compared with the ‘DH-Pahang’ M. acuminata reference sequence to identify ‘Calcutta 4’ scaffolds overlapping the translocation breakpoints. Two large scaffolds were identified for the 2/8 translocation. One scaffold (2.54 Mb long) contained the 2T8 breakpoint with a segment that aligned to reference chromosome 2 (a) and a segment that aligned to reference chromosome 8 (f) separated by a 600 bp segment (x) with no similarity to the corresponding
region in reference chromosomes 2 (b) or 8 (e) (Fig. 3A). The
second scaffold (3.15 Mb long) contained the 8T2 breakpoint, with a segment that aligned to reference chromosome 8 (d) and another that aligned to reference chromosome 2 (c) separated by a 1.2 kb segment (y), with no similarity to the corresponding
region in reference chromosomes 2 (b) or 8 (e) (Fig. 3A).
For the 1/9 translocation, two scaffolds were also identified. One scaffold (6.9 Mb long) contained the 1T9 breakpoint, with segments that aligned to reference chromosome 1 (g and h)
and segments that aligned to reference chromosome 9 (k1, k2,
k3 and l) (Fig. 3B). The second scaffold (5.7 Mb long)
con-tained the 9T1 breakpoint, with segments that aligned to
refer-ence chromosome 9 (j, k1 and k3) and segments that aligned to
chromosome 1 (h and i).
These data validated the proposed chromosome structures based on discordant read analysis and revealed the presence, at the breakpoints, of chromosomes 2T8 and 8T2 of segments (x and y) not present in the reference sequence.
Distribution of the two translocations in Musa germplasm
Five kilobase mate-pair discordant read analysis. To analyse
the distribution of the two translocations in Musa germplasm, we first used 5 kb mate-pair reads available from 13 M. acuminata accessions (five wild seedy accessions and eight hybrid
culti-vated accessions; Supplementary data Table S1). Paired reads
A C B D g i h l j l g h i j h chr01 chr09 chr1T9 chr9T1 DH-Pahang Calcutta 4 k1 k2 k3 8.24 Mb 20.80 Mb 11.58 Mb 29.70 Mb 1 3 2 k1 k2 k3 k1 k3 SSJ a c b f d e
F
f a x d c y chr02 chr08 chr2T8 chr8T2 DH-Pahang Calcutta 4 29.27 Mb 240 kb 37.72 Mb 7.16 Mb 1 2 SSJ chr02 chr08 1 2 3 e b f d a c chr09 chr01 2 3 1 j k1 l k2 k3 i g h 37 .7 2 M b 29.29 Mb 11.57 Mb 11. 59 Mb 8.28 Mb 8.26 Mb 8.27M b 11.5 8M b 29. 27 M b 29.28 M b 29 .26 M b 37.7 3 Mb 11.6 0 M b 8.2 5 M b 8.2 4 Mb 11.61 M bFig. 2. Paired-read mapping evidence for two reciprocal translocations in ‘Calcutta 4’ and schematic chromosomal diagram representations. (A and C) Circos representation of significant discordant read clusters from ‘Calcutta 4’ compared with the M. acuminata reference sequence assembly, with a focus on paired read clusters detected in the targeted regions of chromosomes 2 and 8, and chromosomes 1 and 9. Grey internal lines correspond to ‘Calcutta 4’ paired reads with correct orientation and insert size, while red and blue lines correspond to discordant pairs with higher insert size and reverse mapping orientation, re-spectively. Note: cluster 3 on segment c indicates a small deletion in ‘Calcutta 4’ outside the translocation event. (B and D) Schematic chromosome structures for ‘Calcutta 4’ chromosomes based on the paired-read mapping interpretation. Black segments are accession specific. Signature segment junctions (SSJs) are
represented with diamonds.
Dupouy
were aligned to the ‘DH-Pahang’ reference sequence, and dis-cordant clusters identified in ‘Calcutta 4’ as corresponding to the 2T8, 8T2, 1T9 and 9T1 chromosome structures were
searched (Supplementary data Fig. S3A, B).
Among the 13 M. acuminata accessions, 2T8 and 8T2 chromosome structures were detected in one accession, i.e. the ‘Manang’ diploid cultivar. In this accession, concordant mate-pair reads spanning the breakpoints were also observed, revealing that this accession is structurally heterozygous, with one set of reference chromosomes 2 and 8 and one set of chromosome structures 2T8 and 8T2. All other accessions were found to be homozygous with two sets of reference
chromo-somes 2 and 8 (Supplementary data Fig. S3A).
No discordant clusters corresponding to chromosomes 1T9 and 9T1 were observed in the 13 accessions surveyed, and all accessions showed concordant mate-pair reads corres-ponding to reference chromosomes 1 and 9. These accessions were thus homozygous for reference chromosomes 1 and 9 (Supplementary data Fig. S3B).
Signature segment junctions searched in whole-genome
sequencing (WGS) data. To further characterize the
distribu-tion of 2T8, 8T2, 1T9 and 9T1 chromosome structures in Musa diversity, we used the Illumina paired-end sequence generated on 123 accessions. These accessions included 97 M. acuminata accessions with 32 diploid wild seedy accessions and 65 cul-tivated intersubspecific hybrids (51 diploids and 14 triploids), four diploid accessions from other species (two M. balbisiana and two M. schizocarpa) and 22 interspecific cultivated hybrids involving M. acuminata (four diploids and 18 triploids) (Supplementary data Table S1).
In the distinct chromosomal structures, distinct chromosomal segments were juxtaposed, so a junction between chromosome segments could be specific to one chromosomal structure and constitute a signature of this structure (hereafter referred to as an SSJ). Such SSJs were searched at the 2/8 and 1/9 transloca-tion breakpoints in ‘Calcutta 4’ and in the corresponding region of the ‘DH-Pahang’ reference genome sequence.
Eight SSJs could be identified for translocation 2/8, with two per chromosome structure: a–b and b–c segment junctions for chromosome 2, d–e and e–f segment junctions for chromosome 8, a–x and x–f segment junctions for chromosome 2T8, and
d–y and y–c segment junctions for chromosome 8T2 (Fig. 2;
Supplementary data Table S3).
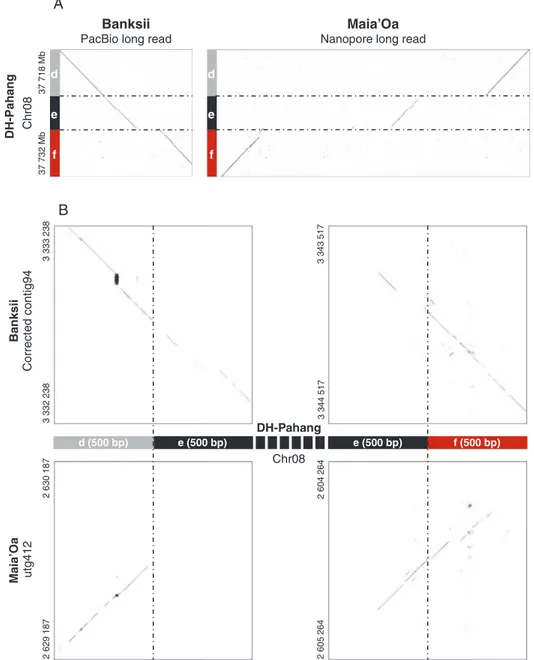
In a first round of analysis, for many accessions we detected SSJs of reference chromosome 2 but did not detect the signa-tures of reference chromosome 8. We thus compared the d–e–f breakpoint region of ‘DH-Pahang’ with the corresponding region of two additional accessions, for which long read sequences and sequence scaffolds were available (accession ‘Banksii’ from ssp. banksii and accession ‘Maia’Oa’ from ssp.
zebrina). The comparison revealed small structural variations
in ‘Maia’Oa’ and ‘Banksii’ compared with ‘DH-Pahang’ (Fig.
4). These structural variations, when present in the tested
acces-sion, resulted in paired-end reads that could not map on the se-quence used as reference for the alignment (here ‘DH-Pahang’), which may explain why SSJs of reference chromosome 8 could not be detected in some accessions. To increase the chance of detecting SSJs corresponding to chromosome 8, we accur-ately identified their positions on the ‘Maia’Oa’ preliminary assembly and the ‘Banksii’ corrected assembly, and aligned paired-end data from the 123 accessions using these assemblies
g h i l j Chr02 (M. acum inata ref. seq. ) Chr2T8 (Calcutta 4) Chr8T2 (Calcutta 4) y c d a x f a b c e f d k1 k2 k3 g h k1 k2 k3 l j k1 k3 h i A B Chr08 (M. acum inata ref. seq. ) Chr01 (M. acuminata ref. seq.) Chr09 (M. acuminata ref. seq. ) Chr1T9 (Calcutta 4) Chr9T1 (Calcutta 4) 1 kb 1 kb
Fig. 3. Dot-plot representation of alignments between ‘Calcutta 4’ scaffolds and the M. acuminata reference chromosome sequence at translocation breakpoints. (A) Translocation 2/8: ‘Calcutta 4’ for breakpoint regions of chromosomes 2T8 (scaffold utg154) and 8T2 (scaffold utg170) are represented on the horizontal axis. The corresponding regions in the M. acuminata reference genome are represented on the vertical axis. Each compared region is 6 kb long. A small deletion in segment c of chromosome 2 can be noticed, which corresponds to part of the 5 kb deletion observed in Fig. 2A. (B) Translocation 1/9: ‘Calcutta 4’ for breakpoint regions of chromosomes 1T9 (scaffold utg195) and 9T1 (scaffold utg94) are represented on the horizontal axis. The corresponding regions in the M. acuminata
reference genome are represented on the vertical axis. Each compared region is 70 kb long. The colour coding is the same as in Fig. 2.
as additional references (Supplementary data Table S1) (see the Materials and Method for ‘Banksii’ assembly correction).
The expected SSJs were detected for the four accessions used as sequence template to align the paired reads (‘DH-Pahang’, ‘Maia’Oa’, ‘Banksii’ and ‘Calcutta 4’). SSJs of chromosome 2T8 and of chromosome 8T2 were detected as expected in ‘Calcutta 4’. SSJs of chromosome 2 were detected in ‘Pahang’, ‘Maia’Oa’ and ‘Banksii’. However, SSJs of reference chromo-some 8 were detected in paired-end reads from ‘Pahang’, ‘Maia’Oa’ or ‘Banksii’ only when alignment was performed on scaffolds from the same accession. This confirmed that small structural variations within accessions can hamper proper detec-tion of SSJs and thus that only a positive result for the presence
of an SSJ can be directly interpreted with confidence. However, since ‘DH-Pahang’, ‘Banksii’ and ‘Maia’Oa’ share the same
macrostructure for chromosome 8 (Fig. 4A), the detection of
SSJs in any of these three accessions was hereafter interpreted as indicating the presence of the chromosome 8 structure.
Among the 123 accessions tested, only seven displayed sig-natures of chromosome 2T8 and chromosome 8T2. Five wild
M. accessions (‘Long Tavoy’, ‘Pisang Prentel’, ‘Calcutta 4’,
‘Khae Phrae’ and ‘Pa Rayong’) displayed the four signatures of chromosome 2T8 and chromosome 8T2, but no SSJs of refer-ence chromosomes 2 and 8. Moreover, two M. acuminata cul-tivated accessions displayed some signatures of chromosomes 2T8 and 8T2. Accession ‘Hom’ had four SSJs of reference
e (500 bp) d (500 bp) e (500 bp) f (500 bp) Banksii Maia’Oa Corrected contig94 utg412 DH-Pahang Chr08 3 333 238 3 332 238 3 344 517 3 343 517 2 630 187 2 629 187 2 605 264 2 604 264 Banksii
PacBio long read
Maia’Oa
Nanopore long read
DH-Pahang Chr0 8 37 71 8 Mb 37 732 Mb f d e f d e A B
Fig. 4. Dot-plot representation of alignments between the M. acuminata reference chromosome 8 and ‘Maia’Oa’ and ‘Banksii’ sequences in the region corres-ponding to the 2/8 translocation breakpoints. (A) Macrostructure: M. acuminata reference sequence for chromosome 8 (from 37 718 Mb to 37 732 Mb) is repre-sented on the vertical axes. Homologous ‘Banksii’ PacBio long read and ‘Maia’Oa’ nanopore long reads are reprerepre-sented on the horizontal axis. (B) Microstructure: 500 bp regions of the M. acuminata reference chromosome 8 flanking the d–e and e–f segment junction is represented on the horizontal axis. Homologous regions
in ‘Banksii’ (corrected contig94) and ‘Maia’Oa’ (scaffold utg412) are represented on the vertical axes. The colour coding is the same as in Fig. 2.
Dupouy
chromosomes 2 and 8 and three signatures of chromosomes 2T8 and 8T2, and was thus classified as structurally hetero-zygous with chromosomes 2, 8, 2T8 and 8T2 structures. The ‘Manang’ accession had three SSJs for reference chromosomes 2 and 8 and two SSJs for chromosome 2T8, thus supporting its structurally heterozygous classification based on the 5 kb mate-pair discordant read analysis.
Among the remaining 90 M. acuminata accessions, 82 displayed the four SSJs for reference chromosomes 2 and 8 and eight accessions had at least one signature for reference chromosome 2 and one SSJ for reference chromosome 8 (Supplementary data Table S1). Two other M. acuminata acces-sions (‘Pa Patthalong’ and ‘Pisang Serun 400’) had SSJs only for reference chromosome 2.
Among the four accessions representative of other Musa species, one M. schizocarpa accession (ITC0926) had the four signatures of chromosomes 2 and 8. The other M. schizocarpa accession (ITC0599) and both M. balbisiana accessions only displayed the two SSJs of reference chromosome 2.
Finally, the 22 interspecific hybrid accessions showed 3–4 SSJs of chromosomes 2 and 8, and were thus identified as having at least one copy of reference chromosomes 2 and 8.
Regarding the 1/9 translocation, the intricate duplications at translocation breakpoints complicated the identification of SSJs specific to the four chromosome structures. We identified
two SSJs for chromosome 1T9 that corresponded to k1–k3 and
k3–h segment junctions, and one signature position for
chromo-some 9T1 that corresponded to the h–k1 segment junction
(Supplementary data Table S4). No segment junctions were specific to reference chromosomes 1 and 9, so no SSJs could be used to reveal these chromosome structures.
Within the 123 accessions tested, five accessions displayed
one SSJ for chromosome 1T9 (SSJ k1–k3) (‘Calcutta 4’, ‘Pisang
Prentel’, ‘Long Tavoy’, ‘Khae Phrae’ and ‘Pa Rayong’). In addition, ‘Calcutta 4’ showed the SSJ of chromosome 9T1 (Supplementary data Table S1). Among them, ‘Calcutta 4’ proved to be homozygous for chromosome structures 1T9 and 9T1 based on the segregation analysis findings.
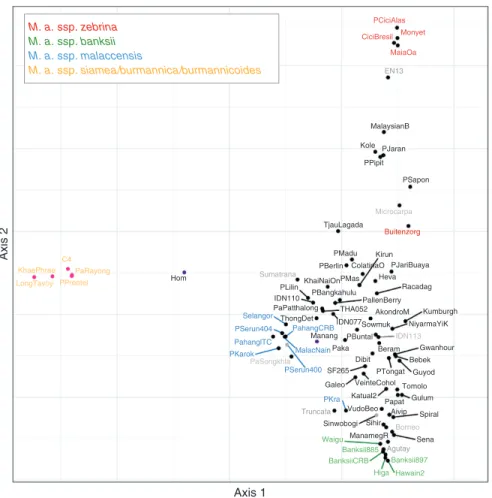
Factorial analysis with Musa acuminata diploid accessions. A factorial analysis was performed on 3092 SNPs identified from Illumina sequences of the 83 diploid wild and cultivated
M. acuminata accessions (Fig. 5). The first axis separated ssp.
burmannica, burmannicoides and siamea accessions from the
others, and explained 27 % of the SNP variance. The second axis separated ssp. zebrina and banksii, and explained 21% of the data variance. The third axis explained an additional 16 % of the data variance and separated ssp. malaccensis from the
other accessions (Supplementary data Fig.S4).
The five wild accessions displaying only chromosomes 2T8 and 8T2 were confined in one genetic group, i.e. the
burmannica group, which includes accessions for ssp.
burmannica, burmannicoides and siamea. Those accessions
were also those in which the translocation between chromo-somes 1 and 9 was detected. Heterozygous accessions for chromosomes 2, 8, 2T8 and 8T2 (‘Hom’ and ‘Manang’) corres-ponded to cultivars and were located between the burmannica
group and the rest of the accessions. ‘Hom’ was equidistant and isolated between both groups, while ‘Manang’ was closer to the non-burmannica group.
DISCUSSION
We identified two reciprocal translocations in the Musa
acuminata ssp. burmannicoides accession ‘Calcutta 4’
com-pared with the reference genome sequence, i.e. M. acuminata ssp. malaccensis ‘DH-Pahang’. One reciprocal translocation involved chromosomes 2 and 8, resulting in chromosomes 2T8 and 8T2. The other one involved chromosomes 1 and 9, re-sulting in chromosomes 1T9 and 9T1. ‘Calcutta 4’ was found to be homozygous for both translocations.
These translocated chromosome structures were first searched in 13 accessions using 5 kb mate-pair discordant read analysis. In addition, SSJs specific to the distinct chromosome structures were searched in 123 accessions representative of
Musa diversity involved in cultivated banana for which
paired-end sequence data were available.
We found that these methods, particularly SSJ detection, were sensitive to the presence of polymorphism (SNPs and INDELs) and repeated sequences. Thus, only a positive re-sult for the presence of an SSJ could be directly interpreted with confidence. However, in diploid accessions, we expected that an accession in which we detected chromosomes 1T9, 2T8, 2 or 1 also had the complementary chromosome struc-tures 9T1, 8T2, 8 or 9, respectively. Otherwise, this accession would miss a chromosome segment, i.e. a configuration that would most probably be lethal (particularly during the hap-loid gametic stage). This assumption was confirmed in all cases where it could be verified. This was the case for ‘Pisang Madu’, ‘Manang’ and ‘Malaccensis Nain’ accessions for which chromosome 8 was detected by discordant 5 kb mate-pair read analysis, while not or partially being detected with SSJs.
Among the 36 wild accessions analysed, only five accessions were identified as having the 2T8 and 8T2 structure, most prob-ably in the homozygous state. The same five accessions were the only ones identified as having at least one copy of the 1T9 and 9T1 chromosome structure. Chromosome 9T1 could not be detected in four of them. However, considering that the ab-sence of the complementary structure would probably be lethal, these accessions were assumed to bear the 9T1 chromosomal structure. One of these accessions, ‘Calcutta 4’, proved to be homozygous for both translocations based on segregation ana-lysis and on 5 kb mate-pair discordant read anaana-lysis. These five accessions corresponded to all wild accessions tested from ssp. burmannicoides (‘Calcutta 4’), siamea (‘Pa Rayong’ and ‘Khae Phrae’) and burmannica (‘Long Tavoy’ and ‘Pisang Prentel’). Twenty-six wild M. acuminata accessions were iden-tified as having the 2 and 8 chromosomal structures, most prob-ably in the homozygous state. Among them, four accessions (‘Malaccensis Nain’, ‘Pahang’, ‘Borneo’ and ‘Maia’Oa’) were shown to be homozygous for these structures based on 5 kb mate-pair discordant read analysis. One last wild M. acuminata accession (‘Pisang Serun 400’) could not be structurally char-acterized in our study.
Musa balbisiana and M. schizocarpa were only partially
characterized using SSJ analysis, but they were previously
reported as being homozygous for reference chromosomes 2 and 8 at the 2/8 breakpoint and for chromosomes 1 and 9 at the
1/9 breakpoint (Belser et al., 2018; Baurens et al., 2019).
Among the 87 cultivated accessions tested, only two acces-sions (‘Manang’ and ‘Hom’) were identified as having the 2/8 translocated structure, both in the heterozygous state. The 1/9 translocated structure was not detected in any cultivars. A total of 84 cultivated accessions were identified as having the 2 and 8 chromosome structure, most probably in the homozy-gous state. Among them, seven accessions (‘Akondro Mainty’, ‘Pisang Madu’, ‘Galeo’, ‘Pisang Lilin’, ‘Paka’, ‘Grande Naine’ and ‘IDN 110’) proved to be homozygous for these structures based on 5 kb mate-pair discordant read analysis. No structural characterization could be obtained for the diploid cultivated ac-cession (‘Sinwobogi’).
Based on chromosomal pairing irregularities at meiosis in
intersubspecific hybrids, Shepherd (1999) suggested the
ex-istence of seven M. acuminata translocation groups in which accessions were structurally homogeneous. The ‘Standard’ (ST) group is the largest one, consisting of ssp. banksii,
microcarpa and malaccensis accessions. The other groups
were named according to the geographic origins of their rep-resentatives. The ‘Northern Malayan’ (NM) group includes
some malaccensis accessions, the ‘Northern 1’ group includes some burmannicoides and siamea accessions, the ‘Northern 2’ group includes other burmannica and siamea accessions, the ‘Malayan Highland’ group is based on one truncata accession and the Javanese group is based on two zebrina accessions, whereas the ‘East African’ group is based on one unclassified
accession. Martin et al. (2017) identified a reciprocal
transloca-tion involving chromosomes 1 and 4, compared with the ref-erence genome sequence, in several malaccensis accessions, and suggested that it corresponds to the NM group, while the reference genome sequence corresponds to the ST group. The ‘Calcutta 4’ accession considered in this study was used by
Shepherd (1999) as a representative of the ‘Northern 1’ group. The ‘Northern 1’ group was suggested to differ from the ST group by two translocations. Our results showed that the two reciprocal translocations between chromosomes 2 and 8 and between chromosomes 1 and 9 corresponded to this ‘Northern
1’ group defined by Shepherd (1999).
Burmannica, siamea and burmannicoides subspecies were
originally distinguished based on morphological characters
and the geographical distribution (Simmonds, 1962; Perrier
et al., 2009). Recent diversity studies based on diversity array technology (DArT) and simple sequence repeat (SSR)
M. a. ssp. zebrina M. a. ssp. banksii M. a. ssp. malaccensis M. a. ssp. siamea/burmannica/burmannicoides PCiciAlas Monyet CiciBresil MaiaOa EN13 MalaysianB Kole PJaran PPipit PSapon TjauLagada PMadu Kirun PJariBuaya Heva Racadag Kumburgh PallenBerry AkondroM PBerlin Hom Axis 2 C4 PaRayong KhaePhrae PPrentel LongTavoy ColatinaO PMas KhaiNaiOn PLilin IDN110 PaPatthalong
ThongDet IDN077THA052
IDN113 NiyarmaYiK Sowmuk Manang PBuntal Beram Dibit Paka Gwanhour Bebek Guyod PTongat SF265 Galeo VeinteCohol Axis 1 Tomolo Gulum Papat Spiral Katual2 VudoBeo Sinwobogi PKra PSerun400 MalacNain PahangCRB Selangor PSerun404 PahanglTC PKarok PaSongkhla Sihir Aivip Sena Borneo ManamegR Truncata Agutay Waigu Banksii885 Banksii897 Higa Hawain2 BanksiiCRB PBangkahulu Sumatrana Microcarpa Buitenzorg
Fig. 5. Factorial analysis performed on 32 wild M. acuminata accessions with projections of 51 cultivated accessions. The dissimilarity matrix was based on SNPs from WGS data. Pink dots indicate accessions homozygous for chromosomes 2T8 and 8T2 and carrying at least one version of chromosomes 1T9 and 9T1. Black dots indicate accessions homozygous for chromosomes 2 and 8. Purple dots represent heterozygous accessions for the 2/8 translocation. Grey dots represent accessions with an undetermined structure for the 2/8 translocation. Wild accession names are coloured according to their subspecies: yellow, M. acuminata ssp.
burmannica, burmannicoides and siamea; green, M. acuminata ssp. banksii; blue, M. acuminata ssp. malaccensis; red, M. acuminata ssp. zebrina; dark grey, other wild M. acuminata subspecies. Eigenvalues: axis 1 = 27.27; axis 2 = 21.11.
Dupouy
markers did not support this separation in three distinct
sub-species (Sardos et al., 2016; Christelová et al., 2017). The
presence of 1/9 and 2/8 translocations in the burmannica,
siamea and burmannicoides accessions we analysed
sup-ported the idea of a unified burmannica genetic group. However, the homogeneity of this genetic group should be reassessed once the hypothesis of a third translocation spe-cific to the ‘Northern 2’ group, which is assumed to include
burmannica and siamea accessions (Shepherd, 1999), is
con-firmed. Based on our sampling, the results obtained in this study suggested that translocations 1/9 and 2/8 emerged in the burmannica group and supported the hypothesis that the
Musa reference genome obtained with the malaccensis
ac-cession ‘DH-Pahang’ represented the ST group of Shepherd
(1999) and the ancestral structure.
The burmannica genetic group has been shown to constitute an interesting genetic reservoir of disease resistance: ‘Calcutta 4’ shows resistance to various pests and diseases such as nema-todes or black leaf streak disease, while ‘Long Tavoy’ and ‘Khae Phrae’ show resistance to Fusarium oxysporum f.sp.
cubense race 4 and nematodes, respectively (Vuylsteke et al.,
1992; Jones, 2000; Quénéhervé et al., 2009).
Our study detected only two cultivated accessions (‘Manang’ and ‘Hom’) among the 87 tested as being heterozygous for the 2/8 translocated structure, while none was detected for the 1/9 translocated structure. This supports the hypothesis that the
burmannica group has not been an important contributor to
pre-sent banana cultivars (Carreel et al., 1994).
Large chromosomal translocations have been shown to gen-erate segregation distortion and reduced recombination in pro-geny from structurally heterozygous parents in several plants (Tadmor et al., 1987; Quillet et al., 1995; Jáuregui et al., 2001)
including banana (Martin et al., 2017; Baurens et al., 2019).
Their impact on chromosome segregation is expected to vary depending on the structure of the chromosomes involved (meta-centric, acro(meta-centric, etc) and the characteristic of the translocated segments (size, position, gene content, etc.). Characterizing the impact of the two translocations we described on chromosome segregation will be essential to propose breeding strategies to enhance the use of the disease resistance-rich burmannica gen-etic group in breeding programmes.
Availability of supporting data
Raw sequence reads for the ‘Calcutta 4’ selfing popula-tion were deposited in the SRA of the NCBI (BioProject: PRJNA532826). The ‘Calcutta 4’ selfing population genotyping matrix, the breakpoint regions of the ‘Calcutta 4’ assembly, the ‘Maia’Oa’ and ‘Banksii’ long reads including the breakpoint regions of chromosome 8, the Illumina 5 kb reads mapping in the breakpoint regions of chromosomes 1, 2, 8 and 9 of 123
Musa accessions, and the VCF file comprising 3092 SNPs for
83 diploid wild and cultivated Musa acuminata accessions are available in the download section of the Banana Genome Hub (http://banana-genome-hub.southgreen.fr/download) under AF-C4_genotypingmatrix.tab, Calcutta4_breakpoints.fasta, corrected_long_reads_chr08breakpoint_MaiaOaBanksii.fasta, breakpoints_123Musa.vcf and 2-8_1-9_translocs.vcf names, respectively.
SUPPLEMENTARY DATA
Supplementary data are available online at https://academic.
oup.com/aob and consist of the following. Figure S1:
prin-ciple of signature segment junction detection. Figure S2:
genetic marker statistics along the 11 Musa acuminata
chromo-somes. Figure S3: paired read mapping of 14 Musa
acces-sions focused on the two reciprocal translocations detected
in ‘Calcutta 4’. Figure S4: factorial analysis performed on 32
wild M. acuminata accessions with projection of 51 cultivated
accessions. Table S1: accessions tested for their structure on
chromosomes 2, 8, 1 and 9. Table S2: genomic co-ordinates of
compared sequences. Table S3: genomic position of the SSJs
for the translocation 2/8. Table S4: genomic position of the
SSJs for the translocation 1/9. FUNDING
This work was supported by the Agropolis Fondation ‘GenomeHarvest project’ (ID 1504-006) through the ‘Investissements d’Avenir’ programme (Labex Agro:ANR-10-LABX-0001-01), the French Government’s ‘Investissements d’Avenir’ FRANCE GENOMIQUE programme (ANR-10-INBS-09) and the CGIAR Research Programme on Roots, Tubers and Bananas (RTB).
ACKNOWLEDGEMENTS
We are grateful to the CRB Plantes Tropicales Antilles CIRAD-INRA (Guadeloupe) and the Bioversity International Musa Transit Centre (ITC) for providing the plant material used in this study. The authors also thank Remy Habas, Jean-Marie Delos, Franck Marius and Jean-Claude Efile for helping with
plant management, and the South Green Platform (http://www.
southgreen.fr) for providing computational resources (Galaxy and UMR AGAP HPC Data Center).
LITERATURE CITED
Baurens F-C, Martin G, Hervouet C, et al. 2019. Recombination and
large structural variations shape interspecific edible bananas genomes.
Molecular Biology and Evolution 36: 97–111.
Belser C, Istace B, Denis E, et al. 2018. Chromosome-scale assemblies of
plant genomes using nanopore long reads and optical maps. Nature Plants
4: 879–887.
Carreel F, Fauré S, De Leon DG, et al. 1994. Evaluation de la diversité
génétique chez les bananiers diploïdes (Musa sp). Genetics Selection
Evolution 26: S125.
Camacho C, Coulouris G, Avagyan V, et al. 2009. BLAST+: architecture and
applications. BMC Bioinformatics 10: 421. doi: 10.1186/1471-2105-10-421
Christelová P, De Langhe E, Hřibová E, et al. 2017. Molecular and
cyto-logical characterization of the global Musa germplasm collection pro-vides insights into the treasure of banana diversity. Biodiversity and
Conservation 26: 801–824.
Daniells J, Jenny C, Karamura D, Tomekpe K. 2001. Musalogue: a cata-logue of Musa gemplasm. Diversity in the genus Musa. Montpellier: INIBAP.
D’Hont A, Denoeud F, Aury J-M, et al. 2012. The banana (Musa acuminata)
genome and the evolution of monocotyledonous plants. Nature 488: 213–217.
Dodds KS, Simmonds NW. 1948. Sterility and parthenocarpy in diploid
hybrids of musa. Heredity 2: 101–117.
Droc G, Larivière D, Guignon V, et al. 2013. The Banana Genome Hub. Database 2013: bat035. doi: 10.1093/database/bat035.
Fauré S, Noyer JL, Horry JP, et al. 1993. A molecular marker-based linkage
map of diploid bananas (Musa acuminata). Theoretical and Applied
Genetics 87: 517–526.
Garsmeur O, Droc G, Antonise R, et al. 2018. A mosaic monoploid
ref-erence sequence for the highly complex genome of sugarcane. Nature
Communications 9: 2638. doi: 10.1038/s41467-018-05051-5.
Herten K, Hestand MS, Vermeesch JR, Van Houdt JK. 2015. GBSX:
a toolkit for experimental design and demultiplexing genotyping by sequencing experiments. BMC Bioinformatics 16: 73. doi: 10.1186/ s12859-015-0514-3.
Hippolyte I, Bakry F, Seguin M, et al. 2010. A saturated SSR/DArT linkage
map of Musa acuminata addressing genome rearrangements among ba-nanas. BMC Plant Biology 10: 65. doi: 10.1186/1471-2229-10-65.
Jain M, Olsen HE, Paten B, Akeson M. 2016. The Oxford Nanopore
MinION: delivery of nanopore sequencing to the genomics community.
Genome Biology 17: 239. doi: 10.1186/s13059-016-1103-0
Janssens SB, Vandelook F, Langhe ED, et al. 2016. Evolutionary dynamics
and biogeography of Musaceae reveal a correlation between the diversi-fication of the banana family and the geological and climatic history of Southeast Asia. New Phytologist 210: 1453–1465.
Jáuregui B, De Vicente MC, Messeguer R, et al. 2001. A reciprocal
trans-location between ‘Garfi’ almond and ‘Nemared’ peach. Theoretical and
Applied Genetics 102: 1169–1176.
Jeridi M, Bakry F, Escoute J, et al. 2011. Homoeologous chromosome
pairing between the A and B genomes of Musa spp. revealed by genomic in situ hybridization. Annals of Botany 108: 975–981.
Jones DR. 2000. Diseases of banana, abaca and enset. Wallingford, UK:
CABI Publishing.
Koren S, Walenz BP, Berlin K, Miller JR, Bergman NH, Phillippy AM. 2017. Canu: scalable and accurate long-read assembly via adaptive k-mer
weighting and repeat separation. Genome Research 27: 722–736.
Krumsiek J, Arnold R, Rattei T. 2007. Gepard: a rapid and sensitive tool for
creating dotplots on genome scale. Bioinformatics 23: 1026–1028.
Krzywinski MI, Schein JE, Birol I, et al. 2009. Circos: an information
aes-thetic for comparative genomics. Genome Research 19: 1639–1645.
Lescot M, Piffanelli P, Ciampi AY, et al. 2008. Insights into the Musa
genome: syntenic relationships to rice and between Musa species. BMC
Genomics 9: 58. doi: 10.1186/1471-2164-9-58.
Li H. 2011. A statistical framework for SNP calling, mutation discovery,
as-sociation mapping and population genetical parameter estimation from sequencing data. Bioinformatics 27: 2987–2993.
Li H, Durbin R. 2009. Fast and accurate short read alignment with Burrows–
Wheeler transform. Bioinformatics 25: 1754–1760.
Martin M. 2011. Cutadapt removes adapter sequences from high-throughput
sequencing reads. EMBnet.journal 17: 10–12.
Martin G, Baurens F-C, Droc G, et al. 2016. Improvement of the banana ‘Musa acuminata’ reference sequence using NGS data and semi-automated bioinfor-matics methods. BMC Genomics 17: 243. doi: 10.1186/s12864-016-2579-4.
Martin G, Carreel F, Coriton O, et al. 2017. Evolution of the banana genome
(Musa acuminata) is impacted by large chromosomal translocations.
Molecular Biology and Evolution 34: 2140–2152.
Mbanjo EGN, Tchoumbougnang F, Mouelle AS, et al. 2012. Molecular
marker-based genetic linkage map of a diploid banana population (Musa
acuminata Colla). Euphytica 188: 369–386.
McKenna A, Hanna M, Banks E, et al. 2010. The Genome Analysis Toolkit:
a MapReduce framework for analyzing next-generation DNA sequencing data. Genome Research 20: 1297–1303.
Noumbissié GB, Chabannes M, Bakry F, et al. 2016. Chromosome
segre-gation in an allotetraploid banana hybrid (AAAB) suggests a transloca-tion between the A and B genomes and results in eBSV-free offsprings.
Molecular Breeding 36: 1–14.
Perrier X, Bakry F, Carreel F, et al. 2009. Combining biological approaches
to shed light on the evolution of edible bananas. Ethnobotany Research
and Applications 7: 199–216.
Perrier X, De Langhe E, Donohue M, et al. 2011. Multidisciplinary
perspec-tives on banana (Musa spp.) domestication. Proceedings of the National
Academy of Sciences, USA 108: 11311–11318.
Quénéhervé P, Valette C, Topart P, Tezenas du Montcel H, Salmon F. 2009.
Nematode resistance in bananas: screening results on some wild and culti-vated accessions of Musa spp. Euphytica 165: 123–136.
Quillet MC, Madjidian N, Griveau Y, et al. 1995. Mapping genetic factors
controlling pollen viability in an interspecific cross in Helianthus sect. Helianthus. Theoretical and Applied Genetics 91: 1195–1202.
Rouard M, Droc G, Martin G, et al. 2018. Three new genome assemblies
support a rapid radiation in Musa acuminata (wild banana). Genome
Biology and Evolution 10: 3129–3140.
Ruas M, Guignon V, Sempere G, et al. 2017. MGIS: managing banana (Musa
spp.) genetic resources information and high-throughput genotyping data.
Database 2017: doi: 10.1093/database/bax046.
Sardos J, Perrier X, Doležel J, et al. 2016. DArT whole genome profiling
provides insights on the evolution and taxonomy of edible banana (Musa spp.). Annals of Botany 118: 1269–1278.
Shepherd K. 1999. Translocations and insertions in diploid Musa acuminata.
In: Cytogenetics of the genus Musa. Montpellier: INIBAP, 15–38.
Simmonds NW. 1962. The evolution of the bananas. London: Longmans. Southgreen Collaborators. 2016. The South Green portal: a comprehensive
resource for tropical and Mediterranean crop genomics. Current Plant
Biology 7–8: 6–9.
Sović I, Šikić M, Wilm A, Fenlon SN, Chen S, Nagarajan N. 2016. Fast and
sensitive mapping of nanopore sequencing reads with GraphMap. Nature
Communications 7: 11307. doi: 10.1038/ncomms11307.
Tadmor Y, Zamir D, Ladizinsky G. 1987. Genetic mapping of an ancient
trans-location in the genus Lens. Theoretical & Applied Genetics 73: 883–892.
Vuylsteke DR, Swennen RL, Ortiz R. 1992. Development and performance
of black sigatoka-resistant tetraploid hybrids of plantain (Musa spp., AAB group). Euphytica 65: 33–42.