HAL Id: hal-02282663
https://hal.archives-ouvertes.fr/hal-02282663
Submitted on 10 Sep 2019
HAL is a multi-disciplinary open access
archive for the deposit and dissemination of
sci-entific research documents, whether they are
pub-lished or not. The documents may come from
teaching and research institutions in France or
abroad, or from public or private research centers.
L’archive ouverte pluridisciplinaire HAL, est
destinée au dépôt et à la diffusion de documents
scientifiques de niveau recherche, publiés ou non,
émanant des établissements d’enseignement et de
recherche français ou étrangers, des laboratoires
publics ou privés.
Vortex terahertz wave generation in air by femtosecond
optical vortex pulses
Maksym Ivanov, Illia Thiele, Luc Bergé, Stefan Skupin, Danas Buožius,
Virgilijus Vaičaitis, Virgilijus Vaicaitis
To cite this version:
Maksym Ivanov, Illia Thiele, Luc Bergé, Stefan Skupin, Danas Buožius, et al.. Vortex terahertz
wave generation in air by femtosecond optical vortex pulses. Terahertz Emitters, Receivers, and
Applications X, Aug 2019, San Diego, United States. pp.9, �10.1117/12.2529247�. �hal-02282663�
Vortex terahertz wave generation in air by femtosecond
optical vortex pulses
Maksym Ivanov
a, Illia Thiele
b, Luc Berg´
e
c, Stefan Skupin
d, Danas Buoˇ
zius
a, and Virgilijus
Vaiˇ
caitis
aa
Laser Research Center, Vilnius University, 10 Sauletekio avenue, Vilnius, Lithuania, LT-10223
bDepartment of Physics, Chalmers University of Technology, G¨
oteborg, Sweden, SE-412 96
c
CEA, DAM, Arpajon, France, DIF - 91297
d
Institut Lumiere Matiere, UMR 5306 Universit Lyon 1 - CNRS, Universit de Lyon,
Villeurbanne, France, F-69622
ABSTRACT
This proceeding details the experimental investigation and scheme used to generate vortex beams at THz and far-infrared frequencies. Main experimental and numrical results are presented by M. Ivanov et al.1,2 We investigate the generation of broadband terahertz (THz) pulses between 10 and 40 THz with a phase singularity from two-color femtosecond laser-induced gas-plasmas. Experimental scheme allows for independent control of the amplitude, phase, polarization, and longitudinal and transverse positions of fundamental and second harmonics. When the second harmonic beam has a vortex charge the THz beam acquires an azimuthal phase modulation as well. Moreover, it turns out that also the THz intensity becomes modulated along the azimuthal angle. The phase structure of the singular THz beam is indirectly revealed by astigmatic transformation of the beam by a cylindrical mirror and additionally confirmed by the vortex THz beam behaviour upon change of relative phase between the fundamental and the second harmonic.
Keywords: Terahertz radiation, Optical Vortex, Plasma, THz, phase singularity
1. INTRODUCTION
Terahertz (THz) radiation is of great current interest due to many applications such as nonlinear THz spec-troscopy and imaging3 or electron bunch compression.4 One of the compact and effective methods to obtain
very high THz field strengths and extremely broadband spectral widths is THz wave generation from plasma fila-ments formed in air by focused bichromatic femtosecond laser pulses consisting of first and second harmonic waves (FH, SH).5–9On the other hand, special light fields, such as optical vortex,10radially polarized,11Bessel12,13and Airy beams14are widely studied and employed in various fields.15,16 Previous attempts on vortex generation at the THz frequencies17–24were exclusively based on manipulation of THz wave by external components which are
inherently limited in terms of acceptable bandwidth. Therefore, alternative methods for ultra-broadband vortex generation at THz frequencies should be proposed and investigated. Very recently, vortex THz have been gener-ated without external shaping elements25,26in ZnTe crystal, with comparably narrowband spectrum. Therefore,
in this work we investigated a novel method of vortex THz pulse generation, already at the THz generation stage, emitted from the air-plasma induced by FH and SH. SH carrying an optical vortex charge affects not only phase but also intensity distribution of the generated THz pulse. Results of our investigation suggest an alternative method for the generation of vortex THz wave spanning ultra-broad band frequency range, which is not limited by the spectral acceptance of the external shaping elements or down-converting crystals. This method can be used for active control of the THz pulse properties, giving great flexibility for applications of THz radiation. Main experimental results with comprehensive numerical simulations are presented by M. Ivanov et al.,1,2 in this proceeding we present details of the experimental investigation and related scheme.
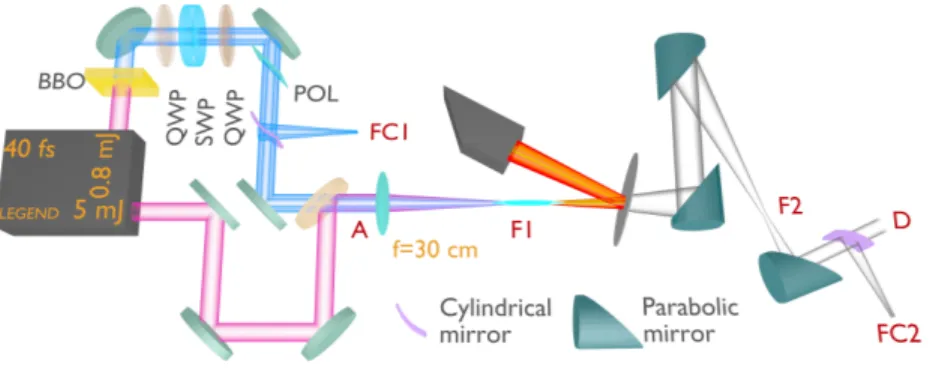
Figure 1. Sketch of experimental setup. QWP - quarter wave plate, SWP - S-waveplate (q-plate), POL - polarizer, BBO - nonlinear crystal for SH generation. Parabolic and cylindrical mirror are labled in the Figure. SH is shown by blue, FH by red-pink, THz radiation - by gray color. Red letters label positions at which experimental images are taken.
2. EXPERIMENTAL OBSERVATIONS
The experimental setup in sketched in Fig. 1. We have used a 1 kHz repetition rate laser system (Legend elite duo HE+, Coherent Inc.). Right before main focusing lens (silica, f =30 cm) labeled ‘A’ in the setup, FH had central wavelength of 790 nm, FWHM pulse duration 50 fs and energy of 6 mJ. In this position SH had central wavelength of 395 nm, FWHM pulse duration ∼50 fs and energy of 60 µJ in Gaussian state and 50 µJ in vortex state. Gaussian SH was converted to an optical vortex by a method described in,27 which ensures
more than octave spectral bandwidth of vortex generation. First SH was circularly polarized by a quarter wave plate (QWP) and converted to an optical vortex (OV) beam by an S-waveplate (RPC-405-06-557, Workshop of Photonics) (SWP). Subsequent polarization filtering by a second quarter wave plate (QWP) and a polarizer (POL) ensured generation of a linearly polarized vortex in femtosecond SH beam over all spectral bandwidth of the SH pulse. A 0.5 mm thick Si wafer along with various commercial THz filters was used to remove the high frequency part and to transmit only THz radiation, which was collimated and shrank by parabolic mirrors in a telescope configuration to match the detector aperture. Imaging of the generated THz beam was performed with a thermal camera detector (VarioCAM head HiRes 640, InfraTec GmbH), sensitive in the range 0.1 40 THz (3000 7.5 µm). Spectra of THz radiation were obtained from Fourier transformed interferometric measurements of THz radiation using pyroelectric detector (TPR-A-65 THz, Spectrum Detector Inc.), sensitive in the range 0.1 - 300 THz (3000 - 1 µm) with a flat response function from ∼3 to ∼100 THz. Typically generated THz radiation spectrum spans from 10 to 40 THz (right-bottom panel of Fig. 9). Deeps in the spectrum are associated with absorbance in the guiding elements such as Si filters and pellicle beam splitters. The efficiency of THz generation with the regular Gaussian pulses was about 10−4, but dropped to about 10−5in the case of the SH vortex pump due to the different spatial intensity distributions of the Gaussian FH and vortex SH beams.
Since our experimental scheme allows for independent control of the amplitude, phase, polarization, and longitudinal and transverse positions of FH and SH then before commencing experiments on the generation of vortex THz, we test performance of the setup versus misalignment of the above mentioned parameters. Therefore, spectrum of the generated THz radiation was tested for lateral, transverse, and temporal misalignment between FH and SH, and also versus energy of FH. Results suggests that change of power of FH, lateral and transverse misalignment between FH and SH does not affect significantly the spectral distribution of the generated THz beam, in contrast to the change of delay between FH and SH pulses, which shift frequency peak of the generated THz radiation.
Further author information: (Send correspondence to M. I.) M.I.: E-mail: [email protected], Telephone: N/A
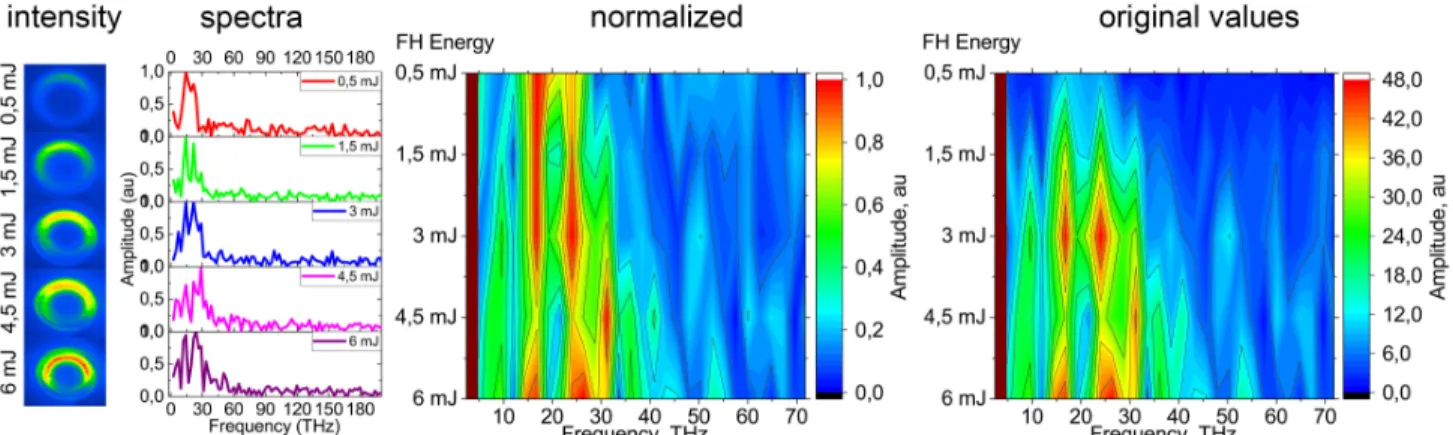
Figure 2. Experimental images and spectra of the generated THz beam versus energy of FH. Energy of SH is constant 60 µJ, time delay is 0 ps. See text for details.
Spectra of THz beam versus energy of FH is shown in Fig. 2. Energy of SH kept constant at 60 µJ. Column ‘spectra’ shows spectra of the generated THz beam at the specified energy levels of FH. Insets to the left from this column show intensity distribution of the generated THz beam at specified energy levels. Two rightmost columns additionally show spectral maps with original (non-normalized) scale (‘original values’) and normalized data (‘normalized’). These maps are automatically generated in an OriginLab software using data from the column ‘spectra’. The data points between these six experimentally measured data sets (those at 6, 4.5, 3, 1.5, and 0.5 mJ) are created automatically by the OriginLab software for smooth transition between these data sets. As is visible from from Fig. 2, increasing the energy of FH from 0.5 mJ to 6 mJ broadens the spectrum of the generated THz wave from 13.5 THz to 28.5 THz at FWHM, correspondingly, and produces higher THz yield. At any incident energy level of FH the spectrum of the generated THz wave peaks at 13 and 25 THz (Fig. 2). Additionally, from the image insets of the THz intensity distributions, one can notice slight decrease in the radius of the generated THz radiation with increase of the energy of FH.
Figure 3. Experimental images and spectra of THz beam versus time delay between FH and SH. Energy of FH is 6 mJ, SH is 60 µJ. See text for details.
Effect of the temporal delay of time of arrival of FH with respect to that of SH pulse on spectra of the generated THz beam is shown in Fig. 3. Time of arrival of FH was changed from simultaneous arrival (0 ps) to 0,2 ps in positive direction, meaning FH arrives prior to SH, and to -0.5 ps in the negative direction, meaning FH arrives after SH pulse to the interaction point. As seen from the normalized and non-normalized frequency maps (on the right in Fig.3) the maximum of the THz yield is at 0 and -0.1 ps delay. As delay changes from 0.2 ps to -0.5 ps (FH arrives prior to and after SH, correspondingly) maximum peak of the generated THz radiation shifts from higher to lower THz frequencies, namely from 36 THz at 0.2 ps, 21.5 THz at 0 ps, to 12 THz at
-0.5 ps. This dependence is attributed to the absorption and reflection of the lower frequencies by the plasma filament developed in the focal area from the focused FH pulse. Earlier arrival of FH harmonic leads to more dense/developed plasma, therefore more low frequency components are absorbed/reflected. One can notice that spectrum at -0.4 ps does not follow above described trend of the gradual frequency shift. We believe that this is due to the experimental error rather than to some physical effect.
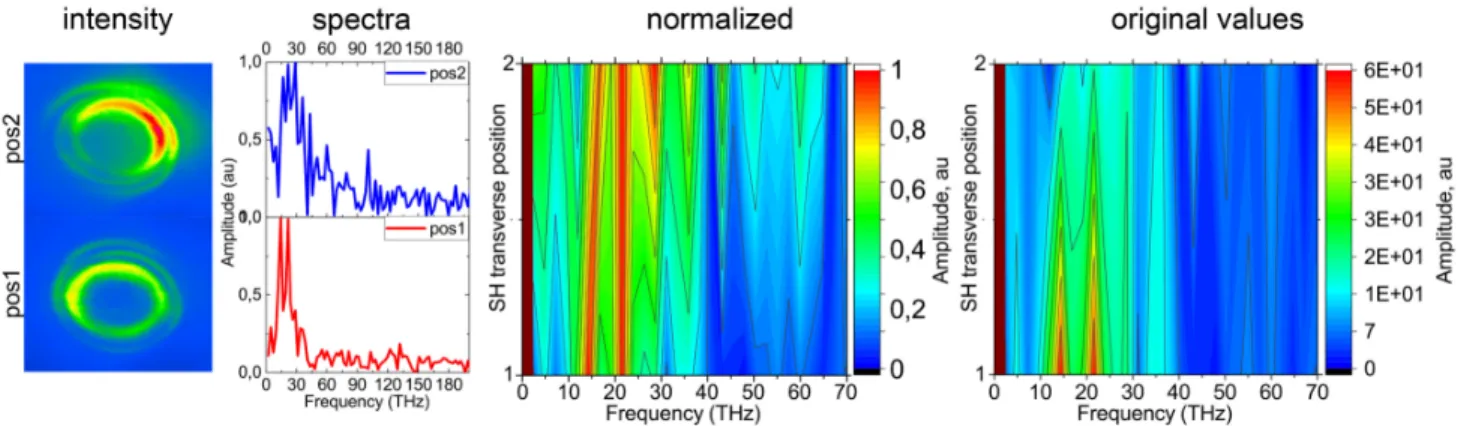
Figure 4. Experimental images and spectra of THz beam versus transverse alignment of FH and SH beams. Energy of FH is 6 mJ, SH is 60 µJ, time delay is 0 ps. See text for details.
Misalignment of superposition of FH and SH beams in the focal spot in the transverse direction is shown in Fig. 4. Transverse misalignment of FH and SH affects symmetry of conically emitted ring shaped THz intensity distribution. Image inset at the bottom (‘pos1’) correspond to a good alignment, symmetric intensity distribution of the generated THz beam, and inset at the top show asymmetric THz beam corresponding to poor transverse alignment (‘pos2’). Symmetric THz radiation has higher THz yield as seen from non-normalized frequency map (‘original values’). Spectrum of symmetric THz beam has maxima at 14.5 THz and 21.5 THz, while spectrum of asymmetric THz beam is slightly shifted towards the higher frequencies and peaks at 21.5 THz and 29 THz. To test the properties of the generated THz beam versus spatial alignment of the FH and SH pulses we have slightly modified the experimental setup. We have introduced a telescope to the path of SH to control its longitudinal position in the focus of the main lens F1 (1) by changing the spatial size of the SH beam passing through the main focusing lens. Dispersion of lenses in the telescope has prolonged duration of the SH pulse to ≈ 150 fs. Spatial focusing along propagation direction is shown inthe upper part of Fig. 5. When taking these images energies of harmonics were reduced to the level lower than the damage threshold of the CCD camera beam profiler. As seen from this figure upon focusing FH and SH beams have different divergence angles.
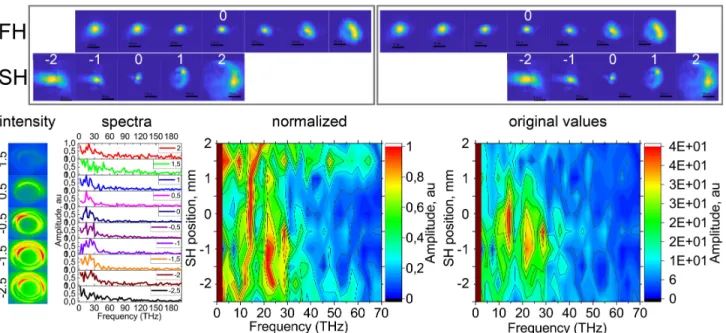
Generation of THz radiation versus the misalignment of superposition of FH and SH beams in the focal spot in the lateral direction was tested by moving the SH focal spot with respect to that of FH over the distance of 4.5 mm, with 0.5 mm step. Results are shown in Fig. 5. Image of FH labelled with 0 correspond to focal position of FH. After focusing both FH and SH develops as a conical emission with generation of a supercontinuum (images labelled 1 and 2 in the upper part of the figure). The upper part of this figure demonstrates two case of extreme alignment. First case, when focused FH overlaps with already expanding in a conical shape SH generating supercontinuum (shown on the left, FH ‘0’ correspond to SH ‘2’). Second case, when focused FH overlaps with not fully focused yet SH beam (shown on the right, FH ‘0’ correspond to SH ‘-2’). Lower part of Fig. 5 shows intensity and spectra of generated THz beam. Labelling marks position of SH with respect of ‘0’ position of FH. Spectrum labelled ‘0’ corresponds to the optimal alignment (harmonics overlap in the focus, ‘0’ of FH harmonic overlaps with ‘0’ of SH) and the highest THz yield, as clearly visible in the non-normalized rightmost spectral map. Images inserted on the left show that the intensity distribution of the generated THz beam does not change significantly with change of the lateral alignment. Measured spectra, as clearly visible from the normalized spectral map, suggests that peak of the generated THz beam does not shift significantly nor consistently, and peaks at approximately the same frequencies regardless of the longitudinal alignment.
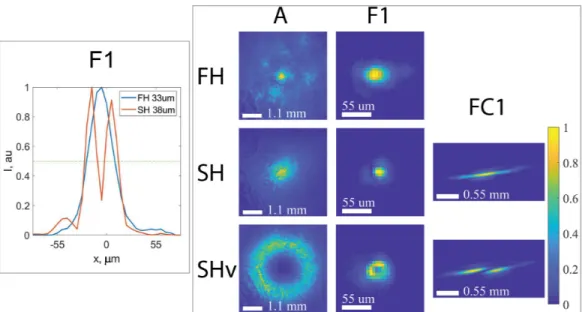
During this experiment the FH beam was always kept Gaussian. Experimental images of the SH beam are shown in Fig. 6. When taking these images energies of harmonics were reduced to the level lower than the
Figure 5. Upper part: Experimental images of the FH and SH upon focusing along propagation direction. Numbers mark positions of images with respect to the focus (0 mm) in millimeters. Lower part: Experimental images and spectra of THz beam versus lateral alignment of FH and SH focal spots. Energy of FH is 6 mJ, SH is 60 µJ, time delay is 0 ps. See text for details.
damage threshold of the CCD camera beam profiler. The first and the second row present the SH Gaussian (’SH’) and vortex beam (’SHv’), respectively. The first column ‘A’ shows images of harmonics before the main focusing lens at position A (see Fig.1); the second column ‘F1’ - in the focus of that lens (position F1 in Fig.1). The FWHM beam widths are 33 and 38 µm for the FH and the vortex SH in the focus of the main focusing lens, respectively. The third column ‘FC1’ in Fig.6 shows images of the SH beam in the focus of a cylindrical mirror, f = 200 mm (‘FC1’ in Fig.1). The top image in the ‘FC1’ column, presents a straight line profile as expected for a focused Gaussian SH beam; the bottom image shows an interrupted line corresponding to a SH vortex beam in the focus of the cylindrical mirror. The number of the dark stripes is equal to the modulus of the vortex topological charge,28 which in our case is |l
SH| = 1. The method of vortex detection by astigmatic
transformation of singular beams in the focus of cylindrical lens shows different intensity patterns for the regular and vortex beams. This method is well-developed28 and gives the same results (allows to measure topological
charge) as another well-known interferometric vortex detection method, where forked fringes are observed in intensity patter of interference. Experimental images of the generated THz beams are shown in Fig. 7. The first row labeled ‘THz’ shows intensity distributions of the conical THz beam obtained in the case of Gaussian SH, similar to those reported previously.29,30 Intensity distributions of the THz beam in the second row labeled as ‘THz vortex’ were acquired when the SH was an OV. The column labeling corresponds to locations indicated in Fig. 1. Column ‘F2’ shows the intensity distribution of the THz beam in the focus of the second parabolic mirror. As expected, the THz beam without phase singularity has a maximum intensity in the center of the beam, while intensity is minimum in the focus in case of vortex THz beam. The column ‘D’ shows the collimated THz beam. As expected, the THz beam without phase singularity has a symmetric ring intensity distribution, while the THz beam with phase singularity has an intensity modulation manifesting as two maxima along the azimuthal angle, in agreement with our theoretical predictions (1,2). The THz beam patterns obtained by the
thermal camera in fact are averaged over the full THz spectral range obtained (0.1-40 THz). Column ‘FC2’ shows the THz intensity distribution in the focal plane of the cylindrical mirror (f = 200 mm). The single bright line in the Fig. 7 ‘FC2’ first row suggests that the generated THz has no phase singularity, because this line has no dark strip (compare this image to the Fig. 6 ‘FC1’ first row, which shows that Gaussian SH focuses in a line without dark strip). In the case of vortex THz singular phase of the beam (more precisely, destructive interference between parts of opposite phase) is responsible for the appearance of the dark strip in the line of focused singular THz beam, which is clearly seen in the Fig. 7 ‘FC2’ second row (compare this image to the
Figure 6. Panel on the right: Images of fundamental (FH) and second harmonic for Gaussian (SH) and vortex (SHv) states. Column labeling correspond to locations where images were acquired as specified in Fig. 1. A is for location before focusing lens, F1 - in the focus of this lens, FC1 - in focus of cylindrical mirror. See text for details. Colorbar on the right shows normalized intensity for all subimages. Panel on the left: Spatial overlap of Gaussian FH and vortex SH at the focus of main focusing lens at position F1. Indicated beam waists are at the FWHM level.
Figure 7. Experimental images of the THz beam generated from Gaussian (first row) and vortex SH (second row) pump beams. Column labeling correspond to locations where images were acquired as specified in Fig.1. F2 correspond to the focus of parabolic mirror, D - collimated THz, FC2 - focus of cylindrical mirror. The FH beam was Gaussian in both cases. See text for details.
Fig. 6‘FC1’ second row, which shows that vortex SH focuses in a line with dark strip). One dark strip suggests that similarly to the vortex SH, topological charge of the generated vortex THz is |lT Hz| = 1. Used method of
topological charge determination based on astigmatic transformation of singular beams by cylindrical mirror28
is still valid even in the presence of intensity modulation of the generated THz.
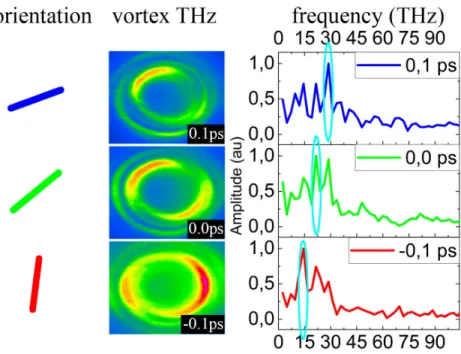
Fig. 8 shows intensity distribution of the generated vortex THz beam at different delays of FH pulse with respect to the SH pulse. First row indicates time delay in femtoseconds. Second shows intensity distribution of the generated THz radiation. Third row shows the lines drown across two minima points in the intensity modulated ring of intensity. Over delay of 240 fs (or light travelling distance of 72 µm) the intensity of THz radiation makes a turn of about 60 degrees. The change in orientation in this case is attributed to the propagation effects of vortex THz beam and to the shift of the central frequency with the change of delay as shown in the rightmost column in Fig. 8. Note, that in this case the shown spectra are obtained in the case of non-vortex
Figure 8. Orientation (schematically shown in the leftmost column) of vortex THz intensity distribution (middle column) versus time delay between FH and SH (indicated in the labels). Rightmost column shows spectrum at specified time delay for non-vortex THz (taken from Fig. 3), which picks at around 15, 20, and 30 THz for -0.1, 0, 0.1 ps time delay, correspondingly. See text for details.
THz (Fig. 3) and shown here only for the reference to highlight the change of the central wavelength with the change of time delay between FH and SH pulses.
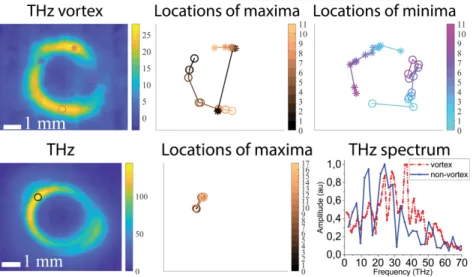
Spectra of generated THz with and without phase singularity is shown in the bottom-right panel of Fig. 9. In the case of vortex THz maximum spectral intensity is around 30 THz, while THz without phase singularity has maximum around 20 THz. This may be attributed to lower ionization rate at the periphery of ionizing FH where SH has maximum intensity and due to transverse phase variation.
Although astigmatic transformation of generated vortex THz beam by cylindrical mirror was used as a primary detection method of phase singularity. Additionally, we can look at the intensity variation of the generated THz with change of the relative phase between FH and SH. The maximum THz yield is expected for a relative phase (φ + θ) = π/2 and 3π/2 between FH and SH. Since the phase of the SH vortex beam changes by 2π over the full azimuthal angle, while the phase of the FH is constant along this angle, the intensity of the THz vortex beam has two minima and maxima. Changing the relative phase between FH and SH should result in position change (rotation) of these maxima and minima. To verify this property, the THz vortex intensity distribution was filmed by the thermal camera. The relative phase between FH and SH was not controlled but was fluctuating due to long beam pass distances (>5 meters for each harmonic), vibrations in the room/building, temperature variations, etc. Because of the random nature of the fluctuations, the THz vortex intensity distribution jitters and makes a full rotation once in a while. The typical time constant for these phase variations was of the order of 5 s, therefore we were able to register both the relatively stable THz patterns or the randomly rotating ones. The thermal camera takes 50 frames per second, corresponding to 20 milliseconds delay between subsequent frames. 12 consecutive frames (duration 240 ms) were chosen from a 1 sec long video to demonstrate the rotation of the intensity distribution due to fluctuations of the relative phase as shown in top of Figure 9. Locations of the maxima and minima were found and plotted by a home written matlab script. The top-rightmost part of the Fig. 9 shows that minima of the beam change their locations in the beam by 180 degrees during the full video sequence. The colorbar on the right indicates the number of the frame; changing from cyan for the first frame to margenta for the twelfth frame. Locations of the maxima, color-coded to change from dark to light brown, demonstrate a similar behaviour. A video sequence of the intensity distribution rotation is available via
Figure 9. Left: Intensity distribution of vortex THz beam (top, video 1: http://dx.doi.org/doi.number.goes.here) and THz without phase singularity (bottom, video 2: http://dx.doi.org/doi.number.goes.here) versus fluctuations of relative phase φ between FH and vortex or Gaussian SH. Shown is one frame from a 12-frame long video-sequence. Positions of maxima are shown by brown circle and star; positions of minima are shown by magenta circle and star. Colorbar indicates intensity in a.u. Center: Locations of maxima obtained from the video sequence on the left are shown. Colorbar indicates frame number. Right-top: Locations of minima obtained from the video sequence on the left are shown. Colorbar indicates frame number. Right-bottom: Typical spectral amplitude of the generated THz in the case of vortex SH (red dash-dot ”vortex”) and Gaussian SH (blue solid line ”non-vortex”).
the link: video 1: http://dx.doi.org/doi.number.goes.here. On contrary, the intensity distribution of the THz beam without phase singularity does not change (Figure9bottom). The fact that the THz beam has a distinct maximum is due to slight misalignment of transverse locations of the FH and SH beams. The maximum of the THz beam slightly oscillates around the same position due to (flaws in) pointing stability of the laser. The video sequence available via the link (video 2 http://dx.doi.org/doi.number.goes.here) demonstrates a breathing (in-out) character of the intensity of the THz beam. While filming THz radiation with and without phase singularity alignment of the setup was not changed. Yet, the generated THz beam, in the cases of vortex and Gaussian SH pump, shows qualitatively different behaviour consistent with the theoretical predictions.
3. CONCLUSIONS
We have investigated the properties of THz radiation generated in air plasma by a focused bichromatic fem-tosecond laser pulses with independent control of properties of fundamental and second harmonic beams. We demonstrated that the spatial (both transverse and longitudinal) misalignment of harmonics does not signifi-cantly shift spectral distribution of the generated THz pulse. The same is true for the variation of energy of fundamental harmonic. On the contrary, the spectrum of the generated THz beam shifts towards higher frequen-cies with fundamental harmonic arriving prior to second harmonic. Further, we have investigated the properties of the THz radiation generated in air plasma when one of second harmonic was an optical vortex. The presence of a phase singularity in the generated THz beam in this case was confirmed by astigmatic transformation of the singular THz beams in the focus of a cylindrical lens. However, in contrast to other nonlinear processes (second harmonic generation, parametric generation, etc.) the THz radiation generated by electron currents in a plasma filament can not be characterized as a THz vortex beam in the ‘classical’ sense, such as a Laguerre-Gaussian beam. Instead, the intensity of the THz beam is modulated along the beam azimuthal angle and contains two minima between two lobes of maximum intensity. This is because the relative phase between two harmonics spatially varies when one of the pumps is a vortex, affecting the spatial efficiency of THz generation. The change of this intensity modulation with relative phase between optical harmonics can additionally be used to show qualitative differences of the vortex THz and THz without phase singularity. One of the benefits of the
demonstrated scheme is the generation of ultra-broadband vortex (>40 THz) in contrast to the spectrally lim-ited external THz shaping. We believe that the presented investigations will open new routes towards an active control of ultra-broadband THz beam properties. For example, different combinations of topological charges of fundamental and second harmonic pulses give great flexibility for the generation of exotic singular THz pulses.
ACKNOWLEDGMENTS
This project has received funding from the European Union’s Horizon 2020 research and innovation programme under grant agreement no 654148 Laserlab-Europe. This research was funded by a grant (No. S-MIP-19-46) from the Research Council of Lithuania. MI, DB, and VV are grateful to Titas Gertus from Workshop of Photonics, Lithuania, for the S-waveplate used in this experiment as an optical vortex generator.
REFERENCES
[1] Ivanov, M., Thiele, I., Berg´e, L., Skupin, S., Buoˇzius, D., and Vaiˇcaitis, V., “Intensity modulated terahertz vortex wave generation in air plasma by two-color femtosecond laser pulses,” accepted to Opt. Lett. (2019). [2] Ivanov, M., Thiele, I., Berg´e, L., Skupin, S., Buoˇzius, D., and Vaiˇcaitis, V., “Terahertz vortex wave
genera-tion in air plasma by two-color femtosecond laser pulses,” arXiv e-prints , arXiv:1906.06243 (Jun 2019). [3] Jepsen, P. U., Cooke, D. G., and Koch, M., “Terahertz spectroscopy and imaging modern techniques and
applications,” Laser Photonics Rev 5 (1), 124–166 (2011).
[4] Kealhofer, C., Schneider, W., Ehberger, D., Ryabov, A., Krausz, F., and Baum, P., “All-optical control and metrology of electron pulses,” Science 352, 429–433 (2016).
[5] Cook, D. J. and Hochstrasser, R. M., “Intense terahertz pulses by four-wave rectification in air,” Opt. Lett. 25(16), 1210–1212 (2000).
[6] B. Clough, J. D. and Zhang, X.-C., “Laser air photonics: beyond the terahertz gap,” Mater. Today 15(1-2), 50–58 (2012).
[7] Clerici, M., Peccianti, M., Schmidt, B. E., Caspani, L., Shalaby, M., Giguere, M., Lotti, A., Couairon, A., Legare, F., Ozaki, T., Faccio, D., and Morandotti, R., “Wavelength scaling of terahertz generation by gas ionization,” Phys. Rev. Lett. 110, 253901 (2013).
[8] de Alaiza Martinez, P. G., Babushkin, I., Berge, L., Skupin, S., Cabrera-Granado, E., Kohler, C., Morgner, U., Husakou, A., and Herrmann, J., “Boosting terahertz generation in laser-field ionized gases using a sawtooth wave shape,” Phys. Rev. Lett. 114(18), 183901 (2015).
[9] Vaicaitis, V., Balachninaite, O., Morgner, U., and Babushkin, I., “Terahertz radiation generation by three-color laser pulses in air filament,” Journal of Applied Physics 125(17), 173103 (2019).
[10] Ji, W., Lee, C.-H., Chen, P., Hu, W., Ming, Y., Zhang, L., Lin, T.-H., Chigrinov, V., and Lu, Y.-Q., “Meta-q-plate for complex beam shaping,” Scientific Reports 6(25528) (2016).
[11] Stanislovaitis, P., Ivanov, M., Matijosius, A., Smilgevicius, V., and Gertus, T., “Generation of radially polarized beams and higher order polarization singularities by optical parametric amplification of optical vortices,” Optical Engineering 56(9), 095101 (2017).
[12] Durnin, J., “Exact solutions for nondiffracting beams. i. the scalar theory,” J. Opt. Soc. Am. A 4(4), 651–654 (1987).
[13] Vaicaitis, V. and Paulikas, S., “Formation of bessel beams with continuously variable cone angle,” Optical and Quantum Electronics 35(11), 1065–1071 (2003).
[14] Siviloglou, G. and Christodoulides, D., “Accelerating finite energy airy beams,” Opt. Lett. 32(8), 979–981 (2007).
[15] Hell, S. W. and Wichmann, J., “Breaking the diffraction resolution limit by stimulated emission: stimulated-emission-depletion fluorescence microscopy,” Opt. Lett. 19(11), 780–782 (1994).
[16] Ivanov, M. and Hanstorp, D., “Controlled spin of a nonbirefringent droplet trapped in an optical vortex beam,” Optics Communications 427, 152 – 157 (2018).
[17] He, J., Wang, X., Hu, D., Ye, J., Feng, S., Kan, Q., and Zhang, Y., “Generation and evolution of the terahertz vortex beam,” Opt. Express 21(17), 20230–20239 (2013).
[18] Imai, R., Kanda, N., Higuchi, T., Konishi, K., and Kuwata-Gonokami, M., “Generation of broadband terahertz vortex beams,” Opt. Lett. 39(13), 3714–3717 (2014).
[19] Miyamoto, K., Kang, B. J., Kim, W. T., Sasaki, Y., Niinomi, H., Suizu, K., Rotermund, F., and Omatsu, T., “Highly intense monocycle terahertz vortex generation by utilizing a tsurupica spiral phase plate,” Scientific Reports 6, 38880 (2016).
[20] Ge, S., Chen, P., Shen, Z., Sun, W., Wang, X., Hu, W., Zhang, Y., and Lu, Y., “Terahertz vortex beam generator based on a photopatterned large birefringence liquid crystal,” Opt. Express 25(11), 12349–12356 (2017).
[21] Ge, S.-J., Shen, Z.-X., Chen, P., Liang, X., Wang, X.-K., Hu, W., Zhang, Y., and Lu, Y.-Q., “Generat-ing, separating and polarizing terahertz vortex beams via liquid crystals with gradient-rotation directors,” Crystals 10(7), 314 (2017).
[22] Minasyan, A., Trovato, C., Degert, J., Freysz, E., Brasselet, E., and Abraham, E., “Geometric phase shaping of terahertz vortex beams,” Opt. Lett. 42(1), 41–44 (2017).
[23] Liu, C., Liu, J., Niu, L., Wei, X., Wang, K., and Yang, Z., “Terahertz circular airy vortex beams,” Scientific Reports 7, 3891 (2017).
[24] Wu, Z., Wang, X., Sun, W., Feng, S., Han, P., Ye, J., Yu, Y., and Zhang, Y., “Vectorial diffraction properties of thz vortex bessel beams,” Opt. Express 26(2), 1506–1520 (2018).
[25] Lin, Q., Zheng, S., Song, Q., Zeng, X., Cai, Y., Li, Y., Chen, Z., Zha, L., Pan, X., and Xu, S., “Generation of terahertz vortex pulses without any need of manipulation in the terahertz region,” Opt. Lett. 44(4), 887–890 (2019).
[26] Dhaybi, A. A., Degert, J., Brasselet, E., Abraham, E., and Freysz, E., “Generation of terahertz vortex pulses without any need of manipulation in the terahertz region,” J. Opt. Soc. Am. B 36(1), 12–18 (2019). [27] Gecevicius, M., Ivanov, M., Beresna, M., Matijosius, A., Tamuliene, V., Gertus, T., Cerkauskaite, A., Redeckas, K., Vengris, M., Smilgevicius, V., and Kazansky, P. G., “Toward the generation of broadband optical vortices: extending the spectral range of a q-plate by polarization-selective filtering,” J. Opt. Soc. Am. B 35, 190–196 (2018).
[28] Denisenko, V., Shvedov, V., Desyatnikov, A. S., Neshev, D. N., Krolikowski, W., Volyar, A., Soskin, M., and Kivshar, Y. S., “Determination of topological charges of polychromatic optical vortices,” Opt. Express 17, 23374–23379 (2009).
[29] Klarskov, P., Strikwerda, A. C., Iwaszczuk, K., and Jepsen, P. U., “Experimental three-dimensional beam profiling and modeling of a terahertz beam generated from a two-color air plasma,” New Journal of Physics 15(7), 075012 (2013).
[30] Vaicaitis, V., Ivanov, M., Adomavicius, K., Svirskas, Z., Morgner, U., and Babushkin, I., “Influence of laser-preformed plasma on thz wave generation in air by bichromatic laser pulses,” Laser Physics 28(9), 095402 (2018).