HAL Id: insu-02490233
https://hal-insu.archives-ouvertes.fr/insu-02490233
Submitted on 26 Mar 2021
HAL is a multi-disciplinary open access
archive for the deposit and dissemination of
sci-entific research documents, whether they are
pub-lished or not. The documents may come from
teaching and research institutions in France or
abroad, or from public or private research centers.
L’archive ouverte pluridisciplinaire HAL, est
destinée au dépôt et à la diffusion de documents
scientifiques de niveau recherche, publiés ou non,
émanant des établissements d’enseignement et de
recherche français ou étrangers, des laboratoires
publics ou privés.
Jan Deca, D.J. Hemingway, A. Divin, C. Lue, A.R. Poppe, I. Garrick-bethell,
Bertrand Lembège, M. Horányi
To cite this version:
Jan Deca, D.J. Hemingway, A. Divin, C. Lue, A.R. Poppe, et al.. Simulating the Reiner Gamma
Swirl: The Long-term Effect of Solar Wind Standoff. Journal of Geophysical Research. Planets,
Wiley-Blackwell, 2020, 125 (5), pp.e2019JE006219. �10.1029/2019JE006219�. �insu-02490233�
Simulating the Reiner Gamma Swirl: The Long-Term
Effect of Solar Wind Standoff
J. Deca1,2,3 , D. J. Hemingway4 , A. Divin5 , C. Lue6 , A. R. Poppe7 ,
I. Garrick-Bethell8,9 , B. Lembège3 , and M. Horányi1,2,10
1Laboratory for Atmospheric and Space Physics (LASP), University of Colorado Boulder, Boulder, CO, USA,2Institute for Modeling Plasma, Atmospheres and Cosmic Dust, NASA/SSERVI, Moffett Field, CA, USA,3Laboratoire
Atmosphères, Milieux, Observations Spatiales (LATMOS), Université de Versailles à Saint Quentin, Guyancourt, France,4Department of Terrestrial Magnetism, Carnegie Institution for Science, Washington, DC, USA,5Physics Department, St. Petersburg State University, St. Petersburg, Russia,6Swedish Institute of Space Physics, Kiruna, Sweden,7Space Sciences Laboratory, University of California at Berkeley, Berkeley, CA, USA,8Earth and Planetary Sciences, University of California, Santa Cruz, CA, USA,9School of Space Research, Kyung Hee University, Seoul, South Korea,10Department of Physics, University of Colorado Boulder, Boulder, CO, USA
Abstract
The Reiner Gamma swirl is a prime location to investigate the lunar albedo patterns and their colocation with magnetic anomalies. The precise relationship between impinging plasma and the swirl, and, in particular, how these interactions vary over the course of a lunar day, remains an open issue. Here we use a fully kinetic particle-in-cell code, coupled with a magnetic field model based onorbital-altitude observations, and simulate the interaction with the Reiner Gamma anomaly for all plasma regimes the region is exposed to along a typical orbit, including different solar wind incidence angles and the Moon's crossing through the terrestrial magnetosphere. Consistent with the hypothesis that swirls form as a result of plasma interactions with near-surface magnetic fields, we show that the energy flux profile produces a pattern similar to Reiner Gamma's alternating bright and darkly colored bands, but only when integrating over the full lunar orbit. We additionally show that including He2+as a self-consistent
plasma species improves the match.
Plain Language Summary
The Moon is dotted with visually distinctive brightness variations, called “lunar swirls.” Measurements have shown that all swirls are colocated with some of the tiny magnetic fields that are present on the surface. One of the most famous regions, in this respect, is the Reiner Gamma swirl. Simulating the plasma environment surrounding Reiner Gamma, using also the observed magnetic fields from two recent spacecraft missions to the Moon, we find that the flux of energy to the surface is consistent with the optical brightness pattern when the proton and helium components of the solar wind are both included. Detailing how certain areas of the lunar surface are shielded better than others from impinging plasma could help us understand better how space weathering processes alter the optical properties of exposed surfaces over time. The morphology of swirls may be telling us about the fine-scale near-surface magnetic field structure, thus helping to constrain the origins of the underlying crustal magnetic sources and how they relate to the early thermal and magnetic history of the Moon. In addition, understanding the plasma environment near Reiner Gamma is imperative, as it is one of the prime targets for future low-orbiting spacecraft or even lunar landers.1. Introduction
The Moon is dotted with visually distinctive, high-albedo surface features, called “lunar swirls”(Blewett et al., 2011; El-Baz, 1972; Hood & Schubert, 1980; Hood & Williams, 1989; Kramer et al., 2011; Schultz & Srnka, 1980). Measurement campaigns have shown that all known swirls are colocated with lunar mag-netic anomalies (LMAs). The opposite, however, does not hold (Blewett et al., 2011; Denevi et al., 2016), and the evolutionary scenario of these enigmatic features has been debated since the Apollo era (Pieters & Noble, 2016).
The three possible lunar swirl formation mechanisms that have received the most attention in the liter-ature are as follows: (1) Recent cometary and micrometeoroid impacts might have left behind remnant
RESEARCH ARTICLE
10.1029/2019JE006219
Key Points:
• Solar wind standoff can explain the correlation between the Reiner Gamma swirl and the colocated magnetic anomaly
• The outer bright lobes emerge in the simulated weathering pattern only when integrating over the entire lunar orbit
• Both the proton and helium energy flux to the surface need to be taken into account to best reproduce the swirl pattern Correspondence to: J. Deca, jandeca@gmail.com Citation: Deca, J., Hemingway, D. J., Divin, A., Lue, C., Poppe, A. R., Garrick-Bethell, I., et al. (2020). Simulating the Reiner Gamma swirl: The long-term effect of solar wind standoff. Journal of Geophysical
Research: Planets, 125, e2019JE006219. https://doi.org/10.1029/2019JE006219
Received 26 SEP 2019 Accepted 3 FEB 2020
Accepted article online 21 FEB 2020
©2020. American Geophysical Union. All Rights Reserved.
magnetization and fine-grained, unweathered material that locally brightens the surface (Pinet et al., 2000; Schultz & Srnka, 1980; Starukhina & Shkuratov, 2004; Syal & Schultz, 2015); (2) high-albedo dust may be lofted and then electrostatically sorted (Garrick-Bethell et al., 2011; Hendrix et al., 2016) or magnetically sorted (Pieters et al., 2014) on the lunar surface, or the uppermost soil grains may be structured differently at swirls, due to the unique electromagnetic and plasma environment, thereby producing unique spectral properties (Pieters et al., 2014); (3) the presence of LMAs causes the solar wind to “standoff,” locally altering the weathering patterns by solar wind ions and the subsequent darkening of the regolith by the formation of nanophase iron (np-Fe0) (Blewett et al., 2010, 2011; Deca et al., 2018; Glotch et al., 2015; Hemingway &
Garrick-Bethell, 2012; Hemingway et al., 2015; Hood & Schubert, 1980; Hendrix et al., 2016; Kramer et al., 2011, 2011; Pieters & Noble, 2016). Note, however, that one mechanism does not necessarily exclude the other. For example, the increased amount of charged particle flux a regolith surface receives might be a nec-essary precursor and controlling factor that determines the rate of surface weathering by micrometeoriod impacts (Blewett et al., 2011; Glotch et al., 2015).
Although they so far appear to be unique to the Moon, swirls have potentially broad implications for both space weathering and planetary magnetism. If the solar wind standoff model is correct, swirls can help to distinguish between the optical effects of exposure to solar wind versus micrometeoroids (which are not affected by the presence of magnetic fields), thereby helping us to understand how space weathering pro-cesses alter the optical properties of exposed surfaces over time (Hemingway et al., 2015; Pieters & Noble, 2016; Sim et al., 2017). Furthermore, the morphology of the swirls may be telling us about the fine-scale near-surface magnetic field structure, thus helping to constrain the origins of the underlying crustal mag-netic sources and how they relate to the early thermal and magmag-netic history of the Moon (Hemingway & Tikoo, 2018). For both of these applications, a key component of the explanation relates to the way the crustal fields affect the access of the solar wind plasma to the surface, which is the focus of this study.
Possibly the most well-known swirl formation is Reiner Gamma, a tadpole-shaped albedo marking with an overall length of about 70 km, located west of the crater Reiner on the Oceanus Procellarum (7.5◦N, 59.0◦ W; see figure 1 of Lee et al., 2019). The tadpole's head is characterized by an inner bright lobe and two outer bright lobes, set apart by two narrow dark lanes (see figures 1a and 1b of Poppe et al., 2016). Reiner Gamma's magnetic topology produces a minimagnetosphere (Deca et al., 2018) in which the dark lanes correspond to the areas where the crustal magnetic field is primarily oriented vertically with respect to the surface and the bright lobes are colocated with a more horizontal topology (Hemingway & Garrick-Bethell, 2012; Poppe et al., 2016). Deca et al. (2018) have shown that the geometry and magnitude of the magnetization have a key role in generating the charge-separation (Hall) electric field that regulates the charged particle fluxes to the surface. Assuming that the energy flux the surface receives is inversely proportional to the surface brightness (Poppe et al., 2016), the fully kinetic model by Deca et al. (2018) reinforces the formation of the Reiner Gamma swirl accommodated by solar wind standoff. Note that there need not be a one-to-one correlation between the amount of energy the surface receives and the optical albedo. The exact relationship might depend on additional factors (beyond the scope of this work), such as the surface topology and the ion energy threshold needed to form np-Fe0in the regolith grains.
Here we extend the initial results by Deca et al. (2018). The study revealed that the magnetic morphol-ogy, that is, the structure and magnitude of the surface field, could be one reason why not every magnetic anomaly forms a distinct albedo marking (another explanation might be that swirls can only form where magnetic sources are shallow; Hemingway & Tikoo, 2018). The study also found qualitative correlations with the simulation results in both optical remote observations of the lunar albedo and in situ measurements of reflected solar wind. However, the outer bright lobes of the swirl pattern were not well resolved, and the brightness of the inner bright lobes was overestimated. One explanation to these discrepancies could be that Deca et al. (2018) focused solely on a scenario where the Reiner Gamma region is exposed to a quiet solar wind impinging on the lunar regolith parallel to the surface normal, while the real lunar albedo pattern would have formed over time and over a wide range of plasma conditions in the lunar orbit.
In order to more accurately estimate the long-term surface effects of the plasma interaction with the LMA that is colocated with the Reiner Gamma swirl, we integrate the energy flux profiles over the entire lunar orbit, including the solar wind, magnetosheath, tail lobe, and plasma sheet crossings. The Reiner Gamma region may be a prime area of interest for one of the next lander and/or low-orbiting missions to the Moon
Journal of Geophysical Research: Planets
10.1029/2019JE006219
Table 1
Overview of the Plasma Parameters Used in the Different Simulation Cases
n (cm−3) T (eV) |v 𝑓low| 𝛼 𝛿 Panels Case (e−, p+, He2+) (e−, p+, He2+) (km/s) (◦) (%) in Figure 2 SW - A 75 a, b, c SW - B 60 d, e, f SW - C (3.15, 3, 0.15) (13, 3.5, 3.5) 350 45 93.5 g, h, i SW - D 30 j, k, l SW - E 15 m, n, o SW - F 0 p, q, r MS - G (10.5, 10, 0.5) (50, 100, 100) 150 55 5 s, t, u TL - / 0.05 (50, 50, 50) 50 1.5 / PS - / 0.5 (500, 1,000, 1,000) 100 <0.01 /
Note. See also table 18.1 in Harada and Halekas (2016).𝛼is the incidence angle of the flow with respect to the surface normal.𝛿presents an estimate of the amount of energy flux Reiner Gamma receives based on the density, the magnitude of the flow velocity, plasma temperature, and incidence angle. SW, MS, TL, and PS indicate the solar wind, magnetosheath, tail lobe, and plasma sheet, respectively. Note that the TL and PS cases have not been modeled. Slash (/) means that the simulation cases TL and TS have not been run.
(Blewett et al., 2019; Garrick-Bethell et al., 2019; Stubbs et al., 2018), making a detailed understanding of the near-surface plasma environment and its response to varying upstream plasma conditions paramount.
2. Methods
We simulate the solar wind interaction with the Reiner Gamma magnetic anomaly using the 3-D fully kinetic, electromagnetic particle-in-cell code ipic3d (Markidis et al., 2010). The code implements the implicit moment method (Brackbill & Forslund, 1982; Lapenta et al., 2006; Mason, 1981) on a Cartesian mesh and a set of open boundary conditions that allows a flowing Maxwellian plasma to be injected at the upstream and side boundaries of the computational domain (Divin et al., 2007; Deca et al., 2015). ipic3d is optimized to work well for a wide variety of plasma conditions and self-consistently resolves the dynamics of all simulated ion and electron species (e.g., Deca et al., 2015, 2017). In contrast to explicit particle-in-cell codes, the numerical algorithm allows us to overstep the Debye scales when investigating non-Debye-scale physical processes.
The Reiner Gamma magnetic topology is constructed using a Surface Vector Mapping (SVM) model based on all available magnetic field measurements from the Kaguya and Lunar Prospector missions (Deca et al., 2018; Tsunakawa et al., 2014). Although the 3-D spherical harmonic model is corrected for the solar wind pressure and interplanetary magnetic field influences (Tsunakawa et al., 2015), it remains an extrapolation from magnetic field measurements at observed altitudes (ranging between 20 and 32 km in altitude above the Reiner Gamma region) to the lunar surface. Hence, the SVM model does not capture the finest structures in the near-surface field and therefore provides only a lower bound on the magnitude and an upper bound on the spatial scale of those features (Halekas et al., 2010; Hemingway & Tikoo, 2018). Specifically for the Reiner Gamma LMA, it was found that the magnetic topology spatially overestimates the size of the observed colocated albedo patterns (Deca et al., 2018). In this study we have therefore artificially reduced the spatial scale of the magnetic model 2.5 times to match the size of the observed albedo patterns. We do not scale the magnetic field magnitude, assuming that only the spatial scale mismatch is an artifact of the SVM model. The magnetic field anchor points of the main dipolar-like magnetic structure have been lined up with the observed dark lanes. The lunar surface itself is approximated by a sphere with a radius of 1,737.1 km that absorbs all computational particles that pass its boundary. The details on the implementation are available in the methods section of Deca et al. (2018) and references therein. All simulations reported in this work implement a domain size of 200 × 650 × 650 km3with a resolution of 1.35 × 1.35 × 1.35 km3. We include
three plasma species: electrons, protons, and alpha particles using 64 computational particles per cell per species, each weighted by the respective density of the species (Table 1). The time step is 1.75 × 10⁻⁵s.
Figure 1. The location of the Reiner Gamma region on the lunar surface
(indicated with a dark blue dot) during the various phases of the Moon's orbit around the Earth. The simulated cases are indicated in green. Segments of the lunar orbit when no or an insignificant amount of particle flux reaches the region are indicated in red and orange, respectively. The magnetopause and bow shock positions are taken from Shue et al. (1997) and Fairfield (1971).
As the Moon is tidally locked to Earth, no single patch of regolith is continuously exposed to the solar wind plasma. Due to the westerly selenographic location of Reiner Gamma on the lunar surface, pristine solar wind would impinge on the region from waxing gibbous to waning crescent, were it not for the terrestrial magnetosphere that intersects the lunar orbit up to waning gibbous (Figure 1). The Moon spends roughly 4.93 days of its 27.3-day orbit in the magnetosheath and a similar com-bined 4.47 days in the magnetotail and tail lobes (Poppe et al., 2018). From Apollo 14 surface plasma measurements, the probability to encounter the magnetotail plasma sheet is estimated to range between 10% and 70%, varying with geomagnetic activity (Rich et al., 1973).
In order to obtain an integrated surface flux profile for the Reiner Gamma region that is representative for one “typical” lunar orbit/day, we divide the Moon's trajectory around Earth in different segments. For each seg-ment we simulate the plasma interaction with the SVM model using a fixed plasma incidence angle, flow velocities, and temperatures that are representative for the respective local plasma environment (Table 1). The location of Reiner Gamma on the lunar surface is such that for only one fourth of the orbit (six 15◦segments), the region is exposed to pristine solar wind plasma (Figure 1). Note that numerical stability constraints prevented us from simulating a steady-state environment where the solar wind plasma arrives precisely parallel to the surface. This case, however, can be safely ignored, as it would contribute little to the integrated pro-file and not affect the general conclusions of this work. In addition, only while traveling through the dawnside magnetosheath (YGSE > 0), a
sig-nificant amount of plasma can reach the region. During all other phases of the lunar orbit, Reiner Gamma receives either no (indicated in red on Figure 1) or an insignificant amount of energy flux (indicated in orange on Figure 1). The𝛿 parameter in Table 1 estimates the theoretical maxi-mum amount of energy flux that each region of the orbit may receive, using the upstream density, the flow or thermal velocity (plasma temperature), and the incidence angle of the plasma flow. In order to simplify the simulation setup, we also neglect both the interplanetary and the magnetosphere magnetic field com-ponents. In other words, we only keep the contribution from the SVM model. The resulting energy fluxes to the surface of all simulated cases are then added together and weighted according to the fraction of the orbit spent in each segment. Note that Deca et al. (2015) show that the interplanetary magnetic field has a relatively small effect on the weathering patterns. In contrast, they also show that the solar wind speed could significantly affect the shielding efficiency of an LMA (although the effect is less pronounced as com-pared to a change of the incidence angle of the impinging plasma). Even more, in reality also the solar wind density, temperature, and alpha-to-proton ratio can vary significantly. We chose to work here only with aver-age plasma conditions in order to keep the number of needed simulations within reason, hence making the assumption that the extreme events that could cause a significantly different flux profile as presented here are rare and are assumed to have a minimal effect on the long-term albedo variations.
3. Results
Figure 2 presents maps of the simulated energy flux to the surface for the seven cases defined in Table 1 and shows the proton, helium, and combined flux (p++ He2+), respectively. All maps are normalized either
to the upstream solar wind proton energy flux (the p+ and He2+ maps) or the combined energy flux
(the combined p++ He2+maps). The energy flux maps are constructed using the particle data recorded
less than 1.35 km above the spherical lunar surface after the simulation has reached steady state (Deca et al., 2018). To reduce the particle-in-cell noise for the quasi-steady state configuration, we averaged the results using the output from six individual time steps, each a thousand computational cycles apart and well exceeding the period of any observed instabilities.
Focusing on the first six rows of Figure 2, that is, the cases where the Reiner Gamma region is exposed to the pristine solar wind at decreasing incidence angles, it is clear that a smaller𝛼 corresponds to a greater energy
Journal of Geophysical Research: Planets
10.1029/2019JE006219
Figure 2. Maps of the energy flux to the lunar surface for the seven runs outlined in Table 1. The left, middle, and right
columns show the proton (p+), helium (He2+), and combined energy flux (p++ He2+), respectively. The maps are
normalized to the upstream solar wind proton energy flux (left and middle columns) and the combined energy flux (right column). The He2+fluxes have been exaggerated five times. The position of the Moon from top to bottom are
Figure 3. Comparison of the relative darkening (inverse relative brightness) of Reiner Gamma with the simulated
energy flux to the surface, integrated over one lunar orbit. (a) Inverse of the LRO-WAC empirically normalized reflectance image (Boyd et al., 2012; Robinson et al., 2010). A smaller number indicates a brighter surface. The brightness values are normalized to the mare background averaged over the illustrated region. Equivalently, a larger value indicates more darkening assuming an initially bright surface prior to weathering. (b–d) Integrated, combined, normalized energy flux profile to the surface combining p+and He2+, p+, and He2+, respectively. The normalization is
identical to Figure 2. The He2+fluxes have been enlarged five times. The black boxes indicate the part of the domain
used to construct Figure 4.
flux to the lunar regolith. At𝛼 = 75◦(first row, case A in Table 1), the surface receives four times less energy than at normal incidence (sixth row, Case F). Independent of the incidence angle, the areas not shielded from the impinging plasma (i.e., the dark lanes) consistently appear at the same location, that is, at the magnetic field anchor points. The local wake-like structure that appears downstream of the southern-most dark lanes becomes systematically shorter and less pronounced with decreasing incidence angles. This trend is con-sistent for the proton, helium, and the combined flux profiles. He2+ions have only half the charge-to-mass
ratio of the incident protons, resulting in a more narrow weathering pattern. The electric field that forms when the impinging plasma encounters the magnetic structure is less efficient to deflect alpha particles. As a result, compared to the proton profiles, the inner bright lobe is less shielded from He2+, and the tail
northeast (Y > 0 ∧ Z > 0) of the tadpole's head is less prominent.
The seventh row of Figure 2 depicts the situation in between the bow shock and magnetopause (Case G). Although the plasma in this region of the magnetosphere is hotter and denser, the slower flow velocity reduces the incident energy flux to the Reiner Gamma region by a factor of 5 compared with the normal incidence upstream of the bow shock. Nevertheless, the large-scale features of the energy flux pattern are still present. The “mini-wake” structure observed at a similar incidence angle in the solar wind, however, is absent. In addition, the electric field formed above the magnetic structure is 50% weaker in magnitude as compared to a solar wind case with similar incidence angle (figure not shown). The latter is consistent
Journal of Geophysical Research: Planets
10.1029/2019JE006219
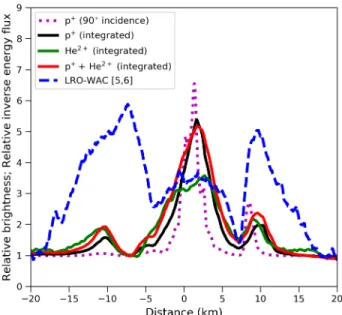
Figure 4. Comparison of the LRO-WAC empirically normalized reflectance
(blue dashed line), the inverse of the proton energy flux (magenta dotted line; Deca et al., 2018), and the integrated profiles of the proton (black), He2+(green), and combined (red) inverse energy flux computed from the boxes indicated on Figure 3 (see text for details).
with the analysis of Run F in Deca et al. (2015), which discusses the solar wind interaction with a horizontal dipolar magnetic topology for low-velocity plasma flow.
We characterize the observed brightness variations of the Reiner Gamma albedo pattern using the empirically normalized reflectance image from the Lunar Reconnaissance Orbiter Wide Angle Camera (LRO-WAC; Boyd et al., 2012; Robinson et al., 2010). Figure 3 shows the inverse of the relative brightness or, equivalently, the relative darkening, next to the integrated surface energy flux maps compiled from the simulations. The integrated results are obtained by averaging the 2-D profiles from Runs A–G in Figure 2, weighting the respective quantities of each run by the segment of the lunar orbit they represent (see also the final paragraph of section 2). The relative darkening is normalized to the mare background and the maximum brightness in the illustrated 200 km × 200 km region. A smaller value indicates a brighter area; a larger value indicates more darkening assuming the surface was initially bright. At first glance, there are only minimal differences between Case F (Figures 2q–2r) and the orbit-integrated results. This is not entirely unexpected, as the largest con-tribution to the total flux arrives along the surface normal. Comparing Figures 2a and 2d, the He2+ profile matches better the observed ratios
between the dark lanes and the bright lobes (the inner bright lobe in par-ticular). This is consistent with the results of a𝜒2estimate (pixel-by-pixel
correlation) that uses the inverse relative brightness as the expected value and the simulation results as the observed data. In addition, we assume three free parameters to compute the minimum𝜒2values: a translation in Y and Z and the scaling factor
that is originally set to 2.5 by hand. No significant deviations from the initial values set for the free param-eters (0 km, 0 km, 2.5) are identified by the𝜒2minimization algorithm. The relative𝜒2values for the p+
(90◦incidence), p+(Figure 2c), He2+(Figure 2d), and combined integrated profile (Figure 2b) are 2.84, 1.51,
1.00, and 1.32, respectively. We elaborate further in the discussion of Figure 4. The plasma interaction with the magnetic field topology overestimates the plasma shielding in Reiner Gamma's tail region, perhaps sug-gesting that the surface fields in the tail region have been relatively overestimated in the Tsunakawa et al. (2015) model. Given the resolution of the latter magnetic field model, the fact that the weaker magnetic signature is present in the model could be seen as an accomplishment of the SVM technique. Most likely, only in situ measurements of the field structure at altitudes below current-day nominal spacecraft orbits or observations at the surface will allow a better agreement between the models and the swirl patterns in very weakly magnetized areas (Blewett et al., 2019; Garrick-Bethell et al., 2019; Stubbs et al., 2018).
To further quantify the results drawn from the 2-D maps, in Figure 4 we construct a profile across the head of the Reiner Gamma swirl (cf. Poppe et al., 2016), averaging the respective variables along the width of the black box that is overlaying the four panels of Figure 3. For reference, the inverse of the proton flux profile obtain by Deca et al. (2018) for a solar wind impinging normal to the simulated lunar surface is included here as well. Note that we do not assume a one-to-one correlation between the surface energy flux and the relative darkening but rather expect the two quantities to reveal similar trends if indeed solar wind stand-off is the mechanism responsible for the surface brightness variations. Keeping the initial normalization adopted in Figure 3, we have subsequently multiplied the simulated inverse energy flux profiles such that their average values at the location of the inner bright lobe line up with the latter's relative brightness. Com-paring with the result from Deca et al. (2018), it is clear that integrating over a full lunar day is required to shield the surface from the impinging plasma at the location of the southern (Z< 0) outer bright lobe. The simulated width and brightness of the outer bright lobes, however, are still not well characterized by the integrated results from the simulation. In reality, the outer lobes are almost twice as bright as the inner lobe, but the integrated proton simulation shows lobes that are less than a third the brightness of the inner lobe. The He2+profile offers a closer match to the ratios between the dark lanes and the inner and outer
bright lobes with respect to the background brightness away from the swirl region. In other words, the char-acteristics of the He2+energy flux profile are more similar to the in situ LRO-WAC counterpart. Although
regolith, it may be an important component that shapes the weathering profile. Alternatively, the magnetic field model is sufficiently uncertain that it is not possible to separate the effects of including He2+versus
the sculpting of the bulk plasma flow by near-surface fields. For example, two competing models of the magnetic source body geometries have been published, each with different near-surface fields and each con-sistent with orbital-altitude observations (Garrick-Bethell & Kelley, 2019; Hemingway & Garrick-Bethell, 2012). Apart from these limitations of the magnetic field model, we speculate that to activate the forma-tion of np-Fe0in the regolith grains, a certain threshold energy needs to be exceeded. The amount of energy
deposited at the location of the inner bright lobe is smaller than at the outer bright lobes, but the average energy per computational particle that penetrates the central density halo and reaches the surface is greater.
4. Conclusions
Using the fully kinetic particle-in-cell code, iPIC3D (Markidis et al., 2010), coupled with a downward-continued model of the near-surface magnetic field structure (Tsunakawa et al., 2015), we have shown that the major albedo features of the Reiner Gamma swirl—namely, its alternating bright lobes and dark lanes—can be explained in terms of the integrated energy flux at the lunar surface (Figures 3 and 4). The sim-ulated weathering pattern consists of broad lobes, where the energy flux to the surface is weak, interrupted by narrow lanes, where the surface energy flux is at a maximum. We have shown that the best-matching energy flux and albedo patterns emerge only when integrating over all solar wind incidence angles and plasma environments that contribute to the total energy flux reaching the location of the swirl. Additionally, we showed that He2+might be a key factor required to obtain a one-to-one correlation between the observed
albedo patterns and the plasma weathering pattern generated by the standoff of the impinging solar wind (Figure 4). An unexplained observation is that the energy flux at the outer bright lobes predicted by the model is only<50% of the brightness of the inner lobe, when in reality, LRO-WAC albedo data show that the outer bright lobes are almost twice as bright as the outer lobes. The mismatch may arise in part from the fact that the Tsunakawa et al. (2015) surface field model may be missing some of the finest structures in the true near-surface magnetic fields.
Although the details of solar wind-induced physical and chemical alteration of lunar soil are beyond the scope of this work, we note that no part of the lunar surface is completely shielded from the impinging plasma. This suggests either that partially shielded lunar surfaces may require long time periods before becoming saturated and fully darkened or that some additional processes, such as regolith gardening by small impacts, work to counteract the darkening effects such that the steady-state optical properties rep-resent some balance between these processes (Hemingway et al., 2015; McFadden et al., 2019), with the balance depending on the integrated solar wind energy flux.
Our simulations establish a clear link between the Reiner Gamma albedo pattern and the way the impinging plasma is affected by the near-surface magnetic fields. Our results thus support the solar wind standoff hypothesis for the formation of swirls (Hood & Schubert, 1980) and suggest that the albedo patterns may be used to inform models of the finely structured near-surface magnetic fields where swirls are present (Hemingway & Tikoo, 2018). Finally, an improved understanding of the plasma environment at the Reiner Gamma swirl is particularly valuable, as this is likely to be a prime target for future low-orbiting spacecraft or even landers (e.g., Blewett et al., 2019; Garrick-Bethell et al., 2019; Stubbs et al., 2018).
References
Blewett, D. T., Coman, E. I., Hawke, B. R., Gillis-Davis, J. J., Purucker, M. E., & Hughes, C. G. (2011). Lunar swirls: Examining crustal magnetic anomalies and space weathering trends. Journal of Geophysical Research, 116, E02002. https://doi.org/10.1029/2010JE003656 Blewett, D. T., Denevi, B. W., Robinson, M. S., Ernst, C. M., Purucker, M. E., & Solomon, S. C. (2010). The apparent lack of lunar-like swirls on Mercury: Implications for the formation of lunar swirls and for the agent of space weathering. Icarus, 209, 239–246. https://doi.org/ 10.1016/j.icarus.2010.03.008
Blewett, D. T., Halekas, J., Greenhagen, B. T., Anderson, B. J., Denevi, B. W., Hurley, D. M., & Wieczorek, M. (2019). Magnetic anomaly as natural laboratory: The Lunar Compass Mission concept. Lunar and Planetary Science Conference, 50, 1450.
Boyd, A. K., Robinson, M. S., & Sato, H. (2012). Lunar Reconnaissance Orbiter wide angle camera photometry: An empirical solution.
Lunar and Planetary Science Conference, 43, 2795.
Brackbill, J. U., & Forslund, D. W. (1982). An implicit method for electromagnetic plasma simulation in two dimensions. Journal of
Computational Physics, 46(2), 271–308. https://doi.org/10.1016/0021-9991(82)90016-X
Deca, J., Divin, A., Henri, P., Eriksson, A., Markidis, S., Olshevsky, V., & Horányi, M. (2017). Electron and ion dynamics of the solar wind interaction with a weakly outgassing comet. Physical Review Letters, 118(20), 205101. https://doi.org/10.1103/PhysRevLett.118.205101
Acknowledgments
J. D. and M. H. gratefully acknowledge support from NASA's Lunar Data Analysis Program, Grant
80NSSC17K0420. A. D. was supported by RFBR Grant 19-02-00993. This work was supported in part by NASA's Solar System Exploration Research Virtual Institute (SSERVI): Institute for Modeling Plasmas, Atmosphere, and Cosmic Dust (IMPACT), Grant NNA14AB06A. Resources supporting this work were provided by the NASA High-End Computing (HEC) Program through the NASA Advanced Supercomputing (NAS) Division at Ames Research Center and by TGCC and CINES under the DARI Project A0050400295. I. G.-B. acknowledges support from the BK21 plus program of the National Research Foundation (NRF) funded by the Ministry of Education of the Republic of Korea.Part of this work was inspired by discussions within International Team 437: “Negative Ions in the Solar System” at the International Space Science Institute, Bern, Switzerland. J. D. thanks H. J. Lim for her suggestions, which helped improving the manuscript. All data necessary to validate the findings presented in this manuscript can be found at https:// doi.org/10.5281/zenodo.3631616 in accordance with the FAIR data project.
Journal of Geophysical Research: Planets
10.1029/2019JE006219
Deca, J., Divin, A., Lembège, B., Horányi, M., Markidis, S., & Lapenta, G. (2015). General mechanism and dynamics of the solar wind interaction with lunar magnetic anomalies from 3-D PIC simulations. Journal of Geophysical Research: Space Physics, 120, 6443–6463. https://doi.org/10.1002/2015JA021070
Deca, J., Divin, A., Lue, C., Ahmadi, T., & Horányi, M. (2018). Reiner Gamma albedo features reproduced by modeling solar wind standoff.
Nature Communications Physics, 1, 12. https://doi.org/10.1038/s42005-018-0012-9
Denevi, B. W., Robinson, M. S., Boyd, A. K., Blewett, D. T., & Klima, R. L. (2016). The distribution and extent of lunar swirls. Icarus, 273, 53–67. https://doi.org/10.1016/j.icarus.2016.01.017
Divin, A. V., Sitnov, M. I., Swisdak, M., & Drake, J. F. (2007). Reconnection onset in the magnetotail: Particle simulations with open boundary conditions. Geophysical Research Letters, 34, L09109. https://doi.org/10.1029/2007GL029292
El-Baz, F. (1972). The Alhazen to Abul Wafa swirl belt: An extensive field of light-colored sinuous markings. NASA Special Publication,
315, 2993.
Fairfield, D. H. (1971). Average and unusual locations of the Earth's magnetopause and bow shock. Journal of Geophysical Research, 76(28), 6700. https://doi.org/10.1029/JA076i028p06700
Garrick-Bethell, I., Head, J. W., & Pieters, C. M. (2011). Spectral properties, magnetic fields, and dust transport at lunar swirls. Icarus, 212, 480–492. https://doi.org/10.1016/j.icarus.2010.11.036
Garrick-Bethell, I., & Kelley, M. R. (2019). Reiner Gamma: A magnetized elliptical disk on the Moon. Geophysical Research Letters, 46, 5065–5074. https://doi.org/10.1029/2019GL082427
Garrick-Bethell, I., Paige, D. A., & Burton, M. E. (2019). NanoSWARM: A proposed discovery mission to study space weathering, lunar water, lunar magnetism, and small-scale magnetospheres. Lunar and Planetary Science Conference, 50, 2786.
Glotch, T. D., Bandfield, J. L., Lucey, P. G., Hayne, P. O., Greenhagen, B. T., Arnold, J. A., & Paige, D. A. (2015). Formation of lunar swirls by magnetic field standoff of the solar wind. Nature Communications, 6, 6189. https://doi.org/10.1038/ncomms7189
Halekas, J. S., Lillis, R. J., Lin, R. P., Manga, M., Purucker, M. E., & Carley, R. A. (2010). How strong are lunar crustal magnetic fields at the surface?: Considerations from a reexamination of the electron reflectometry technique. Journal of Geophysical Research, 115, E03006. https://doi.org/10.1029/2009JE003516
Harada, Y., & Halekas, J. S. (2016). Upstream waves and particles at the Moon. Geophysical Monograph Series, 216, 307–322. https://doi. org/10.1002/9781119055006.ch18
Hemingway, D. J., & Garrick-Bethell, I. (2012). Magnetic field direction and lunar swirl morphology: Insights from Airy and Reiner Gamma.
Journal of Geophysical Research, 117, E10012. https://doi.org/10.1029/2012JE004165
Hemingway, D. J., Garrick-Bethell, I., & Kreslavsky, M. A. (2015). Latitudinal variation in spectral properties of the lunar maria and implications for space weathering. Icarus, 261, 66–79. https://doi.org/10.1016/j.icarus.2015.08.004
Hemingway, D. J., & Tikoo, S. M. (2018). Lunar swirl morphology constrains the geometry, magnetization, and origins of lunar magnetic anomalies. Journal of Geophysical Research: Planets, 123, 2223–2241. https://doi.org/10.1029/2018je005604
Hendrix, A., Greathouse, T., Retherford, K., Mandt, K., Gladstone, G., & Kaufmann, D. (2016). Lunar swirls: Far-UV characteristics. Icarus,
273, 68–74. https://doi.org/10.1016/j.icarus.2016.01.003
Hood, L. L., & Schubert, G. (1980). Lunar magnetic anomalies and surface optical properties. Science, 208, 49–51. https://doi.org/10.1126/ science.208.4439.49
Hood, L. L., & Williams, C. R. (1989). The lunar swirls—Distribution and possible origins. In G. Ryder, & V. L. Sharpton (Eds.), Lunar and
Planetary Science Conference Proceedings(Vol. 19, pp. 99–113). Cambridge: Cambridge University.
Kramer, G. Y., Besse, S., Dhingra, D., Nettles, J., Klima, R., Garrick-Bethell, I., & McCord, T. B. (2011). M3spectral analysis of lunar swirls and the link between optical maturation and surface hydroxyl formation at magnetic anomalies. Journal of Geophysical Research, 116, E00G18. https://doi.org/10.1029/2010JE003729
Kramer, G. Y., Combe, J. P., Harnett, E. M., Hawke, B. R., Noble, S. K., Blewett, D. T., & Giguere, T. A. (2011). Characterization of lunar swirls at Mare Ingenii: A model for space weathering at magnetic anomalies. Journal of Geophysical Research, 116, E04008. https://doi. org/10.1029/2010JE003669
Lapenta, G., Brackbill, J. U., & Ricci, P. (2006). Kinetic approach to microscopic-macroscopic coupling in space and laboratory plasmas.
Physics of Plasmas, 13(5), 055904. https://doi.org/10.1063/1.2173623
Lee, J. K., Maxwell, R., Jin, H., Baek, S. M., Ghassemi, O., Kelley, M., & Garrick-Bethell, I. (2019). A small lunar swirl and its implications for the formation of the Reiner Gamma magnetic anomaly. Icarus, 319, 869–884. https://doi.org/10.1016/j.icarus.2018.09.015 Markidis, S., Lapenta, G., & Rizwan-uddin. (2010). Multi-scale simulations of plasma with iPIC3D. Mathematics and Computers in
Simulation, 80(7), 1509–1519. https://doi.org/DOI:10.1016/j.matcom.2009.08.038
Mason, R. J. (1981). Implicit moment particle simulation of plasmas. Journal of Computational Physics, 41, 233–244. https://doi.org/10. 1016/0021-9991(81)90094-2
McFadden, J., Garrick-Bethell, I., Sim, C. K., Kim, S. S., & Hemingway, D. (2019). Iron content determines how space weathering flux variations affect lunar soils. Icarus, 333, 323–342. https://doi.org/10.1016/j.icarus.2019.05.033
Pieters, C. M., Garrick-Bethell, I., & Hemingway, D. (2014). Magnetic sorting of the regolith on the Moon: Lunar swirls. AGU Fall Meeting Abstracts vol. 2014, pp. P11D-10.
Pieters, C. M., Moriarty, D. P., & Garrick-Bethell, I. (2014). Atypical regolith processes hold the key to enigmatic lunar swirls. Lunar and Planetary Science Conference p. 1408.
Pieters, C. M., & Noble, S. K. (2016). Space weathering on airless bodies. Journal of Geophysical Research: Planets, 121, 1865–1884. https;// doi.org/10.1002/2016JE005128
Pinet, P. C., Shevchenko, V. V., Chevrel, S. D., Daydou, Y., & Rosemberg, C. (2000). Local and regional lunar regolith characteristics at Reiner Gamma formation: Optical and spectroscopic properties from Clementine and Earth-based data. Journal of Geophysical Research,
105, 9457–9476. https://doi.org/10.1029/1999JE001086
Poppe, A. R., Farrell, W. M., & Halekas, J. S. (2018). Formation timescales of amorphous rims on lunar grains derived from ARTEMIS observations. Journal of Geophysical Research: Planets, 123, 37–46. https://doi.org/10.1002/2017JE005426
Poppe, A. R., Fatemi, S., Garrick-Bethell, I., Hemingway, D., & Holmström, M. (2016). Solar wind interaction with the Reiner Gamma crustal magnetic anomaly: Connecting source magnetization to surface weathering. Icarus, 266, 261–266. https://doi.org/10.1016/j. icarus.2015.11.005
Rich, F. J., Reasoner, D. L., & Burke, W. J. (1973). Plasma sheet at lunar distance: Characteristics and interactions with the lunar surface.
Journal of Geophysical Research, 78, 8097–8112. https://doi.org/10.1029/JA078i034p08097
Robinson, M. S., Brylow, S. M., Tschimmel, M., Humm, D., Lawrence, S. J., Thomas, P. C., & Hiesinger, H. (2010). Lunar Reconnaissance Orbiter Camera (LROC) instrument overview. Space Science Reviews, 150, 81–124. https://doi.org/10.1007/s11214-010-9634-2 Schultz, P. H., & Srnka, L. J. (1980). Cometary collisions on the Moon and Mercury. Nature, 284, 22–26. https://doi.org/10.1038/284022a0
Shue, J. H., Chao, J. K., Fu, H. C., Russell, C. T., Song, P., Khurana, K. K., & Singer, H. J. (1997). A new functional form to study the solar wind control of the magnetopause size and shape. Journal of Geophysical Research, 102, 9497–9512. https://doi.org/10.1029/97JA00196 Sim, C. K., Kim, S. S., Lucey, P. G., Garrick-Bethell, I., & Choi, Y. J. (2017). Asymmetric space weathering on lunar crater walls. Geophysical
Research Letters, 44, 11,273–11,281. https://doi.org/10.1002/2017GL075338
Starukhina, L. V., & Shkuratov, Y. G. (2004). Swirls on the Moon and Mercury: Meteoroid swarm encounters as a formation mechanism.
Icarus, 167, 136–147. https://doi.org/10.1016/j.icarus.2003.08.022
Stubbs, T. J., Malphrus, B. K., Hoyt, R., Mesarch, M. A., Tsay, M., Chai, D. J., & Purucker, M. E. (2018). Bi-Sat Observations of the Lunar Atmosphere Above Swirls (BOLAS): Tethered SmallSat investigation of hydration and space weathering processes at the Moon. Lunar
and Planetary Science Conference, 49, 2394.
Syal, M. B., & Schultz, P. H. (2015). Cometary impact effects at the Moon: Implications for lunar swirl formation. Icarus, 257, 194–206. https://doi.org/10.1016/j.icarus.2015.05.005
Tsunakawa, H., Takahashi, F., Shimizu, H., Shibuya, H., & Matsushima, M. (2014). Regional mapping of the lunar magnetic anomalies at the surface: Method and its application to strong and weak magnetic anomaly regions. Icarus, 228, 35–53. https://doi.org/10.1016/j. icarus.2013.09.026
Tsunakawa, H., Takahashi, F., Shimizu, H., Shibuya, H., & Matsushima, M. (2015). Surface vector mapping of magnetic anomalies over the Moon using Kaguya and Lunar Prospector observations. Journal of Geophysical Research: Planets, 120, 1160–1185. https://doi.org/ 10.1002/2014JE004785