HAL Id: hal-02094038
https://hal.archives-ouvertes.fr/hal-02094038
Submitted on 9 Apr 2019HAL is a multi-disciplinary open access archive for the deposit and dissemination of sci-entific research documents, whether they are pub-lished or not. The documents may come from teaching and research institutions in France or abroad, or from public or private research centers.
L’archive ouverte pluridisciplinaire HAL, est destinée au dépôt et à la diffusion de documents scientifiques de niveau recherche, publiés ou non, émanant des établissements d’enseignement et de recherche français ou étrangers, des laboratoires publics ou privés.
3D polyelectrolyte scaffolds to mimic exocrine glands: a
step towards a prostate-on-chip platform
Nathalie Picollet-D’hahan, Axel Tollance, Cristina Belda Marin, Lavinia
Liguori, Christophe Marquette, Odile Filhol-Cochet, Isabelle Vilgrain,
Guillaume Laffitte, Florence Rivera, Jean-Pierre Alcaraz, et al.
To cite this version:
Nathalie Picollet-D’hahan, Axel Tollance, Cristina Belda Marin, Lavinia Liguori, Christophe Mar-quette, et al.. 3D polyelectrolyte scaffolds to mimic exocrine glands: a step towards a prostate-on-chip platform. The EuroBiotech Journal, Sciendo, 2018, 2 (4), pp.180-195. �10.2478/ebtj-2018-0048�. �hal-02094038�
RESEARCH ARTICLE
The EuroBiotech Journal
Medicine and Biotechnology
Abstract
We report our approach to creating a microfluidic chip (namely UroLOC) that mimics the acinar/tubular structure and the luminal microenvironment of exocrine glands. The chip utilises a nanostructured membrane that is designed to provide a 3-di-mensional supporting scaffold for the growth of exocrine acinus epithelial cells. The nanostructured membrane was produced using layer-by-layer assembly of polyelectrolytes, and formed into 3-dimensional hemispherical cavities and “finger-like” structures in order to mimic the natural architecture of acini found in exocrine glands. We utilised normal (PNT2) and can-cerous (PC3, LNCaP) prostate epithelial cells to demonstrate the proof-of-concept of using MALDI (Matrix Assisted Laser Desorption Ionisation) profiling of secretions collected after 48 hours of cell growth, with no concentration or purification steps and without any a priori on the knowledge of targeted proteins. This MALDI profiling analysis of the crude supernatants from 3 different cell lines (PNT2, PC3 and LNCaP) demonstrated the capacity of the MALDI profiling approach to discrim-inate between the different secretome signatures. The UroLOC concept and secretome profiling that we describe opens new opportunities in terms of liquid-biopsy based diagnosis, particularly for the early stages of carcinogenesis.
Keywords: liquid biopsy, organ-on-chip, polyelectrolytes; 3D scaffolds; secretome
Introduction
Monolayer (in 2D) cultures have been very useful models for gene discovery and early work on viral transformation, but such 2D systems do not provide a cell-model that rep-licates the architecture of exocrine gland tissues (1). Cell models that replicate exocrine gland architecture are important tools in the search for drugs to combat disease and can-cer. For example, cancer of breast tissue is a significant cancer amongst women. Vidi et al 2013 describe methods for the growth of breast epithelial cells into physiologically rele-vant 3D cell culture, which demonstrate the important roles that cell polarity, cell shape and the development of proper basement membranes play in the physiology of exocrine tissues in the breast. Such physiologically relevant 3D cell culture models of breast tissue are important tools in the search for therapeutic agents to fight disease and cancer of the breast tissue. For men’s health, the exocrine prostate gland tissue is a significant cause for cancer and other disease. Prostate epithelial cells grown in micro-spheroid cultures in a Microwell-mesh 3D culture system responded appropriately to drugs used to treat pros-tate cancer (2) The use of organoids, as 3D culture models would provide even closer tis-sue-like conditions for studying drug reaction (3). Those types of 3D cell-culture systems provide information of cell responses that are measurable by imaging or spectroscopic techniques. The limitation of those 3D epithelial models for acinar structures is that it is not possible to access the luminal secretions to measure physiological responses in real-time and to identify new cancer biomarkers.
1Université Grenoble Alpes, INSERM
(UM-R_S 1038), CEA, BIG-BGE, F-38054 Greno-ble, France
2University Grenoble Alpes, SyNaBi,
TIMC-IMAG/CNRS/INSERM, UMR 5525, F-38000, Grenoble, France
3Université Lyon 1, CNRS (UMR 5246),
ICBMS, F-69622 Villeurbanne, France
4Université Grenoble Alpes, INSERM
(UM-R_S 1036), CNRS, BIG-BCI Biology of Cancer and Infection, F-38054 Grenoble, France
5Université Grenoble Alpes, CEA, LETI,
DTBS, F-38054 Grenoble, France
6Université Grenoble Alpes, CEA, LETI,
CLINATEC, F-38000 Grenoble, France *Corresponding authors:
N. Picollet-D’hahan (Nathalie.picollet-dhahan@cea.fr) and D.K. Martin (don. martin@univ-grenoble-alpes.fr) DOI: 10.2478/ebtj-2018-0048
© 2018 Authors. This work was licensed under the Creative Commons Attribution-NonCommercial-NoDerivs 3.0 License.
3D polyelectrolyte scaffolds to mimic exocrine glands: a step towards
a prostate-on-chip platform
Nathalie Picollet-D’hahan
1*, Axel Tollance
1, Cristina Belda Marin
2, Lavinia Liguori
2,
Christophe Marquette
3, Odile Filhol-Cochet
4, Isabelle Vilgrain
4, Guillaume Laffitte
5, Florence Rivera
5,
Jean-Pierre Alcaraz
2, Jacques Thélu
2, Olivier Nicoud
2, Thibaud Moufle-Milot
2, Maxime Legues
1,
Ali Bouamrani
6, Adrien Mombrun
6, Benoit Gilquin
6, Sophie Gerbaud
1, Patricia Obeid
1,
The use of microfabricated systems, or indeed novel poly-mer-based cell scaffolds that are coupled to microfluidics, would provide the next step toward exocrine organ-on-chip cultures that could provide real-time physiological cell re-sponses (4). The choice of epithelial cells can assist the step to-ward such capability of measuring real-time physiological re-sponses. For example, intestinal CaCo-2 epithelial cells have been cultured in a Gut-on-Chip device that included a mi-crofluidics system to access both sides of the intestinal mono-layer, which provided measurements of metabolic responses from the intestinal cells that were closer to that expected in a natural biological tissues (5, 6). That Gut-on-Chip device comprises a porous PDMS membrane to provide a permeable membrane to allow cell secretions to be collected in the mi-crofluidic system. Nonetheless, PDMS membranes may have intrinsic transport, mechanical and structural properties that are different from those of the natural basement membrane of the tissue. Other materials were used to mimic finger-like villi topography such as biodegradable polymers (such as po-ly-lactic-glycolic acid and poly-lactic-acid) (7), collagen (see references in (8)). While intestine-on-chip devices (9) remain to date the closest models for finger-like acinar and tubular structure, no exocrine-gland-on a chip devices composed of hollow protuberances allowing co-cultures and direct sam-pling of secretions have been developed.
In this paper we describe our approach to creating a micro-fluidic chip (namely UroLOC) that mimics the acinar/tubu-lar structure and the luminal microenvironment of exocrine glands. The chip utilises a nanostructured membrane that is designed to provide a 3-dimensional supporting scaffold for the growth of exocrine acinus epithelial cells. This scaffold is a porous biomaterial membrane that comprises multiple 3-di-mensional and hollow protuberances on which adherent cells are grown on either side, with the acinar epithelial cells on the inside (luminal side) and stromal cells on the outside (glan-dular side). The acinar epithelial cells on the inside of the 3D protuberances produce small volumes of secretions, which are collected (by possibly using microfluidics) for analysis of the composition of the secreted fluid. These secretions consist of all the molecules that can be secreted in the cell culture medium such as peptides, proteins, amino acids, miRNAs, DNA, RNA. The analysis profile of these secretions makes it possible to obtain the secretome, that is to say the qualitative and quantitative profile of the secretory components.
Materials and Methods
Nanostructured membrane to support cell growth
The membrane was formed using a layer-by-layer process that utilised the polyelectrolytes poly-sodium 4-styrenesulphonate (PSS) and poly-allylamine hydrochloride (PAH) (10). The op-timisation of this membrane for the UroLOC device proceeded using 2 protocols. The first protocol constructed the membrane inside 3D hemispherical cavities, with the purpose to grow the exocrine epithelial cells on these 3D hemispherical membranes and to optimize the analytical method for the small volumes
of secretions from each 3D hemispherical cavity. The second protocol was to construct the membrane on a 3D acinar-mimic sacrificial mould so as to create a free-standing porous mem-brane, with the purpose to mimic the biological acinar archi-tecture with epithelial cells on the inside of the membrane (lu-minal side) and stromal cells on the outside (basal side).
(a) First Protocol - Mould design, fabrication and optimisation The 3D hemispherical cavities were produced from a master mould. Fig. 1 illustrates the steps required for the assembly of the master mould. An inket printer was used to spot resin drops of about 1 nl onto a resin substrate so as to create an array of 200 resin hemispheres of 100 μm diameter. This proce-dure was optimized to avoid the viscous resistance of the resin in the injector. Once the master mould was assembled, it was replicated by slowly pouring liquid PDMS onto it (Two-part Sylgard silicon 10:1 v/v) at RT and allowing the PDMS to po-lymerize overnight at 60°C (Fig. 1.A). From that master mould, a derived mould was formed for the routine production of the 3D hemispherical cavities. The derived mould consisted of 200 PDMS hemispherical multi-wells (100 μm x 50 μm) formed across a chip with a surface area of 2 cm2. Characterisation of
the surface and the hemispheres of the PDMS device was per-formed by scanning electron microscopy (SEM) (Fig. 1.B) and by Z stack and 3D reconstruction on a confocal microscopy (LSM 710 confocal scanning laser microscope (Carl Zeiss, Jena, Germany) (Fig. 1.D). The Z-stack acquisition was carried out using a C-apochromat water-immersion objective (magnifica-tion 63x, NA 1.2, Carl Zeiss).
The derived mould was used to form 3D hemispherical cavities in a PDMS chip. Multi-layered polyelectrolyte films were assembled inside these 3D hemispherical cavities by al-ternate coating of PSS (poly (sodium 4-styrenesulphonate; Sigma 243051)) and PAH (poly (allylamine hydrochloride; Sigma 283223)) following the LbL (Layer-by-Layer) process we have previously described (10, 11) (see also Fig. SI.1). The 3D hemispherical cavities were coated with 16 polyelectrolyte (PE) layers in order to obtain a membrane of around 32 nm in thickness that was easily visualised with fluorescein (Fig.
1.C). For that visualization, the PDMS chip containing the 3D
hemispherical cavities was incubated for 2 hours at RT in a solution of Fluorescein (10 μM in PBS) and washed twice in PBS before observation. Fluorescein was excited at 488 nm and fluorescence was observed using a 510–560 nm filter. 13 suc-cessive optical slices were captured along the cell z-axis, with a step of about 3.5 μm. For 3D reconstruction, PE-Fluorescein was scanned with about 50 slices. Images were processed using the ZEN software. A color code was established to indicate the depth of the well.
(b) First Protocol - Immunocytochemistry and 3D confocal analysis
RWPE1 and WPE1-int lines were used to validate the structur-al and functionstructur-al phenotype of prostatic cells grown on the PE films inside the 3D hemispherical cavities. The RWPE1 (ATCC
Ref. CRL11609) cell-line was derived from non-neoplastic hu-man prostate epithelial cells via immortalization with huhu-man papillomavirus. They were used as model for normal prostate epithelial cell behaviour, as characterised by a well-established polarised morphology (12) and clear cell-cell junctions when grown on a flat or curve surface (13). The WPE1-int cells (ATCC ref CRL2888) were derived from the RWPE-1 cell-line after two consecutive cycles of single cell cloning and were used as luminal prostatic cells that have the property to secrete Pros-tate Specific Antigen (PSA) while conserving a normal epithe-lial morphology.
Cells were cultured on the PE films inside the 3D hemi-spherical cavities from 5 to 8 day days after seeding. Vincu-lin was chosen to visualize the cell focal adhesions on the PE films inside the 3D hemispherical cavities. Cells were perme-abilized for 40 seconds with Triton X-100 and fixed with 4% (v/v) PFA in PBS for 20 minutes and washed once with PBS. To block nonspecific antibody binding, cells were incubated with 0.1 BSA and 10% goat serum for 1 hour. Primary antibody against vinculin (Sigma Aldrich) was used at 1:700 dilution (in PBS+Tween 20 0.05%, and 5% goat serum) and incubated 1 hour at RT followed by 4 PBS washes (45 minutes in total). Cultures were then incubated with anti-mouse Cy5 (Jackson,
dilution 1/500 in PBS+, Tween 20 0.05%, and 5% goat serum). The cells were subsequently washed 4 times for 15 minutes with PBS. Nuclei were stained with SYBR green (2μg/ml in PBS). Confocal acquisition was achieved by exciting with 2 lasers, 488 (SYBR green) and 543 (Cyanine 5), which allowed for 3D reconstruction of 50 optical slices (1 µm step) which were ac-quired in the Z-axis from the top of the mould (flat region, red) to the bottom of the 3D cavity (blue).
(c) First Protocol - Measurement of the volume of secretions
The volume of secretions from cells grown on the PE-scaffold inside the hemispherical cavities was estimated as followed (Fig. SI.2). A volume of 50 μl of bromophenol blue solution was deposited with Tween 80 (1/1000) on a PDMS mould (Fig.
SI.2.A.1). The excess of bromophenol blue was absorbed with
paper towels and discarded so as to leave all the cavities filled with bromophenol blue (Fig. SI.2.A.2). The bromophenol blue in the cavities was then transferred to Whatman paper (Fig.
SI.2.A.3). The Whatman filter paper was placed in an
Eppen-dorf tube (0.5 mL) previously pierced with a needle and then placed in a second Eppendorf tube (1.5 mL). Hydration of Whatman paper was performed with 350 μl H20 + Tween 80 (1/1000). Then all the contents of the Whatman paper were
Figure 1. Mould design and fabrication. A. The Master mould was obtained by dropping a biocompatible resin on a rigid resin
support. The PDMS final mould is composed by 200 hemi-spherical structures of ~ 100 μm on the base and ~ 50 um in heights. The pitch between the hemispherical wells is ~ 400 μm. B. Scanning electron microscopy (SEM) of the surface and the hemispheres.
C. Confocal microscopy (orthogonal section) of the hemisphere coated with multi PE (15 layers alternating PSS-PAH) incubated
with fluorescein. The fluorescein labels PE allowing the thin layer visualization. D. Confocal scanning laser microscopy of the hemi-spheres.
A.
B.
C.
D.
Master
PDMS
PDMS
eluted by centrifugation at 13400 rpm for 60 s (Fig. SI.2.A,
4-6). Adding Tween 80 to the bromophenol blue optimized the
coating inside the PE film-lined cavities and hence increased the transfer efficiency to the absorbant Whatman paper (Fig.
SI.2.B). The volume of bromophenol blue that was transferred
to the Whatman paper was quantified on the basis of a colori-metric standard curve that we had previously established using known volumes.
(d) First Protocol - Methodology for the collection of cell secretions PDMS moulds were placed in 9 well plates for cell culture. The cells were seeded over the PDMS mould at high concentration (diluted by one-third from T25 cm2) and culture medium
with-out FCS was placed over the PDMS mould to form a large con-vex meniscus. 24h later the meniscus had decreased so that the culture medium was filling only the hemispherical cavities pres-ent on the moulds. Cells were then stimulated with dihydrotes-tosterone (DHT, 100 nM) for 24 hours inside the incubator in order to stimulate PSA secretion. Particular attention was paid to only adding DHT to the hemispherical cavities of the PDMS moulds and not across the entire surface of each mould. For each condition, the medium from 3 moulds was pooled into 1 sample for ELISPOT-based analysis, in each of the 4 following conditions: WPE1-int – DHT, WPE1-int +DHT, RPTEC and 3ng of pure PSA. Volumes of secretions collected from moulds were spotted on a 1.5 cm2 nitrocellulose membrane. Each spot
corresponds to 10 µl of supernatant and all dilutions have been made with milli-Q water. ELISPOT analysis was performed as described in section 4.
(e) Second Protocol - Development of 3D self-supporting PE membrane scaffolds
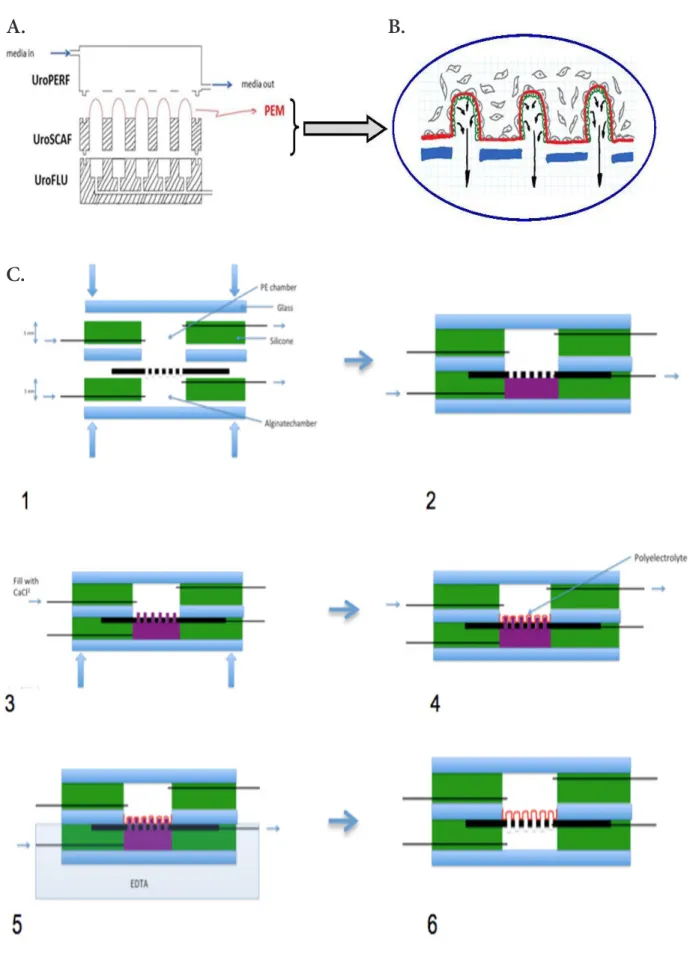
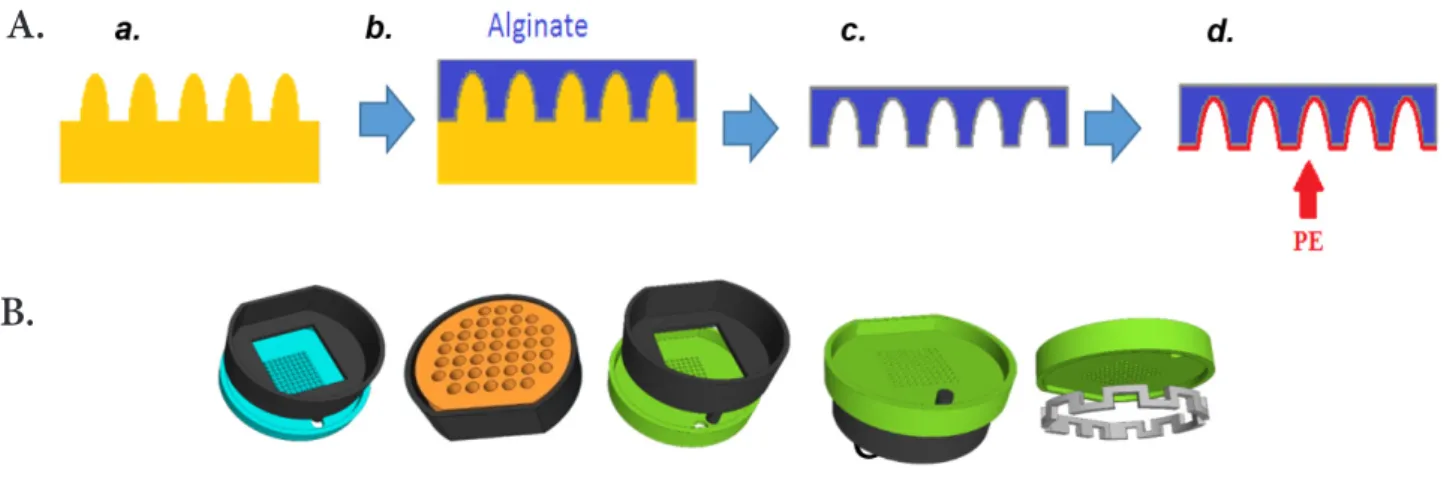
The concept was based on the modular assembly of 3D print-ed pieces that providprint-ed a system to shape the self-supporting “acinar-like” PE scaffolds. The methodology relied on using alginate as a sacrificial core for PE coating from a shape of ei-ther alginate “finger-like” structures (Fig. 2, first approach) or alginate “wells” (Fig. 3, second approach). In both cases, 3D printed pieces were manufactured by 3D Fab platform (Vil-leurbanne, France) using an Objet Pro 3D printer. The material used was acrylate resin, also known as plexiglass, (generally transparent to allow microscopy) which was UV photo cured after each layer had been deposited.
For the first approach (Fig. 2), the detail of the individual 3D pieces are illustrated in Fig. SI.3. To create the “finger-like” structure that provided the sacrificial core for the PE mem-brane, alginate (1.5 %) was flowed through the different UroS-CAF pieces. Three different pieces were assembled and clamped together to form the UroLOC device, with PDMS gaskets used to avoid leaks in the system. The free end of the UroFLU piece was then fit into a three-way valve and connected to a syringe that had previously been filled with alginate (1.5-3%). The flow of alginate was achieved by a six-channel pump (SDX Teth-ered Membranes Pty Ltd), which was under software control to achieve flow-rates of µL/min so as to slowly and precisely
control the formation of the “finger-like” extrusions. Alginate polymerization was achieved by adding CaCl2 (100 mM) in the upper chamber once alginate had started to be extruded. PE coating was done over several substrates to which the general layer by layer deposition protocol was adapted (see Fig. SI.1). PSS and PAH were always prepared in a 1 mg/mL concentra-tion soluconcentra-tion, dissolved in either CaCl2 (5, 100 or 500 mM), NaCl (250 or 500 mM), MgCl2 (500 mM) or KCl (500 mM). Then, alginate dissolution was done with EDTA.
In the second approach (Fig. 3), sacrificial alginate moulds were created from 3D printed pieces containing pillars (Fig.
3.A). The feasibility of this approach was tested using a
proto-col inspired from a previously published method (14). Square moulds were filled with alginate and covered with a piece of Whatman paper soaked with CaCl2 (100 mM). A support con-taining a chamber was then placed on top of the paper and the system was hold together with clamps. The resulting chamber was then filled with CaCl2 (100 mM). The system was then in-cubated for 4h at room temperature to allow alginate gelation. That protocol produced “finger-like” alginate structures from which a free-floating PE membrane was formed (Fig. SI.4.1). To go beyond that feasibility of forming a polyelectrolyte mem-brane and to better control the attachment of the polyelectro-lyte membrane to a substrate, new pieces namely UroBOXES were designed and manufactured by 3D printing (Fig. 3.B). PE coating over the UroBOXES was done by assembling the green piece with the black one containing the corresponding alginate mould. The “cheddar-like” piece (orange one) was then used to keep the green piece in tight contact with the alginate mould. The whole system was hold together with clamps. PSS and PAH solutions were alternatively added to the free surface on the green piece and incubated for 5 minutes (Fig. SI.1). A washing step with milliQ water followed by a liquid removal from the piece with an absorbent paper was done between each layer (see Fig. SI.1). This procedure was repeated until the de-sired number of layers was obtained. All incubation steps were done under gentle agitation on a rocking platform (70 rpm) and at room temperature.
Some technical issues were addressed during the assembly procedure. First, it was required to have a perfect alignment between the wells created on the alginate mould and the holes in the second piece. This issue was solved by designing the blue and green piece with the pillars/holes respectively in the exact same position. Secondly, the addition of liquids to the system was necessary for alginate gelation, polyelectrolyte coating and cell culture. Alginate needs to be contained in a support and a non-leaky connection needs to be created between the black and blue piece. Therefore, both pieces contain walls to avoid these drawbacks. Finally, the green piece was originally created with symmetrical walls on both sides of the horizon-tal plane. However, this design prevented liquid from entering the bottom chamber, and placed the horizontal plane outside the normal working distance for microscope objectives. This design was not appropriate for cell culture nor for imaging by inverted microscopy. For these reasons, a new (grey) piece was
A.
B.
C.
Figure 2. Conceptual view of a device integrating nanostructured free-standing supporting membrane. A. Schematic
architec-ture of finger-like nanostrucarchitec-tured scaffolds. The polyelectrolyte membrane (PEM, in red) creates acinar/ductal free standing and porous 3D structures that enclose the top of the microfluidic culture chamber to control the microenvironment for the cells. B. Close-up of the porous nanostructured membrane. Epithelial cells (EC, in green) are on the inside of the polyelectrolyte membrane. Cancerous cells are spiked from the outside of the polyelectrolyte membrane. Arrows indicate the secretions produced by EC. C. Schematic process of finger-like PE fabrication with sacrificial core (in purple).
created with a castellation shape to enable the passage of liquid to the bottom chamber as well as to provide the opportunity to remove almost completely one of the walls in the green piece, which placed the horizontal plane within the working distance of the objectives for inverted microscopy. After several trials had been done, an extra set of pieces was designed to evaluate different diameter sizes as well as the height of the pillars. This set consisted in a blue and green piece containing four different conditions (h = 0.4 or 1 mm and Ø = 0.5 or 1 mm) with three replicas for each condition.
Cell culture and imunofluorescence
RWPE-1 and WPE1-int were growth in KSFM (Life Technolo-gies, Carlsbad) supplemented with 5 ng/mL of epidermal growth factor (EGF) and 50 mg/mL of bovine pituitary extract (Gibco) and 1% Penicillin-Streptomycin (Gibco). Cells were cultured up to 70% confluence and seeded in T25 Flasks at a density of 2 × 10⁴ viable cells/cm2. PNT2 (SV40-immortalized normal adult
prostate epithelial cells), PC3 and LNCaP (cancerous prostatic cell lines) previously described (11) were used for MALDI-based analysis of the secretome from normal and cancerous cells. Among the cancerous cells, PC3 are androgen receptor-negative while LNCaP, as androgen receptor-positive cells, have the prop-erty to secrete PSA. PNT-2 cells were obtained from ECACC (N_95012613) and were routinely cultured in RPMI Glutamax culture media supplemented with 10% foetal calf serum and 1% penicillin/streptomycin. PC3 cells (ATCC, CRL-1435) were initiated from a bone metastasis of a grade IV prostatic adeno-carcinoma from a 62-year-old male Caucasian. PC3 cells were routinely cultured in RPMI Glutamax culture media (Invitrogen, Ref. 61870-010) supplemented with 10% fœtal calf serum (PAA, Ref. A15-101) and 1% penicillin/streptomycin (Invitrogen, Ref. 15140-122). LNCaP (ATCC #1740) were grown in 2D in 25 cm² flasks with 5 mL of RPMI 1640 medium supplemented with 10% SVF penicillin-streptomycin. Pre-treated SVF was used (charcoal filtered) to remove all residues of hormones. All cell lines were grown in an incubator at 37°C, 5% CO2, and 95% humidity. For
different passages, the cells were washed twice with PBS followed by the addition of trypsin–EDTA and incubation for 3–10 min depending on the cell line. Trypsinisation was stopped by adding 6 to 8 ml of 0.1% soybean trypsin inhibitor. Cells counting was performed following centrifugation (5 min at 1600 rpm) and af-ter adding 10 µl Trypan Blue to 10 µl of cell suspension.
In order to investigate the invasiveness processes, LNCaP cells were labelled with the Molecular Probes_CellTracker™_Green CMFDA (5-chloromethylfluorescein diacetate) (Life Technolo-gies C7025) (3 µM, for 30 minutes) and then introduced into a monolayer of PNT-2 epithelial cells once they reached 90% of confluency. For immunostaining assays, cells were then incu-bated for 20 min at room temperature in PFA 4% in PBS then rinsed in PBS for 10 minutes and permeabilized 5 minutes in 0.5% Triton X100 in PBS. Cultures were finally incubated with Phalloidin-Cy3 (1:400) in PBS for 1 hour then washed 3x5 min-utes and then nuclei were stained with Hoechst (2 µg/ml) for 10 minutes. Stained cells were imaged by fluorescence microscopy using a confocal spinning-disk inverted microscope (Nikon TI-E Eclipse) with a 20x air objective equipped with a Yokogawa CSU-1 Unit for z-stack acquisitions and an Evolve EM-CCD camera. Primary Renal Proximal Tubule Epithelial Cells (RPTEC) were kindly provided by I. Villegrain (CEA Grenoble) and were used as control for ELISPOT assay as non-PSA secreting epithelial cells.
Biochemical analysis of secretions
Biochemical studies were carried out on secreted supernatants from cells grown in 2D to validate the use of our cell lines and the possibility to detect secreted proteins in the supernatants with-out having to apply purification or concentration steps. The 2D format offers very well controlled culture conditions to evaluate the minimum number of cells required to perform a secretom-ics-based Maldi analysis. Moreover, this number of cells and the corresponding volume of secretions need to be compatible with further microfluidic integration and sampling. PSA was chosen as “housekeeper” protein for the secretome.
A.
B.
Figure 3. Schematic of alginate gelation process over 3D printed moulds. A. sacrificial alginate mould (c) is created over a 3D
printed piece (a) to obtain a 3D shaped polyelectrolyte membrane (d). B. List of the 3D printed pieces. The assembly of these pieces allow the creation of PE pillar-like structures.
Western Blot was performed with the same supernatant of cell culture used for MALDI analysis. Different quantities of supernatant were separated by electrophoresis on a NuPAGE™ Novex™ 4-12% Bis-Tris Protein Gel (Life Technologies) in MES buffer and then transferred onto a nitrocellulose membrane (Sigma-Aldrich). The membranes were blocked in 5% non-fat milk in Tris-buffered saline, 0.1% Tween 20 (TBS-T, Sigma) for 1 hour at room temperature and incubated with primary anti-bodies diluted at 1:1000 in 5% non-fat milk in TBS-T overnight at 4°C. Rabbit polyclonal antibodies directed against PSA (PSA/ KLK3 (D6B1) XP® Rabbit mAb ref 5365, cell signalling tech-nology) and GAPDH (Santa Cruz Biotechtech-nology) were used. Membranes were washed three times for 10 min in TBS-T and incubated with secondary horseradish peroxidase-conjugated antibodies (anti-rabbit, eBiosciences) at a dilution of 1:10000 in TBS-T for 50 min. Membranes were washed three times for 10 min in TBS-T and revealed with ChemiDoc™ MP systems (BioRad). Chemiluminescence was analysed using a Chemi-Doc Touch Imaging System (BioRad).
ELISA tests were performed by using a Human Free PSA ELISA Kit from Anogen (EL10050) for the in vitro quantita-tive determination of free Prostate-Specific Antigen (fPSA) concentrations in the supernatant. Washing steps were per-formed with PBS, Tween 0.05% and milk 5% during 15 min. Incubation with IgG anti-PSA-ncam was performed during 30 min and incubation with a rabbit HRP (1:1000) during 30 min. Washing step was done with PBS Tween 0.05% during 15 min, twice.
The “Proteome Profiler Human XL Cytokine Array Kit” was used with 200 µl of the same supernatants used for biochem-istry and MALDI analysis and following the supplier protocol and revealed with ChemiDoc™ MP systems (BioRad) with an exposure time of 150 seconds. For the calculation of the in-tensity of each of the spots, we used the Fiji software with the “Microarray profile” plugin. Each protein was spotted twice on the microarray and the histogram corresponds to the mean of the integrated density obtained for these two spots to which the value of the negative control has been subtracted.
Mass Spectrometry-based analysis of secretions
(a) Sample Preparation for MALDI
LC-MS grade Water, Acetonitrile (99.9%), and trifluoroacetic acid (99%) were obtained from Sigma-Aldrich. α-Cyano-4-hydroxycinnamic acid and calibration standard mix (BTS) were purchased from Bruker Daltonics. For each spot, 0.6 µl of cell supernatant was mixed with 0.6 µl of α-Cyano-4-hydroxycinnamic acid (10mg/ml in acetonitrile/water/ trifluoroacetic acid 50:49,8:0,2 v/v/v) and deposited onto a 384 MTP AnchorChip Target (Bruker Daltonics).
(b) MALDI profiling
MALDI mass spectrometry profiling was performed on an Ultraflex III MALDI-TOF/TOF (Bruker Daltonics) equipped with a Smart-beam laser operating at 1000 Hz pulse rate. Ions were detected in positive linear mode at +20 kV accelerating
potential, in the mass range of m/z 1000-20000 with ion suppression up to 950 Da. On each sample spots, 5000 spectra were summed with automatic spectral quality evaluation.
Statistical analysis of spectral data
Spectra were preprocessed (tophat baseline removal and smoothing) and normalized by total ion current (TIC) in Bruker Clinprotool software v3.0. 2D peak distribution and Principal Component Analysis (PCA) was performed in Clinprotool. Unsupervised hierarchical clustering was performed on exported spectra from Clinprotool, using log transformation of the intensities and clustering via uncentered correlation similarity metric (Gene cluster v3.0). For each condition, 3 biological replicates were analysed 3 times.
Results
Validation of the concept of PE scaffolds for acinar-like structures reconstruction
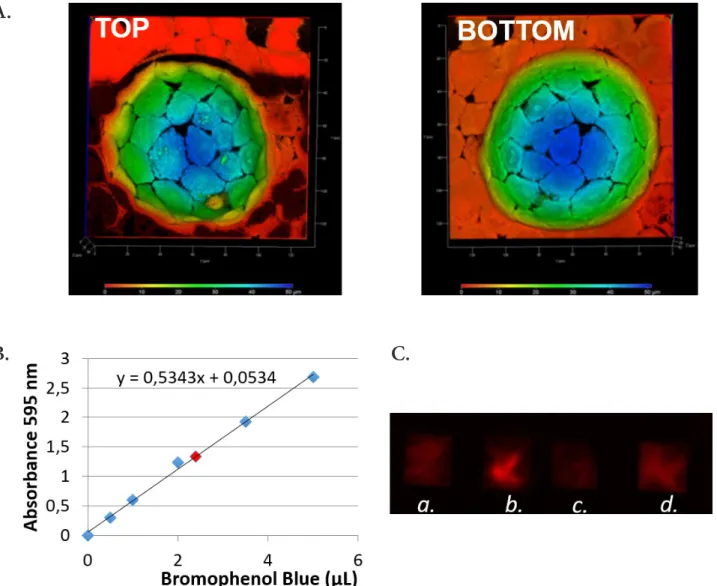
Cells at day 8 were well-organized at the bottom of the PE scaf-folds and form a monolayer with intercellular tight junctions re-vealed by immunofluorescence (Fig. 4). Moreover, a protocol to collect secretions from cells grown in the wells was established. The volume of secretions was determined to be 1.76 µl per 100 wells, according to the bromophenol blue volume which has been transferred to Whatman paper and then measured from the calibration curve (Fig. 4.B). This volume of 1.76 µl per well is consistent with a microfluidic handling.
In order to validate the exocrine function of prostatic cells grown at the bottom of the wells, we verified that cells did se-crete PSA. For this, the medium present above 3 moulds was harvested in 3 conditions. WPE1-int unstimulated with DHT, WPE1-int stimulated with DHT, but also 3 PDMS mould with RPTEC cells (renal cells, as negative control). A positive control was made with 3 ng of pure PSA (Fig. 4.C). We observed that the medium of the stimulated WPE1-int present PSA. The ELISPOT analysis confirms that it is possible to detect PSA secreted by cells growing in small wells that have an hemisphere-shape that mim-ics the dimensions of acinar-like structures.
To validate our hypothesis that cancerous cell lines can be discriminated on the basis of their secretome, we performed biochemical analysis from their supernatant. As expected and confirmed with ELISA test, PSA secretions were detected from LNCaP, with or without stimulation (15) by contrast to the other cell lines that are described as not secreting PSA (16) (Fig. SI.5). With the same LNCaP supernatant used for ELISA, we performed ELISPOT (Fig. SI.5.B) and Western Blot (Fig.
SI.5.C) assays as second confirmation. The protease
microar-rays showed overexpression of PSA and many other known proteins (e.g. Urokinase, Kallikrein 10, 7, 6, 5, Cathepsin D) in the LNCaP cell-line compared to the others (Fig. SI.5.D).
Mass Spectrometry Profiling of the secretome from cancerous cells
To avoid any interference of FCS within MALDI analysis, FCS was replaced with BSA 2g/L, as previously described in the
lit-erature (17, 18), during the incubation phase used to recov-er the secretory fluid. In the final point aftrecov-er five days, a Live/ Dead staining showed no cell mortality and no alteration in cell morphology (data not shown). After biochemistry valida-tions, supernatants from LNCaP, PNT2 and PC3 cell cultured as described above were analyzed by MALDI MS in the range of 1000 to 20000 Da for peptides/small proteins profiling. The amount of supernatant spotted was normalized to approxi-mately 300 cells per sample.
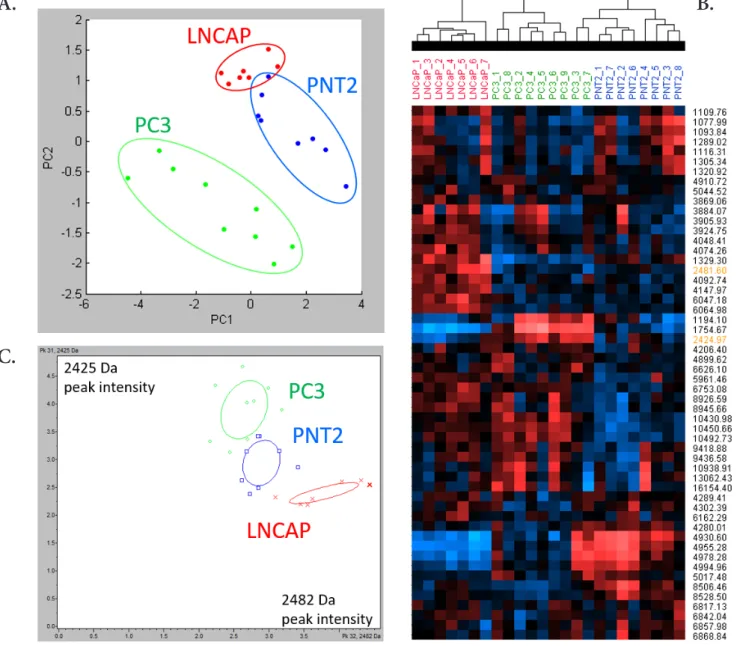
Fig. 5A shows PCA of the 3 different cell lines. Spectra are
projected in a coordinate system defined by the PCs (95 % of the total variance). The best segregation between normal and cancerous cells is reached by representing data in a PC1-PC2 plane. The score plots reveal a trend of separation of MALDI spectra corresponding to the different cell lines. The discrim-ination of the supernatants from the different cell types was further confirmed by the unsupervised hierarchical clustering analysis (Fig. 5.B). The obtained dendrogram indicates that MALDI MS data of the supernatants are specific of each cell
lines. Fig. 5.C shows the two peaks that have the most signifi-cant p-value to differentiate the 3 cell types (see also Fig. SI.6). The 2D peak distribution resulted in a clear segregation of the 3 cell lines.
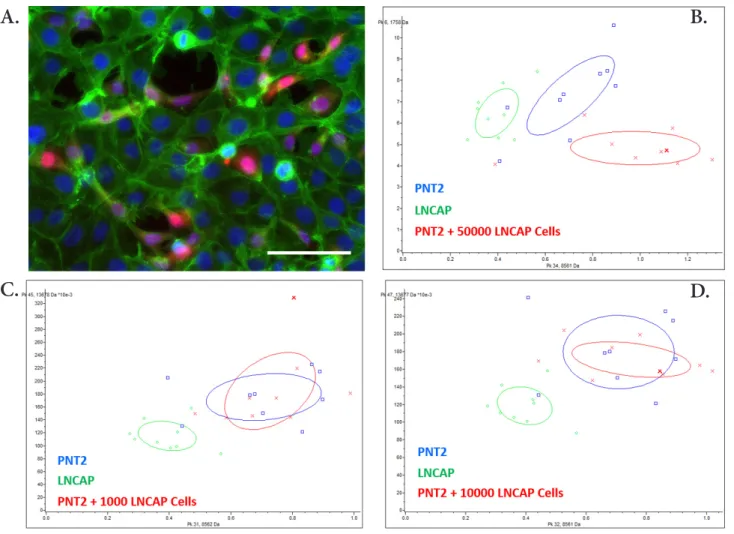
To assess the ability to differentiate a healthy PNT2 culture from a PNT2 and LNCaP co-culture, different numbers of LNCaP cells (1,000, 10,000 and 50,000) have been seeded in a PNT2 culture and MALDI profiling analysis has been per-formed on the supernatant. We first observed that spiked can-cerous cells were properly incorporated in the non-cancan-cerous cell monolayer (Fig. 6.A). Tumour cells settled down, prolifer-ated, and gradually populated the device, to possibly replace healthy basal cells and eventually affect the overall secretory profile of the tissue. Fig. 6.B-D illustrates the 2D peak distribu-tion of MALDI profiling of supernatants from PNT2, LNCaP and PNT2 loaded with 1,000, 10,000 or 50,000 LNCaP cells. While LNCaP culture is clearly separated, the differentiation of PNT2 and PNT2 co-cultured with LNCaP cells is less obvious. However, there is a tendency to separate the PNT2 co-culture
A.
B.
C.
Figure 4. Hemisphere-shaped PE scaffolds. A. RWPE-1 cells cultured for 5 days on a PE coated mould. A deep color elaboration of
the 3D acquisition shows the cellular distribution on the coated hemisphere (Red 0 μm- blue 50 μm). B. Calibration curve to deter-mine the volume of secretion. C. Elispot detection of secretions from WPE1-int cells w/o DHT (a); WPE1-int w/DHT (b); RPTEC cells (negative control) (c) and 3 ng pure PSA (positive control) (d).
condition when the amount of LNCaP is increased to 50,000 cells (Fig. 6.B)
Integration of self-supporting acinar-like scaffolds within Prostate-on-Chip
On the basis of the results obtained with PE-coated hemi-spheres, we developed incremental systems to construct self-supporting finger-like scaffolds providing an access to both side of the acinus, basal and luminal. Alginate flowing was used to create a sacrificial 3D shaped structure in top of which polyelectrolyte membrane would be created. The idea was then to obtain a homogeneous region containing several alginate pillars. Moreover, the use of a programmable software controlled syringe pump would allow a fine optimisation and automatisation of the process. Nevertheless, alginate flowing through the 3D printed UroSCAF pieces resulted in irregular
and non-uniform extrusions of alginate from the holes; some-times extrusions appeared from only one hole. Moreover, when the procedure was repeated with the same piece, alginate came out from a different hole. These results may have been due to microfluidic physical flow-resistance issues, which might be due to slight differences in the shape between different holes in the same piece that was 3D-printed.
As this first device (see Fig. 2) didn’t allow the assembly of an array of hollow scaffolds in a reproducible manner, we then de-veloped another approach by assembling 3D-printed modules composed of “finger-like” structures instead of microholes (see
Fig. 3). Alginate gelation was achieved by following a published
protocol (19) that was adapted to our system. The optimisation of the protocol worked out well and the gelation and shaping of the alginate was reproducible (data not shown). Thus, polye-lectrolyte membranes were obtained from alginate moulds
con-A.
B.
C.
Figure 5. MALDI profiling statistical analysis of 3 cell lines supernatant. A. Principal Component Analysis of PC3, LNCaP and PNT2
spectra. B. Unsupervised hierarchical clustering of PC3, LNCaP and PNT2 spectra. Peaks used for 2D peak distribution are highlight-ed in orange. C. 2D peak distribution, plotting the intensities of peaks 2425 Da and 2482 Da across PC3, LNCaP and PNT2 spectra.
taining wells. The dissolution of PE coated alginate moulds by in-troduction in an EDTA bath resulted in a visible fragile floating membrane shaped to the desired structure (Fig. SI.4.A) How-ever, these floating structures could not be manipulated and the protocol was then adapted to provide a membrane that could be attached to a glass surface, which would enable the manipulation of the obtained polyelectrolyte membrane and its optimisation on both the holographic and confocal microscopes. However, this procedure induced folding in the polyelectrolyte membrane originated by an uneven attachment of the membrane to the bot-tom of the petri dish. Nevertheless, as expected, this procedure allowed us a good optimisation of the shape. The optimisation of those membranes showed a difficulty of the finger-like shape to remain self-supporting (Fig. SI.4.B) although they seemed to hold their shape in the floating membranes. Moreover, when the polyelectrolyte membrane was attached to a surface, most of the fingers seemed to have exploded or collapsed and were princi-pally found in three conformations: volcano like, side collapsed or central collapsed. We hypothesise that this could be due either to the strong electrostatic force created between the glass (coated or not) and the polyelectrolyte membrane; or to the electrostatic forces produced between the walls of the finger itself.
New UroBOXES pieces were then carefully designed (see Fig.
3) and created to have a polyelectrolyte membrane accessible
from both sides and easily manipulated. Promising results were obtained from the first trials where almost closed fingers could be seen (Fig. SI.4.C). Further optimisations of the protocol re-sulted in the reduction of the hole size found in the polyelectro-lyte membrane although the presence of those defects were not eliminated. Several hypotheses were then set for the existence of this holes which could either be due to: (i) the difficulty to remove completely the liquid from the holes due to their small size or (ii) the lack of mixing inside each one of the wells due to their size.
Discussion
In this study we demonstrate how to discriminate non-can-cerous from cannon-can-cerous cell lines by MALDI profiling of secre-tions following 48h of cell growth, with no concentration or purification steps and without any a priori on the knowledge of targeted proteins. The analysis of the crude supernatants of 3 different cell lines (PNT2, PC3 and LNCaP) demonstrated the capacity of the MALDI MS profiling approach to identify spe-cific MS signatures. This result encouraged us to further
per-A.
B.
D.
C.
Figure 6. PNT2 cells co-cultured with LNCaP cells. A. Mixed population of non-cancerous (PNT2) and cancerous (LNCaP) prostatic
cells. Confocal image of LNCaP labelled with CellTracker™_Green (here in red) on a PNT2 cells layer (here in green) cultured for 72h. Blue: Hoechst; Green Phalloidin; Red: LNCaP labelled with CellTracker™_Green. False colors are used for better visibility. Bar : 100 µm. B. 2D peak distribution of MALDI profiling analysis of PNT2 cells co-cultured with LNCaP cells.
form the analysis of supernatant samples from PNT2 normal cells co-cultured with small amount of LNCaP tumor cells to detect a specific MS signature of a tumor invasion mimicking condition. As expected, the discriminative ability of MALDI profiling was less significant in our experimental settings. How-ever, the data obtained in the condition with PNT2 co-cultured with 50,000 LNCaP cells remain promising. Considering the low concentration of cells secretome in the supernatant and the presence of highly abundant BSA in the culture media, several optimisation steps could be implemented to improve MALDI MS detection of pertinent markers. We envision that future developments including pre-concentration and enrichment of cells secretome in specific microfluidic devices will greatly en-hance the MALDI detection of specific secreted markers.
It is known that tumour cells change their genetic expres-sion pattern during the stages of increasing malignancy (19). That leads to differential secretion of peptides or proteins from the tumour cells but only in very low amounts. Existing mass spectrometry analysis is variable due to the need to measure these small amounts of secreted peptides and proteins in whole body fluids. Nonetheless, the principle of the change in levels of secreted peptides and proteins has been demonstrated by mea-suring the supernatant of cultured carcinoma cells using mass spectrometry (19). Those published reports from cell culture supernatant augurs well for the approach taken by UroLOC, since the perspective of UroLOC device is to collect the in-line secretions of tumour cells, in a controlled microenvironment, for analysis of the secreted peptides and proteins using mass spectrometry. In our approach, the status of cancerous cells is determined by comparing the analysis of secretions from a pre-formed layer of normal urothelial cells (“before”) to the change in secretions induced after “seeding” the urothelial cells into the pre-formed layer (“after”). Thus, unlike previous reported sys-tems where the markers in secreted fluids are detected by fixed-cell immunostaining, thus implying the death of the fixed-cells (5), our UroLOC lab-on-chip device makes it possible to analyse in real-time the composition of the secretions from the living cells. (For example, the analysis of secreted fluid can be made over several days for carrying out kinetic studies, while main-taining the viability and the functionality of cells over time). As a first example to mimic an exocrine gland to demonstrate the function our new approach to a 3D lab-on-chip device, we have taken the medical problem of measuring changes in the secre-tions from the acinar cells of the prostate gland and then to consider the use of detecting these small changes in secretions as an early indicator/diagnostic for prostate cancer.
We also demonstrated in this study the feasibility of 3D shap-ing a polyelectrolyte membrane resultshap-ing in a 3D self-support-ing nanostructured membrane. At this stage, the polyelectro-lyte membrane was floating and its manipulation was difficult and the realisation of closed finger-like structure in all the holes of the pieces still need optimisation for complete reproducibil-ity. However, our design along with first validation are prom-ising in the way to closely mimic the functional conditions of the secretory ductal/acinar structures. Continuing this
devel-opmental path provides a significant advantage, since it is well-known that the function of secretory cells changes dramatically from the classical 2D culture plates to even Matrigel® cultures.
Indeed, 3D cultures are essential for investigating more natural responses from exocrine tissue such as breast epithelial cells.
Tumour cells change their genetic expression pattern as they progress to states of increasing malignancy (19). Investigations at the DNA and RNA level alone cannot provide all the infor-mation resulting after the translation and processing of the corresponding proteins, which is one reason for a poor cor-relation between mRNA and the respective protein abundance. In diagnostics, differentially expressed peptides or proteins are important markers for the early detection of cancer. Unfortu-nately, tumour cells secrete peptides and proteins in only very low amounts, making mass spectrometric determination very difficult. As reported by Peter et al (19), methods have been developed for the effective enrichment and cleanup of sub-stances secreted by cultivated cancer cells. To obviate peptides from fetal calf serum used in cell culture, a serum surrogate was developed, which maintained growth of the cancer cells. After the binding of substances from cell-culture supernatants to custom-made magnetic reversed-phase particles, the sub-stances were eluted and separated by capillary high-perfor-mance liquid chromatography. Fractions were spotted directly on a MALDI target, and MALDI-TOF mass spectrometric data acquisition was performed in automatic mode. This technol-ogy was used to detect substances secreted by two mamma-ry carcinoma cell lines differing in their malignancy (MCF-7, MDA-MB231). Unequivocal differences in the peptide secre-tion patterns were observed. In conclusion, this system allows the sensitive investigation of peptides secreted by cancer cells in culture and provides a valuable tool for the investigation of cancer cells in different states of malignancy(20).
Our concept to collect secretions directly from the urothe-lial cells (e.g. prostate) is radically different from the attempt to purify these secretions from whole urine. The existing use of whole urine as the sample from which to detect molecules secreted by cancerous urothelial cells is an arduous task for several reasons. Tumour cells secrete peptides and proteins in only very low amounts(19). Urine is variable in volume, pH, type of background protein “noise”, and is particularly variable depending on the time of day of collection (21).Consequently, it is very difficult to purify urine in a reliable way in order to de-tect the small amount of molecules secreted by urothelial cells. To have access to those low amounts of peptides and proteins in whole urine, existing procedures require complex enrichment and cleanup protocols prior to mass spectrometric analysis of whole urine.
Conclusion
In conclusion, our work hence anticipates the use of microfluid-ics connected to our nanostructured scaffolds to obtain concen-trated secretions without the need of complex filtration (such as would be needed by using whole urine). It opens also new opportunities in terms of liquid-biopsy based diagnosis (Fig.
SI.7). In the early stages of carcinogenesis, only small numbers
of cells are being transformed into tumour cells, which are ex-pected to be associated with “minor” changes in the secretome. However, the ability to detect those “minor” changes is critical for an early-stage diagnosis. Such a diagnosis is not possible if whole-urine is measured directly due to the predominance of contaminating molecules. To overcome this drawback, our ap-proach is promising and should allow to improve sensitivity by detecting small numbers of cancerous cells in the urinary tract and/or prostate for early-stage carcinogenesis.
Acknowledgement
This research was financially supported by a grant (ANR Blanc, ANR-11-BSV5-009) from the French Agence Nationale pour la Recherche and by IDEX-GRAL.
Conflict of interest
The authors declare no financial or commercial conflict of interest.
References
1. Vidi P-A, Bissell MJ, Lelièvre SA. Three-Dimensional Culture of Hu-man Breast Epithelial Cells: The How and the Why. Methods Mol Biol. 2013;945:193-219.
2. Mosaad EO, Chambers KF, Futrega K, Clements JA, Doran MR. The Microwell-mesh: A high-throughput 3D prostate cancer spheroid and drug-testing platform. Sci Rep. 10 janv 2018;8(1):253. 3. Picollet-D’hahan N, Dolega ME, Freida D, Martin DK, Gidrol X.
Deci-phering Cell Intrinsic Properties: A Key Issue for Robust Organoid Production. Trends Biotechnol. 2017;35(11):1035-48.
4. Picollet-D’hahan N, Dolega ME, Liguori L, Marquette C, Le Gac S, Gidrol X, et al. A 3D Toolbox to Enhance Physiological Relevance of Human Tissue Models. Trends Biotechnol. 2016;34(9):757-69. 5. Kim HJ, Ingber DE. Gut-on-a-Chip microenvironment induces
hu-man intestinal cells to undergo villus differentiation. Integrative Biology. 2013;5(9):1130.
6. Kim HJ, Li H, Collins JJ, Ingber DE. Contributions of microbiome and mechanical deformation to intestinal bacterial overgrowth and inflammation in a human gut-on-a-chip. Proceedings of the National Academy of Sciences. 5 janv 2016;113(1):E7-15.
7. Costello CM, Hongpeng J, Shaffiey S, Yu J, Jain NK, Hackam D, et al. Synthetic small intestinal scaffolds for improved studies of intestinal differentiation: Synthetic Small Intestinal Scaf-folds for Improved. Biotechnology and Bioengineering. juin 2014;111(6):1222-32.
8. Wang Y, Gunasekara DB, Reed MI, DiSalvo M, Bultman SJ, Sims CE,
et al. A microengineered collagen scaffold for generating a polar-ized crypt-villus architecture of human small intestinal epitheli-um. Biomaterials. 1 juin 2017;128:44-55.
9. Bein A, Shin W, Jalili-Firoozinezhad S, Park MH, Sontheimer-Phelps A, Tovaglieri A, et al. Microfluidic Organ-on-a-Chip Models of Human Intestine. Cell Mol Gastroenterol Hepatol. 24 avr 2018;5(4):659-68.
10. Battle AR, Valenzuela SM, Mechler AI, Nichols RJ, Praporski S, Maio IL di, et al. Novel engineered ion channel provides controllable ion permeability for polyelectrolyte microcapsules coated with a lipid membrane. Advanced Functional Materials. 2009;19:201-8. 11. Picollet-D’hahan N, Gerbaud S, Kermarrec F, Alcaraz J-P, Obeid P,
Bhajun R, et al. The modulation of attachment, growth and mor-phology of cancerous prostate cells by polyelectrolyte nanofilms. Biomaterials. déc 2013;34(38):10099-108.
12. Debnath J, Brugge JS. Modelling glandular epithelial cancers in three-dimensional cultures. Nat Rev Cancer. sept 2005;5(9):675-88.
13. Dolega ME, Wagh J, Gerbaud S, Kermarrec F, Alcaraz J-P, Martin DK, et al. Facile Bench-Top Fabrication of Enclosed Circular Microchan-nels Provides 3D Confined Structure for Growth of Prostate Epi-thelial Cells. Acott TS, éditeur. PLoS ONE. 19 juin 2014;9(6):e99416. 14. Sung JH, Yu J, Luo D, Shuler ML, March JC. Microscale 3-D hydrogel scaffold for biomimetic gastrointestinal (GI) tract model. Lab Chip. 7 févr 2011;11(3):389-92.
15. Kim HJ, Ingber DE. Gut-on-a-Chip microenvironment induces hu-man intestinal cells to undergo villus differentiation. Integr Biol (Camb). sept 2013;5(9):1130-40.
16. Lang SH, Sharrard RM, Stark M, Villette JM, Maitland NJ. Prostate epithelial cell lines form spheroids with evidence of glandular dif-ferentiation in three-dimensional Matrigel cultures. Br J Cancer. 17 août 2001;85(4):590-9.
17. Francis GL. Albumin and mammalian cell culture: implications for biotechnology applications. Cytotechnology. janv 2010;62(1):1-16.
18. EVECEN M, PABUCÇUO S. The Effects of Various BSA Levels in Dif-ferent Media on Development in In Vitro Culture of Mouse Embry-os. . K. :6.
19. Peter JF, Otto AM, Wolf B. Enrichment and Detection of Molecules Secreted by Tumor Cells Using Magnetic Reversed-Phase Particles and LC-MALDI-TOF-MS. 2007;18(5):11.
20. Godugu C, Patel AR, Desai U, Andey T, Sams A, Singh M.
AlgiMa-trixTM based 3D cell culture system as an in-vitro tumor model for
anticancer studies. PLoS ONE. 2013;8(1):e53708.
21. Fontenete S, Silva J, Teixeira AL, Ribeiro R, Bastos E, Pina F, et al. Controversies in using urine samples for Prostate Cancer de-tection: PSA and PCA3 expression analysis. Int Braz J Urol. déc 2011;37(6):719-26.
3D polyelectrolyte scaffolds to mimic exocrine glands: a step towards
a prostate-on-chip platform
Nathalie Picollet-D’hahan1,*, Axel Tollance1, Cristina Belda Marin2, Lavinia Liguori2, Christophe Marquette3,
Odile Filhol-Cochet4, Isabelle Vilgrain4, Guillaume Laffitte5, Florence Rivera5, Jean-Pierre Alcaraz2, Jacques Thélu2,
Olivier Nicoud2, Thibaud Moufle-Milot2, Maxime Legues1, Ali Bouamrani6, Adrien Mombrun6, Benoit Gilquin6,
Sophie Gerbaud1, Patricia Obeid1, Fréderique Kermarrec1, Xavier Gidrol1 and Donald K. Martin2,*
1. Université Grenoble Alpes, INSERM (UMR_S 1038), CEA, BIG-BGE, F-38054 Grenoble, France 2. University Grenoble Alpes, SyNaBi, TIMC-IMAG/CNRS/INSERM, UMR 5525, F-38000, Grenoble, France 3. Université Lyon 1, CNRS (UMR 5246), ICBMS, F-69622 Villeurbanne, France
4. Université Grenoble Alpes, INSERM (UMR_S 1036), CNRS, BIG-BCI Biology of Cancer and Infection, F-38054 Grenoble, France 5. Université Grenoble Alpes, CEA, LETI, DTBS, F-38054 Grenoble, France
6. Université Grenoble Alpes, CEA, LETI, CLINATEC, F-38000 Grenoble, France
SUPPLEMENTARY INFORMATION
The EuroBiotech Journal
Figure SI.1. Polyelectrolyte coating over alginate moulds procedure. A 3D shaped alginate mould is coated with PE by
submerg-ing it in alternatsubmerg-ing solutions PSS / PAH until the desired number of layers is obtained. A washsubmerg-ing step with water is done between each solution change.
Figure SI.2. Methodology for the determination of the volume of secretions. A. Bromophenol blue solution deposited with
Tween 80 on a PDMS mold (1). The excess of blue was absorbed with paper towels (2) while the blue still present in the wells was transferred to Watman paper (3). The paper was placed in an Eppendorf tube. Hydration of Watman paper was performed with H20 + Tween 80. Then elution was performed by centrifugation (4-6). B. Adding Tween 80 to bromophenol allowed to optimize the coating inside the polymeric scaffolds and hence to increase the transfer efficacy on the absorbent paper.
Figure SI.3. UroLOC design. This figure shows all the different pieces of the UroLOC system separated and assembled together.
From left to right: UroFLU contains channels enabling fluid flow through the system; UroSCAF is a flat piece containing an array of holes that enable alginate shaping into finger-like structures; UroPERF provides a cover to the system in which a glass coverslip can be fitted for microscopy and protection of the system. Finally the UroLOC system is formed by the assembly of the three pieces.
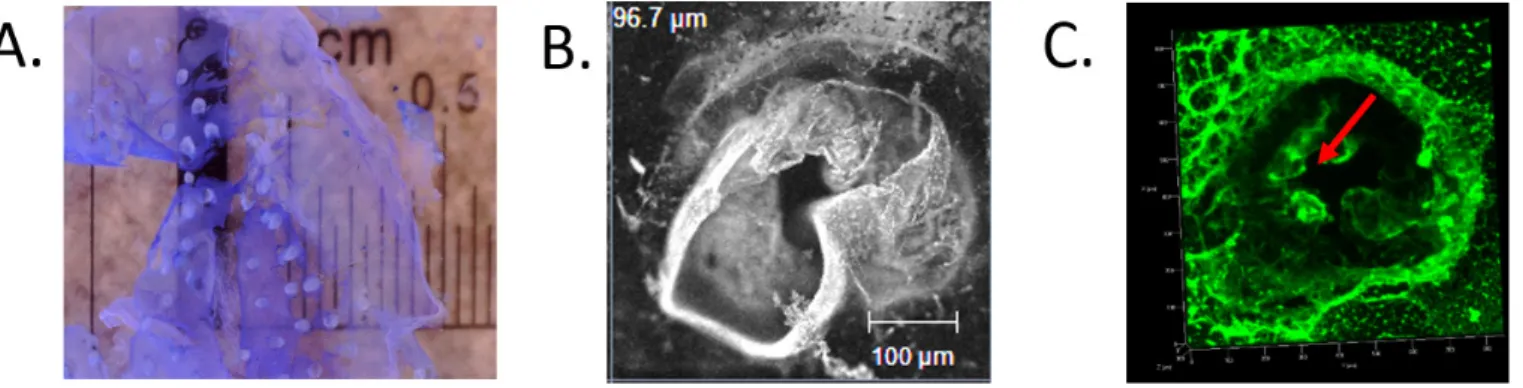
Figure SI.4. 3D finger-like shaped polyelectrolyte membrane. A. Floating 3D shaped polyelectrolyte membrane. A 3D-shaped is
obtained from an alginate mould. The PE membrane is coloured with methylene blue to allow its visualization. This image provides a close look of the finger-like structure revealing the fragility of both the membrane and the base of the finger structure. The image was taken with a digital microscope. B. The image shows a collapsed finger-like structure. Although the desired shape is achieved, it is collapsed over itself not being able to hold upright by itself. Image was acquired with a Zeiss confocal microscope (10x). C. 3D reconstructed confocal image of PE coating over the surface of the finger-like nanostructure. A broken membrane is observed in the centre of the hole (red arrow).
Figure SI.5. Biochemical validation of PSA secretion. A. PSA secretion quantified by ELISA for the LNCaP, PNT2 and PC3 cell-lines
with and without DHT stimulation. B. ELISPOT of LNCaP supernatant with and without DHT stimulation. (Analyse on the same su-pernatant of the ELISA analysis). C. Western Blot of LNCaP susu-pernatant and cell lysate with and without DHT stimulation. Different concentration of supernatant has been tested. D. Protein array for the detection and comparison of secreted proteases in LNCaP (Red), PNT2 (Green) and PC3 (Blue). Only proteins with a great difference are shown here.
Figure SI.6. MALDI profiling statistical analysis of non-cancerous and cancerous cell lines supernatants. Average MALDI Spectra
of PC3, LNCaP and PNT2 supernatants presenting the peaks 2425 Da and 2482 Da.
Figure SI.7. Perspective of a diagnostic concept for UroLOC. Exfoliated cells are isolated from the urine using gentle centrifugation
then spiked into a pre-formed layer of neutral epithelial cells in the UroLOC device. After one day of cell integration, the secretions are collected and analysed by Mass Spectrometry (MS). The MS spectrum are deconvoluted into components and compared to the reference spectra for normal tissue (e.g. prostate). The presence of a cancer is determined if there is a difference between the measured and the reference spectra (yes/no answer).