HAL Id: hal-02103829
https://hal.inria.fr/hal-02103829
Submitted on 18 Apr 2019
HAL is a multi-disciplinary open access
archive for the deposit and dissemination of
sci-entific research documents, whether they are
pub-lished or not. The documents may come from
teaching and research institutions in France or
abroad, or from public or private research centers.
L’archive ouverte pluridisciplinaire HAL, est
destinée au dépôt et à la diffusion de documents
scientifiques de niveau recherche, publiés ou non,
émanant des établissements d’enseignement et de
recherche français ou étrangers, des laboratoires
publics ou privés.
Towards disease-specific speech markers for differential
diagnosis in Parkinsonism
Biswajit Das, Khalid Daoudi, Jiri Klempir, Jan Rusz
To cite this version:
Biswajit Das, Khalid Daoudi, Jiri Klempir, Jan Rusz. Towards disease-specific speech markers for
differential diagnosis in Parkinsonism. ICASSP 2019 - IEEE International Conference on Acoustics,
Speech, and Signal Processing, May 2019, Brighton, United Kingdom. �hal-02103829�
TOWARDS DISEASE-SPECIFIC SPEECH MARKERS FOR DIFFERENTIAL DIAGNOSIS IN
PARKINSONISM
Biswajit Das
1, Khalid Daoudi
1∗, Jiri Klempir
2, Jan Rusz
2,3†1
INRIA Bordeaux Sud-Ouest (GeoStat team)
Talence, France
2
Department of Neurology and Center of Clinical Neuroscience, First Faculty of Medicine
Charles University, Prague, Czech Republic
3
Department of Circuit Theory. Faculty of Electrical Engineering
Czech Technical University in Prague, Czech Republic
biswajit.das@inria.fr, khalid.daoudi@inria.fr, jiri.klempir@lf1.cuni.cz, rusz.mz@gmail.com
ABSTRACT
Parkinsonism refers to Parkinson’s Disease (PD) and Atyp-ical Parkinsonian Syndromes (APS), such as Progressive Supranuclear Palsy (PSP) and Multiple System Atrophy (MSA). Discrimination between PD and APS and within APS groups in early disease stages is a very challenging task. Interestingly, speech disorder is frequently an early and prominent clinical feature of both PD and APS. This renders speech/voice analysis a promising tool for the development of an objective marker to assist neurologists in their diagnosis. This paper is a continuation of a recent work on speech-based differential diagnosis within APS. We address the difficult problem of defining disease-specific speech features which is crucial in the perspective of early differential diagnosis. We investigate this problem by considering the constraint that only a small amount of training data can be available in this setting. To do so, we perform univariate statistical analysis followed by a supervised learning that forces the designed new features to be 1-dimensional. We carry out experiments using speech recordings of MSA and PSP patients. We show that linear classification models allow the definition of new scalar variables which can be considered as speech features which are specific to each disease, MSA and PSP.
Index Terms— Pathological speech processing, Speech disorder, Parkinsonism, Parkinson’s disease, Machine learn-ing
1. INTRODUCTION
Speech requires the integrity and integration of numerous neurocognitive, neuromotor, neuromuscular and
muscu-∗This work is partly funded by the French research agency (ANR), project
Voice4PD-MSA noANR-16-CE19-0010-01.
†This work is partly funded by the Research Center for Informatics ( grant
nr. CZ.02.1.01/0.0/0.0/16 019/0000765), and by the Czech Ministry of Edu-cation (PROGRES-Q27/LF1).
loskeletal activities [1]. Deficit in any of this activity may be the cause of speech disorder. It is an early and prominent indication for different neurological disorder. Therefore, in such disorders, recognizing and understanding predictable patterns of speech disturbances and their underlying neuro-physiological bases can help to understand nervous system organization for speech motor control.
Parkinson’s disease (PD) is a neurological disorder caused by the degeneration of dopaminergic neurons, leading to clin-ical features characterized by bradykinesia, rigidity, resting tremor and postural instability. Atypical parkinsonian syn-dromes (APS) such as progressive supranuclear palsy (PSP) and multiple system atrophy (MSA) differ from PD by more widespread neuronal involvement, resulting in additional clinical signs, more rapid disease progression and poor re-sponse to dopamine replacement therapy [2]. The majority of PSP and MSA patients develop clinical features that overlap those of PD and thus the correct diagnosis can be very chal-lenging in early stages of the disease. However, an accurate early diagnosis is essential not only in assessing progno-sis and making decisions regarding treatment, but also for understanding the underlying pathophysiology and for the development of new therapies [3].
It turns out that speech impairment is frequently an early and prominent clinical feature of PD as well as APS. Dur-ing the last decades, there has been a increasDur-ing interest in PD speech and voice analysis [4]. However, very few at-tempts have been done in differential diagnosis between PD and APS or within APS [5, 6, 7, 8, 9]. A pioneer work [10] provides a quantitative and objective analysis of speech characteristics for the discrimination between PD and APS and between MSA and PSP. The basic conclusion is that PD speakers manifest pure hypokinetic dysarthria, ataxic compo-nents are more affected in MSA whilst PSP subjects demon-strate severe deficits in hypokinetic and spastic elements of dysarthria. Using an SVM with a Gaussian radial basis kernel
and an exhaustive search, [10] reported a 95% accuracy in objective discrimination between APS and PD and 75% in discrimination between PSP and MSA. We emphasize that classification performance was not the main purpose of [10], but rather a way to seek disease-specific dysarthric signs. In our recent study [11], standard linear and generalized linear models were explored to address the curse of dimensionality problem in this setting. This study led to an 80% accuracy in classification between MSA and PSP.
This paper is a continuation of our previous work on dis-crimination between PSP and MSA [11]. Here, we focus on defining new speech features which can objectively measure particular dysarthria attributes and which are disease-specific, in the sense that such features would have a (statistical) be-havior for PSP which is significantly different than for MSA. Moreover, we want such features to be clinically interpretable in order to improve the understanding of speech impairments in PSP and MSA. Obviously, the first benefit of such inves-tigation would be accurate and objective discrimination be-tween PSP and MSA, given that subjective evaluation is quite challenging due to similar perceptual behavior [12]. The sec-ond and more important benefit is to potentially allow draw-ing hypothesis regarddraw-ing the early stage of the diseases.
The paper is organized as follows. Section 2 describes the speech database. Acoustic features used in this study are de-scribed in Section 3. Methodology and experiments are pre-sented in Section 4.
2. DATASET
From 2011 to 2014, 12 consecutive patients with the clinical diagnosis of probable PSP (10 men, 2 women) and 13 pa-tients with the diagnosis of probable MSA (6 men, 7 women) were recruited. In this series, 9 PSP patients were diagnosed with the Richardson’s syndrome (RS), 2 with PSP-parkinsonism (PSP-P) and 1 with PSP-pure akinesia with gait freezing (PAGF), whereas 10 MSA patients were diag-nosed as the parkinsonian type (MSA-P) and 3 as cerebellar type (MSA-C). The diagnosis of PSP was established by the NINDS-PSP clinical diagnosis criteria [13], MSA according to consensus diagnostic criteria for MSA [14]. Speech sever-ity did not perceptually differ between PSP and MSA based on UPDRS speech item 18. For a detailed description of the patients we refer to [10].
Speech recordings were performed in a quiet room with a low ambient noise level using a head-mounted condenser microphone (Bayerdynamic Opus 55, Heilbronn, Germany) situated approximately 5 cm from the mouth of each subject. Speech signals were recored with 48 kHz sampling frequency and 16-bit resolution. Each participant was instructed to per-form sustained phonation of the vowel /a/ per one breath as long and steadily as possible, fast /pa/-/ta/-/ka/ syllable rep-etition at least seven times per one breath, a reading passage and a monologue on a given topic for approximately 90 s. All
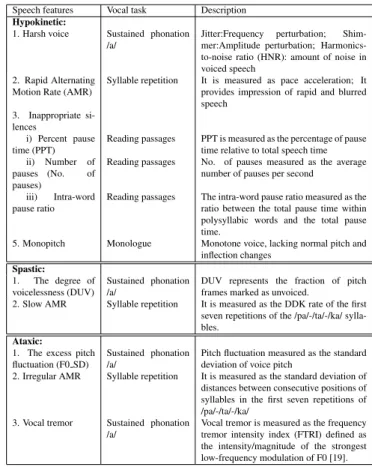
Speech features Vocal task Description Hypokinetic:
1. Harsh voice Sustained phonation /a/
Jitter:Frequency perturbation; Shim-mer:Amplitude perturbation; Harmonics-to-noise ratio (HNR): amount of noise in voiced speech
2. Rapid Alternating Motion Rate (AMR)
Syllable repetition It is measured as pace acceleration; It provides impression of rapid and blurred speech
3. Inappropriate si-lences
i) Percent pause time (PPT)
Reading passages PPT is measured as the percentage of pause time relative to total speech time ii) Number of
pauses (No. of pauses)
Reading passages No. of pauses measured as the average number of pauses per second
iii) Intra-word pause ratio
Reading passages The intra-word pause ratio measured as the ratio between the total pause time within polysyllabic words and the total pause time.
5. Monopitch Monologue Monotone voice, lacking normal pitch and inflection changes Spastic: 1. The degree of voicelessness (DUV) Sustained phonation /a/
DUV represents the fraction of pitch frames marked as unvoiced.
2. Slow AMR Syllable repetition It is measured as the DDK rate of the first seven repetitions of the /pa/-/ta/-/ka/ sylla-bles.
Ataxic:
1. The excess pitch fluctuation (F0 SD)
Sustained phonation /a/
Pitch fluctuation measured as the standard deviation of voice pitch
2. Irregular AMR Syllable repetition It is measured as the standard deviation of distances between consecutive positions of syllables in the first seven repetitions of /pa/-/ta/-/ka/
3. Vocal tremor Sustained phonation /a/
Vocal tremor is measured as the frequency tremor intensity index (FTRI) defined as the intensity/magnitude of the strongest low-frequency modulation of F0 [19].
Table 1. List and description of the 13 features, grouped by dysarthria type
participants performed the sustained phonation and syllable repetition tasks twice.
3. ACOUSTIC FEATURES
In earlier studies [15, 16] several acoustic parameters are ex-plored, we refer to [17] for the detailed description. In the same manner as in our recent study [11], in order to allow easy future comparisons or reproduction, we consider in the paper the same set of 13 features that can be computed with existing and established scripts. In [11], we adopted a “pho-netic” point of view to group the feature because our main concern was the investigation the usability of linear models to address the curse of dimensionality. In this work, our con-cern is to find/define features which can be specific to each disease and which can lead to a clinical interpretation. We thus adopt a “symptomatic” point of view (as in [10]) to cat-egorize the features into the well-known 3 dysarthria groups: Hypokinetic, Spastic and Ataxic. The set of the 13 features we consider is presented in Table 1. All there features are computed using Python and Praat scripts [18]. For phonation and syllable repetition, the final value of each feature is cal-culated as the mean of the values obtained from two vocal tasks.
In hypokinetic dysarthria, abnormality is most notably ob-served in respiratory or aerodynamic function, laryngeal func-tion, and motor control. It leads to reduced vocal loudness, monopitch, disruptions of voice quality and abnormal fast rate of speech [1]. Conversely, in ataxic dysarthria, loudness may vary excessively, and increased effort is evident which can be described as explosive speech, pitch variation, irregular AMR and vocal tremor are notable components of this group. On the other hand, spastic dysarthria can be demonstrated as voice with strained or strangled, pitch breaks. Therefore, de-gree of voicelessness and slow AMR are grouped in spastic dysarthria.
4. METHODOLOGY AND EXPERIMENTS
In all experiments, the MSA and PSP data is used to normal-ize the acoustic features to zero mean and unit variance.
4.1. Univariate statistical analysis
Given that we are faced with the curse of dimensionality prob-lem, we need to perform feature selection and/or reduction. The simplest way to do feature selection is to carry out a uni-variate statistical analysis. We use the latter as a first pass to discard the highly correlated (thus less discriminative) fea-tures. To do so, for each feature, we first compute the intra MSA (resp. PSP) class mean µmsa (resp. µpsp) and
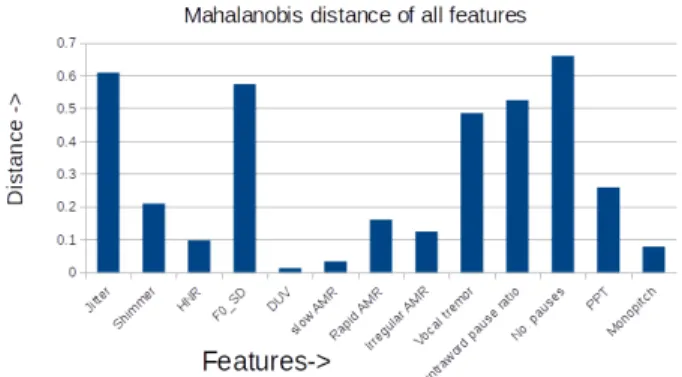
vari-ance σmsa(resp. σpsp). We then use Mahalanobis distance,
defined in Equation 1, as a measure of the the inter-class sep-aration. D = r (µpsp− µmsa)2.( σpsp+ σmsa 2 ) −1 (1)
The result of this univariate analysis is given in Figure 1. This analysis suggests that we can fairly discard monopitch from the hypokinetic set of features. Likewise, this analysis suggests that DUV and slow AMR can be disregarded. We will keep them however in our second stage of analysis in order to check whether this ”first indication” stands in our second stage of analysis. As for the ataxic group, it seems like all features are contributing towards discrimination. We thus end up considering the following sets of features:
• H = {jitter, shimmer, HNR, intra-word pause, rapid AMR, no. of pauses, PPT}
• A = {F0 SD, irregular AMR, vocal tremor} • S = {DUV, slow AMR}
4.2. Learning a new speech feature
In this section, we perform our second stage of feature se-lection and dimension reduction. Nowadays, most of “hot” machine learning problems and methods deal with large data
Fig. 1. Feature-wise distance between PSP and MSA H A S
Accuracy (%) 68 8 0
Table 2. Classification accuracy for individual dysarthric groups
sets (big data problems). In many applications however, such as biomedical engineering, data are rare and/or are collected with a (very) low time resolution. The problem we address in this paper falls in this setting; we are in a small dataset ma-chine learning scenario. Indeed, only 12 PSP and 13 MSA patients are available. Thus, typically only a 1-dimensional feature space may provide acceptable statistics. Univariate statistical analysis, as performed in the previous section, is one solution. In fact, a more involved univariate analysis has been carried out [10], using the same dataset. This led to the argument that ataxic components are more affected in MSA whilst PSP subjects demonstrate severe deficits in hypokinetic and spastic elements of dysarthria. However, univariate anal-ysis does not allow us to achieve the goal we target in this paper, that is finding a scalar speech feature which is disease specific and which is clinically interpretable.
In [11], we presented a methodology to deal with the ma-chine learning part of our small dataset problem. We showed that classical linear and generalized linear models, such as Factorial Discriminant Analysis (FDA) (also known as de-scriptive LDA) [20], can provide a simple solution to this problem. We thus proceed now to investigate whether such models can lead us to our goal.
For classification, as the amount of data is small, a Leave-One-Speaker-Out (LOSO) training approach is adopted in all the experiments. In order to have a clear understanding of
H+S+A H+S S+A H+A Accuracy (%) 72 60 24 84
Table 3. Classification accuracy for combined dysarthric groups
Hypokinetic Ataxic
Jitter Shimmer HNR Intra-word pause No. of pauses PPT Rapid AMR F0 SD Irregular AMR Vocal tremor Weight 1.03 3.02 4.77 -0.10 -0.02 -1.11 0.80 2.14 -0.49 0.37
Table 4. Feature weights obtained by FDA
the data behavior, we use a simple Gaussian classifier and a 1d linear Support Vector Machine (SVM) with C = 1 as classifiers. The results we present in the following are the same using these two classifiers.
We start (naturally) by evaluating FDA on each dysarthric group (H, A, S) individually. The idea here is to check whether a linear combination of a group feature can dis-criminate between MSA and PSP. Table 2 shows the FDA classification scores between PSP and MSA patients by in-dividual dysarthric group. This result shows that FDA on A and S are extremely low and even worse than chance. This suggest that (linear combination of) the ataxic and spastic features we consider cannot be individually disease-specific. The same argument holds for hypokinetic features, though the score is significantly higher.
We now proceed to evaluate the combination of dysarthric groups. Table 3 presents the FDA classification scores for the 4 possible combinations. This result shows that the same ar-gument we made for individual group holds also for H+S+A, H+S and S+A. Interestingly the score obtained by H+A is significantly high, even higher than the score in our recent work. This is a very good indication that measuring the ”mu-tual amount” of hypokinetic and ataxic dysarthria can allow discrimination between MSA and PSP. Moreover, our result show that a relatively simple (weighted) averaging can mea-sure this amount.
We now go deeper in the analysis of this averaging. Table 4 shows the weights obtained by FDA when training using all data (no LOSO). By looking at the weights, one observes that intra-word pause and no. of pauses have lower weights compared to the other feature. This suggests that they can be discarded in the linear FDA projection. We did so and rerun a LOSO training by discarding intra-word pause and no. of pause. This yields a classification score of 88%. This means that the arguments we stretched about hypokinetic and ataxic features (H+A) hold even better when discarding these two hypokinetic features. Figure 2 shows the values of the result-ing variable for PSP (blue) and MSA (green) patients. The latter shows that a very good separation is indeed obtained. We mention however that these classification scores should be considered with precaution because of the LOSO bias (dif-ferent weights at each iteration).
5. CONCLUSION
In this paper, we addressed the difficult problem of defining disease-specific speech features which is crucial in the per-spective of early differential diagnosis in Parkinsonism. We
Fig. 2. Values of the new speech feature for each patient
focused on MSA and PSP and investigated this problem un-der the constraint of small dataset machine learning. Using FDA, we ended up defining a new scalar variable which can be considered as a disease-specific feature. This variable is learned from data as a linear combination of some hypoki-netic and ataxic features. Using Gaussian or 1d SVM classi-fiers, we obtain a threshold which measures a certain degree of hypokinetic and ataxic “impairment”. Above (resp. below) this threshold, the patient is classified as MSA (resp. PSP). Using LOSO training, we achieved 88% classification accu-racy, which is an improvement w.r.t the 80% obtained in our recent work [11]. This achievement can be considered very successful as PSP and MSA are hardly perceptually distin-guishable [12]. This result also suggests that hypokinetic and ataxic dysarthria convey considerable discriminative informa-tion when mutually considered. Moreover, it suggests that the hypokinetic and ataxic features we retained can be used as a vehicle to capture this information. We showed indeed that an appropriate weighted averaging of these features (the new variable) led to a high classification accuracy. We empha-size however that these arguments are not a “hard” conclu-sion. They need indeed to be confirmed by additional data and studies. This is the purpose of our ongoing research. We are actually in the process of collecting a (relatively) large speech corpus of French PD and APS patients (in the framework of a large pilot study involving French university hospitals).
6. REFERENCES
[1] J.R. Duffy, Motor Speech Disorders Substrates, Differ-ential Diagnosis, and Management, Elsevier, 2013.
[2] A. Schrag, Y. Ben-Shlomo, and N.P. Quinn, “Prevalence of progressive supranuclear palsy and multiple system atrophy: a cross-sectional study,” The Lancet, vol. 354, pp. 1771–1775, November 1999.
[3] G.K. Wenning, I. Litvan, and E. Tolosa, “Milestones in atypical and secondary parkinsonisms,” Movement Disorders, vol. 26, pp. 1083–1095, May 2011.
[4] L. Brabenec, J. Mekyska, Z. Galaz, and I. Rektorova, “Speech disorders in parkinsons disease: early diagnos-tics and effects of medication and brain stimulation,” Journal of Neural Transmission, March 2017.
[5] K.J. Kluin, N.L. Foster, S. Berent, and S. Gilman, “Perceptual analysis of speech disorders in progressive supranuclear palsy,” Neurology, vol. 43, pp. 563–563, 1993.
[6] K.J. Kluin, S. Gilman, M. Lohman, and L. Junck, “Characteristics of the dysarthria of multiple system at-rophy,” Archives of neurology, vol. 53, pp. 545–548, June 1996.
[7] S. Sachin, G. Shukla, V. Goyal, S. Singh, V. Aggarwal, M. Behari, et al., “Clinical speech impairment in parkin-son’s disease, progressive supranuclear palsy, and mul-tiple system atrophy,” Neurology India, vol. 56, pp. 122, 2008.
[8] S. Skodda, W. Visser, and U. Schlegel, “Acoustical anal-ysis of speech in progressive supranuclear palsy,” Jour-nal of Voice, vol. 25, pp. 725–731, November 2011.
[9] Y.E. Huh, J. Park, M.K Suh, S.E. Lee, J. Kim, Y. Jeong, H. Kim, and J.W. Cho, “Differences in early speech patterns between parkinson variant of multiple system atrophy and parkinsons disease,” Brain and language, vol. 147, pp. 14–20, May 2015.
[10] J. Rusz, C. Bonnet, J. Klempir, T. Tykalova, E. Baborov, M. Novotny, A. Rulseh, and E. Ruzicka, “Speech disor-ders reflect differing pathophysiology in parkinsons dis-ease, progressive supranuclear palsy and multiple sys-tem atrophy,” Journal of neurology, vol. 262, pp. 992– 1001, 2015.
[11] Gongfeng Li, Khalid Daoudi, Jiri Klempir, and Jan Rusz, “Linear classification in speech-based ob-jective differential diagnosis of parkinsonism,” in IEEE-ICASSP - 2018 IEEE International Conference on Acoustics, Speech and Signal Processing, Calgary, Canada, Apr 2018.
[12] N. Miller, U. Nath, E. Noble, and D. Burn, “Utility and accuracy of perceptual voice and speech distinctions in the diagnosis of parkinsons disease, psp and msa-p,” Neurodegenerative Disease Management, vol. 7, pp. 191–203, June 2017.
[13] I. Litvan, Y. Agid, D. Calne, G. Campbell, B. Dubois, R.C. Duvoisin, C.G. Goetz, L. Golbe, J. Grafman, J.H. Growdon, et al., “Clinical research criteria for the diagnosis of progressive supranuclear palsy (steele-richardson-olszewski syndrome) report of the ninds-spsp international workshop,” Neurology, vol. 47, pp. 1–9, 1996.
[14] S. Gilman, G.K. Wenning, P.A. Low, D.J. Brooks, C.J. Mathias, et al., “Second consensus statement on the di-agnosis of multiple system atrophy,” Neurology, vol. 71, pp. 670–676, August 2008.
[15] J. Rusz, R. Cmejla, H. Ruzickova, and E. Ruzicka, “Quantitative acoustic measurements for characteriza-tion of speech and voice disorders in early untreated parkinsons disease,” The journal of the Acoustical Soci-ety of America, vol. 129, pp. 350–367, October 2011.
[16] M. Novotny, J. Rusz, R. Cmejla, and E. Ruzicka, “Auto-matic evaluation of articulatory disorders in parkinson’s disease,” IEEE/ACM Transactions on Audio, Speech and Language Processing (TASLP), vol. 22, pp. 1366– 1378, September 2014.
[17] J. Rusz, C. Bonnet, J. Klempir, T. Tykalova, E. Baborova, M. Novotny, and E. Ruzicka, “supple-mentary material: Acoustic measurements for objective evaluation of motor speech disorders.,” February 2015.
[18] P. Boersma and D. Weenink, “Praat: doing phonetics by computer [computer program],” Version 5.3.51, 2013.
[19] M. Bruckl, “Vocal tremor measurement based on auto-correlation of contours.,” in INTERSPEECH, 2012, pp. 715–718.
[20] G. James, D. Witten, T. Hastie, and R. Tibshirani, An introduction to statistical learning, vol. 112, Springer, 2013.