HAL Id: hal-01656850
https://hal.archives-ouvertes.fr/hal-01656850
Submitted on 21 Dec 2018
HAL is a multi-disciplinary open access
archive for the deposit and dissemination of
sci-entific research documents, whether they are
pub-lished or not. The documents may come from
teaching and research institutions in France or
abroad, or from public or private research centers.
L’archive ouverte pluridisciplinaire HAL, est
destinée au dépôt et à la diffusion de documents
scientifiques de niveau recherche, publiés ou non,
émanant des établissements d’enseignement et de
recherche français ou étrangers, des laboratoires
publics ou privés.
Distributed under a Creative Commons Attribution - NonCommercial| 4.0 International
License
Developed on Non-Alcoholic Fatty Liver Disease in
Absence of Cirrhosis Revealed by Tissue Extracts
1H-NMR Spectroscopy
Camille Teilhet, Daniel Morvan, Juliette Joubert-Zakeyh, Anne-Sophie Biesse,
Bruno Pereira, Sylvie Massoulier, Pierre Dechelotte, Denis Pezet, Emmanuel
Buc, Géraldine Lamblin, et al.
To cite this version:
Camille Teilhet, Daniel Morvan, Juliette Joubert-Zakeyh, Anne-Sophie Biesse, Bruno Pereira, et al..
Specificities of Human Hepatocellular Carcinoma Developed on Non-Alcoholic Fatty Liver Disease in
Absence of Cirrhosis Revealed by Tissue Extracts 1H-NMR Spectroscopy. Metabolites, MDPI, 2017,
7 (49), pp.49. �10.3390/metabo7040049�. �hal-01656850�
metabolites
H
OH OH
Article
Specificities of Human Hepatocellular Carcinoma
Developed on Non-Alcoholic Fatty Liver Disease in
Absence of Cirrhosis Revealed by Tissue Extracts
1
H-NMR Spectroscopy
Camille Teilhet1,2, Daniel Morvan3, Juliette Joubert-Zakeyh4, Anne-Sophie Biesse5, Bruno Pereira6, Sylvie Massoulier1, Pierre Dechelotte4, Denis Pezet7, Emmanuel Buc7, Géraldine Lamblin1, Michel Peoc’h8, Jack Porcheron9, Marie-Paule Vasson2,
Armando Abergel1,10and Aicha Demidem2,*
1 Department of Digestive and Hepatobiliary Medecine, University Medical Hospital,
F-63000 Clermont-Ferrand, France; cteilhet@chu-clermontferrand.fr (C.T.);
smassoulier@chu-clermontferrand.fr (S.M.); glamblin@chu-clermontferrand.fr (G.L.); aabergel@chu-clermontferrand.fr (A.A.)
2 INRA, Human Nutrition Unit, CRNH Auvergne, Clermont Auvergne University, F-63000 Clermont-Ferrand,
France; m-paule.vasson@uca.fr
3 Laboratory of Biophysics and Image Processing, Clermont Auvergne University, F-63000 Clermont-Ferrand,
France; daniel.morvan@uca.fr
4 Department of Anatomo-pathology, University Medical Hospital, F-63000 Clermont-Ferrand, France;
jjoubert@chu-clermontferrand.fr (J.J.-Z.); pdechelotte@chu-clermontferrand.fr (P.D.)
5 Team RMN-START, Clermont Auvergne University, F-63000 Clermont-Ferrand, France;
a-sophie.biesse-martin@uca.fr
6 Department of Clinical Research & Innovation, University Medical Hospital, F-63000 Clermont-Ferrand,
France; bpereira@chu-clermontferrand.fr
7 Department of Digestive Surgery, University Medical Hospital, F-63000 Clermont-Ferrand, France;
dpezet@chu-clermontferrand.fr (D.P.); ebuc@chu-clermontferrand.fr (E.B.)
8 Department of Anatomo-pathology, University Medical Hospital, F-42000 Saint-Etienne, France;
michel.peoch@chu-st-etienne.fr
9 Department of Digestive Surgery, University Medical Hospital, F-42000 Saint-Etienne, France;
jack.porcheron@chu-st-etienne.fr
10 UMR CNRS 6284, Clermont Auvergne University, F-63000 Clermont-Ferrand, France
* Correspondence: aicha.demidem@inra.fr; Tel.: +33-4-7317-8047; Fax: +33-4-7317-8038 Received: 29 August 2017; Accepted: 20 September 2017; Published: 22 September 2017
Abstract: There is a rising incidence of non-alcoholic fatty liver disease (NAFLD) as well as of the frequency of Hepato-Cellular Carcinoma (HCC) associated with NAFLD. To seek for putative metabolic pathways specific of the NAFLD etiology, we performed comparative metabolomics between HCC associated with NAFLD and HCC associated with cirrhosis. The study included 28 pairs of HCC tissue versus distant Non-Tumoral Tissue (NTT) collected from patients undergoing hepatectomy. HCC was associated with cirrhosis (n = 9), normal liver (n = 6) and NAFLD (n = 13). Metabolomics was performed using 1H-NMR Spectroscopy on tissue extracts and combined to multivariate statistical analysis. In HCC compared to NTT, statistical models showed high levels of lactate and phosphocholine, and low level of glucose. Shared and Unique Structures (SUS) plots were performed to remove the impact of underlying disease on the metabolic profile of HCC. HCC-cirrhosis was characterized by high levels of β-hydroxybutyrate, tyrosine, phenylalanine and histidine whereas HCC-NAFLD was characterized by high levels of glutamine/glutamate. In addition, the overexpression glutamine/glutamate on HCC-NAFLD was confirmed by both Glutamine Synthetase (GS) immuno-staining and NMR-spectroscopy glutamine quantification. This study provides evidence of metabolic specificities of HCC associated with non-cirrhotic NAFLD
versus HCC associated with cirrhosis. These alterations could suggest activation of glutamine synthetase pathway in HCC-NAFLD and mitochondrial dysfunction in HCC-cirrhosis, that may be part of specific carcinogenic processes.
Keywords: hepato-cellular carcinoma;1H-NMR spectroscopy; metabolomics; cirrhosis; NAFLD; metabolites; biomarkers; glutamine synthetase
1. Introduction
Liver cancer is the sixth most frequently diagnosed cancer worldwide, and the second leading cause of cancer death [1]. Hepatocellular Carcinoma (HCC) mostly develops in patients with cirrhosis, a well-known precancerous condition.
Since the past 20 years, the increasing incidence of HCC is suspected to be related to the increasing burden of Non-Alcoholic Fatty Liver Disease (NAFLD) [2,3]. NAFLD is closely linked to obesity, type 2 diabetes, dyslipidemia and insulin resistance, and considered as the liver manifestation of the metabolic syndrome [4]. NAFLD refers to a body of liver diseases including simple steatosis, steato-hepatitis, fibrosis and cirrhosis. NAFLD has become the most common liver disorder in industrialized countries, affecting up to 20% of the adult population in western countries.
Several studies report a high proportion (up to 40%) of non-cirrhotic NAFLD, as the underlying liver disease, in patients with HCC, at odds with the paradigm that cirrhosis is a necessary step in carcinogenesis [2,5–7]. Indeed, recent epidemiological data suggest that carcinogenesis might occur in NAFLD without being mediated by fibrosis [5].
Most of NAFLD patients are asymptomatic and early detection of HCC in this context is a major challenge. More investigation is needed to identify pro-carcinogenic factors in NAFLD without fibrosis. The putative pathways linking steatosis and steato-hepatitis to HCC have been little investigated. Potential carcinogenic mechanisms include inflammation with increased release of tumor necrosis factors (TNF)-alpha and interleukin 6, altered release of adipokines through insulin resistance and inflammation, lipotoxicity inducing oxidative stress and DNA damage [8,9].
Metabolomics is being widely used to gain insights into carcinogenesis mechanisms. Most metabolomics studies of HCC have been applied to serum and urine of patients, using Mass Spectrometry or Nuclear Magnetic Resonance (NMR) spectroscopy [10–12]. At present, no metabolomics study has investigated HCC histologically proved to be associated to NAFLD.
The aim of our study is to propose a specific metabolic profile of HCC depending of the underlying disease: cirrhosis versus NAFLD.
In this study, we performed1H-NMR spectroscopy-based metabolomics of HCC tissue in patients with non-cirrhotic NAFLD or cirrhosis, to seek for specific features of HCC in both underlying diseases.
We show that HCC associated with cirrhosis specifically exhibits high levels of β-hydroxybutyrate (β-HB), tyrosine (Tyr) and phenylalanine (Phe), histidine (His) whereas HCC associated with non-cirrhotic NAFLD specifically exhibits high level of glutamine/glutamate. This data is correlated with immunohistochemical expression of Glutamine Synthetase. All together, these observations may reflect specific carcinogenic processes.
2. Results
2.1. Patients
Our HCC cohort (n = 28) included 23 males and 5 females with a mean age of 69 years. Among the 28 HCC, 9 were associated with cirrhosis (HCC-cirrhosis), and 19 associated with non-cirrhotic liver tissue (HCC-Non cirrhosis). Histological examination indicated that among the 19 patients with HCC-Non-cirrhosis, 6 had a normal Non Tumoral Tissue (NTT) and 13 had NAFLD (HCC-NAFLD),
Metabolites 2017, 7, 49 3 of 17
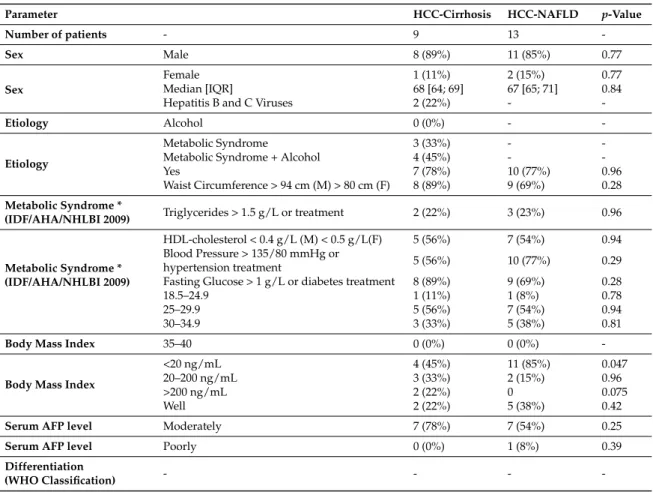
including 7 steatosis and 6 Non Alcoholic Steato-Hepatitis (NASH). Clinical, biological, histological features of the 2 groups (HCC-Cirrhosis and HCC-NAFLD) are reported in the Table1Serum AFP level <20 ng/mL was found in 85% of patients with HCC-NAFLD versus 45% in patients with HCC-cirrhosis (p = 0.047).
Table 1.Clinical, biological and pathological characteristics of 2 groups of patients.
Parameter HCC-Cirrhosis HCC-NAFLD p-Value
Number of patients - 9 13
-Sex Male 8 (89%) 11 (85%) 0.77
Sex
Female 1 (11%) 2 (15%) 0.77
Median [IQR] 68 [64; 69] 67 [65; 71] 0.84
Hepatitis B and C Viruses 2 (22%) -
-Etiology Alcohol 0 (0%) -
-Etiology
Metabolic Syndrome 3 (33%) -
-Metabolic Syndrome + Alcohol 4 (45%) -
-Yes 7 (78%) 10 (77%) 0.96
Waist Circumference > 94 cm (M) > 80 cm (F) 8 (89%) 9 (69%) 0.28
Metabolic Syndrome *
(IDF/AHA/NHLBI 2009) Triglycerides > 1.5 g/L or treatment 2 (22%) 3 (23%) 0.96
Metabolic Syndrome * (IDF/AHA/NHLBI 2009)
HDL-cholesterol < 0.4 g/L (M) < 0.5 g/L(F) 5 (56%) 7 (54%) 0.94 Blood Pressure > 135/80 mmHg or
hypertension treatment 5 (56%) 10 (77%) 0.29
Fasting Glucose > 1 g/L or diabetes treatment 8 (89%) 9 (69%) 0.28
18.5–24.9 1 (11%) 1 (8%) 0.78
25–29.9 5 (56%) 7 (54%) 0.94
30–34.9 3 (33%) 5 (38%) 0.81
Body Mass Index 35–40 0 (0%) 0 (0%)
-Body Mass Index
<20 ng/mL 4 (45%) 11 (85%) 0.047
20–200 ng/mL 3 (33%) 2 (15%) 0.96
>200 ng/mL 2 (22%) 0 0.075
Well 2 (22%) 5 (38%) 0.42
Serum AFP level Moderately 7 (78%) 7 (54%) 0.25
Serum AFP level Poorly 0 (0%) 1 (8%) 0.39
Differentiation
(WHO Classification) - - -
-Significant differences: p < 0.05 (Fisher test or Mann–Whitney test). * Metabolic syndrome: No Data for 3 patients. AFP: Alpha foeto protein; HDL: high density lipoprotein cholesterol.
2.2. Metabolomics Comparison of HCC to NTT
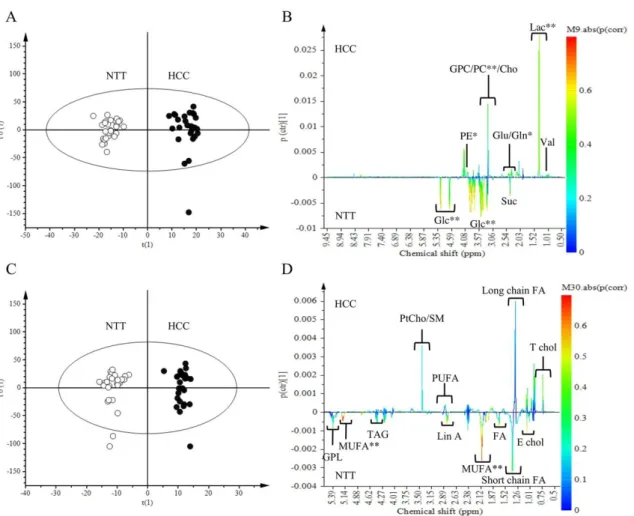
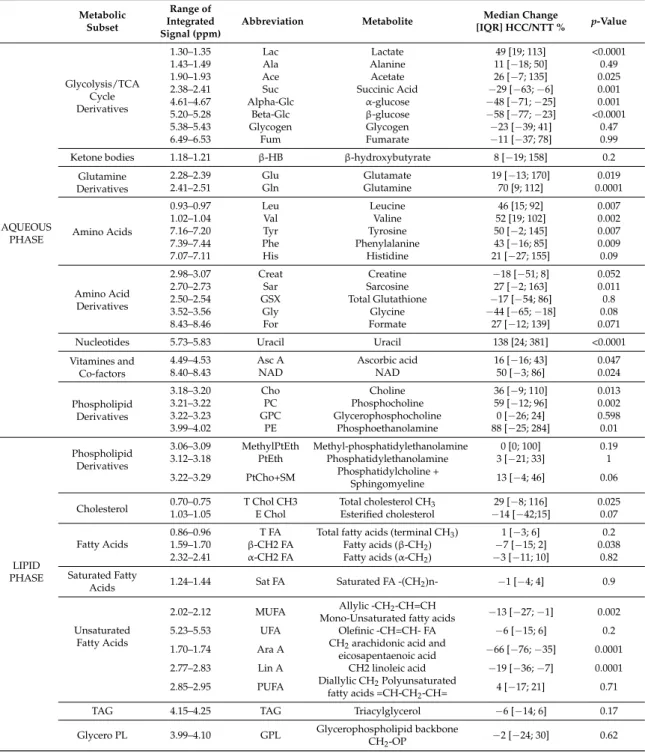
We compared the overall metabolic profile of HCC to NTT from aqueous and lipid extracts. Tissue spectra of HCC and NTT groups were separated by OPLS-DA with aqueous extract data and lipid extract data (Figure1A,C respectively). Multivariate analysis showed that HCC tissue is characterized by high level of lactate (Lac) (p (corr) > 0.7), phosphocholine (PC), phosphoethanolamine (PE), glutamine (Gln) (p (corr) > 0.5) and low level of glucose (Glc) and monounsaturated fatty acids (MUFA) (p (corr) > 0.7) (Figure1B,D). Forty-five identified metabolites were quantified from aqueous and lipid extracts, according a technique derived from [13]. Univariate analysis showed that 23 metabolites had a significant variation (Table2). OPLS-DA was performed with the quantified metabolites (data no shown). As expected, the S-plot confirmed the value of Lac as a biomarker of HCC. Analysis of quantified metabolites has the advantage of applying the same weight to each metabolite. By removing heavily contributive metabolites, such as lactate, the PC became a second biomarker of HCC tissue (data not shown).
Figure 1. Discrimination of Hepato-Cellular Carcinoma (HCC) tissue from Non-Tumoral Tissue (NTT): aqueous and lipid metabolites analysis. Orthogonal Partial Least Square-Discriminant Analysis (OPLS-DA) score scatter plot and loading S-line plot of HCC versus NTT from aqueous extract data (A,B) and lipid extract data (C,D). On the score plots, each dot corresponds to a spectrum colored according to histology (black for HCC; White for NTT). The constructed model displays a good separation between HCC and NTT. On the loading plot, variations of bucket intensities are represented from 0 to 9 ppm for aqueous extract data and from 0 to 6 ppm for lipid extract data. Positive signals correspond to the metabolites present at higher concentrations in HCC. While negative signals represent the metabolites present at higher levels in NTT. The first model (A,B) was built with 1 predictive and 1 Y-orthogonal components and exhibited an explained variance: (R2X) of 0.61, (R2Y) of 0.53, predictability (Q2Y) of 0.40. The second model (C,D) was built with 1 predictive and 6 Y-orthogonal components and exhibited an explained variance: (R2X) of 0.55, (R2Y) of 0.97, predictability (Q2Y) of 0.50. The buckets are displayed according to the colored scale of correlation coefficient p (corr) (**: p (corr) > |0.7|; *: |0.5| < p (corr) < |0.7|).
Table 2. Metabolites quantification, median variation in HCC tissue compared to NTT. Significant differences p < 0.005 (Wilcoxon Test).
Metabolic Subset
Range of Integrated Signal (ppm)
Abbreviation Metabolite Median Change
[IQR] HCC/NTT % p-Value AQUEOUS PHASE Glycolysis/ TCA Cycle Derivatives 1.30–1.35 Lac Lactate 49 [19; 113] <0.0001 1.43–1.49 Ala Alanine 11 [−18; 50] 0.49 1.90–1.93 Ace Acetate 26 [−7; 135] 0.025 2.38–2.41 Suc Succinic Acid −29 [−63; −6] 0.001 4.61–4.67 Alpha-Glc -glucose −48 [−71; −25] 0.001 5.20–5.28 Beta-Glc β-glucose −58 [−77; −23] <0.0001 5.38–5.43 Glycogen Glycogen −23 [−39; 41] 0.47
Figure 1.Discrimination of Hepato-Cellular Carcinoma (HCC) tissue from Non-Tumoral Tissue (NTT): aqueous and lipid metabolites analysis. Orthogonal Partial Least Square-Discriminant Analysis (OPLS-DA) score scatter plot and loading S-line plot of HCC versus NTT from aqueous extract data (A,B) and lipid extract data (C,D). On the score plots, each dot corresponds to a spectrum colored according to histology (black for HCC; White for NTT). The constructed model displays a good separation between HCC and NTT. On the loading plot, variations of bucket intensities are represented from 0 to 9 ppm for aqueous extract data and from 0 to 6 ppm for lipid extract data. Positive signals correspond to the metabolites present at higher concentrations in HCC. While negative signals represent the metabolites present at higher levels in NTT. The first model (A,B) was built with 1 predictive and 1 Y-orthogonal components and exhibited an explained variance: (R2X) of 0.61, (R2Y) of 0.53, predictability (Q2Y) of 0.40. The second model (C,D) was built with 1 predictive and 6 Y-orthogonal components and exhibited an explained variance: (R2X) of 0.55, (R2Y) of 0.97, predictability (Q2Y) of 0.50. The buckets are displayed according to the colored scale of correlation coefficient p (corr) (**: p (corr) > |0.7|; *: |0.5| < p (corr) < |0.7|).
Metabolites 2017, 7, 49 5 of 17
Table 2. Metabolites quantification, median variation in HCC tissue compared to NTT. Significant differences p < 0.005 (Wilcoxon Test).
Metabolic Subset
Range of Integrated Signal (ppm)
Abbreviation Metabolite Median Change
[IQR] HCC/NTT % p-Value AQUEOUS PHASE Glycolysis/TCA Cycle Derivatives 1.30–1.35 Lac Lactate 49 [19; 113] <0.0001 1.43–1.49 Ala Alanine 11 [−18; 50] 0.49 1.90–1.93 Ace Acetate 26 [−7; 135] 0.025 2.38–2.41 Suc Succinic Acid −29 [−63; −6] 0.001 4.61–4.67 Alpha-Glc α-glucose −48 [−71; −25] 0.001 5.20–5.28 Beta-Glc β-glucose −58 [−77; −23] <0.0001 5.38–5.43 Glycogen Glycogen −23 [−39; 41] 0.47 6.49–6.53 Fum Fumarate −11 [−37; 78] 0.99 Ketone bodies 1.18–1.21 β-HB β-hydroxybutyrate 8 [−19; 158] 0.2
Glutamine Derivatives 2.28–2.39 Glu Glutamate 19 [−13; 170] 0.019 2.41–2.51 Gln Glutamine 70 [9; 112] 0.0001 Amino Acids 0.93–0.97 Leu Leucine 46 [15; 92] 0.007 1.02–1.04 Val Valine 52 [19; 102] 0.002 7.16–7.20 Tyr Tyrosine 50 [−2; 145] 0.007 7.39–7.44 Phe Phenylalanine 43 [−16; 85] 0.009 7.07–7.11 His Histidine 21 [−27; 155] 0.09 Amino Acid Derivatives 2.98–3.07 Creat Creatine −18 [−51; 8] 0.052 2.70–2.73 Sar Sarcosine 27 [−2; 163] 0.011 2.50–2.54 GSX Total Glutathione −17 [−54; 86] 0.8 3.52–3.56 Gly Glycine −44 [−65; −18] 0.08 8.43–8.46 For Formate 27 [−12; 139] 0.071 Nucleotides 5.73–5.83 Uracil Uracil 138 [24; 381] <0.0001 Vitamines and
Co-factors
4.49–4.53 Asc A Ascorbic acid 16 [−16; 43] 0.047 8.40–8.43 NAD NAD 50 [−3; 86] 0.024 Phospholipid Derivatives 3.18–3.20 Cho Choline 36 [−9; 110] 0.013 3.21–3.22 PC Phosphocholine 59 [−12; 96] 0.002 3.22–3.23 GPC Glycerophosphocholine 0 [−26; 24] 0.598 3.99–4.02 PE Phosphoethanolamine 88 [−25; 284] 0.01 LIPID PHASE Phospholipid Derivatives 3.06–3.09 MethylPtEth Methyl-phosphatidylethanolamine 0 [0; 100] 0.19 3.12–3.18 PtEth Phosphatidylethanolamine 3 [−21; 33] 1 3.22–3.29 PtCho+SM Phosphatidylcholine + Sphingomyeline 13 [−4; 46] 0.06 Cholesterol 0.70–0.751.03–1.05 T Chol CH3E Chol Total cholesterol CHEsterified cholesterol3 −14 [−42;15]29 [−8; 116] 0.0250.07 Fatty Acids
0.86–0.96 T FA Total fatty acids (terminal CH3) 1 [−3; 6] 0.2
1.59–1.70 β-CH2 FA Fatty acids (β-CH2) −7 [−15; 2] 0.038
2.32–2.41 α-CH2 FA Fatty acids (α-CH2) −3 [−11; 10] 0.82
Saturated Fatty
Acids 1.24–1.44 Sat FA Saturated FA -(CH2)n- −1 [−4; 4] 0.9
Unsaturated Fatty Acids
2.02–2.12 MUFA Allylic -CH2-CH=CH
Mono-Unsaturated fatty acids −13 [−27; −1] 0.002 5.23–5.53 UFA Olefinic -CH=CH- FA −6 [−15; 6] 0.2 1.70–1.74 Ara A CH2arachidonic acid and
eicosapentaenoic acid −66 [−76; −35] 0.0001 2.77–2.83 Lin A CH2 linoleic acid −19 [−36; −7] 0.0001 2.85–2.95 PUFA Diallylic CH2Polyunsaturated
fatty acids =CH-CH2-CH= 4 [−17; 21] 0.71
TAG 4.15–4.25 TAG Triacylglycerol −6 [−14; 6] 0.17 Glycero PL 3.99–4.10 GPL Glycerophospholipid backbone
CH2-OP −2 [−24; 30] 0.62
2.3. Metabolites Quantification
Metabolite signals were quantified in all tissue spectra. For quantitative metabolomics profiling, spectra were imported into MestReNova and assigned signals were integrated. Quantification was performed by relating metabolite signals to a residual protein signal (lysine at 2.99 ppm), according to a technique derived from [13]. The Wilcoxon test was used to compare NTT and tumour tissues. In the comparison of metabolites levels between the groups of HCC tissue, Kruskal–Wallis test with Dunn’s correction was used (XLSTAT.V 2014.5.02, Addinsoft).
2.4. Comparison of HCC-NAFLD to HCC-Cirrhosis
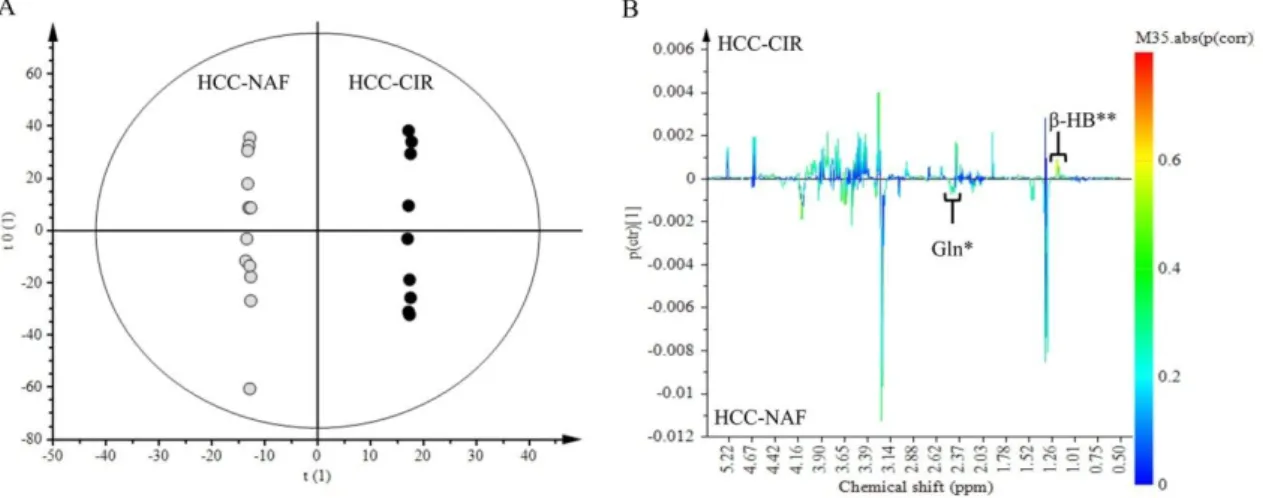
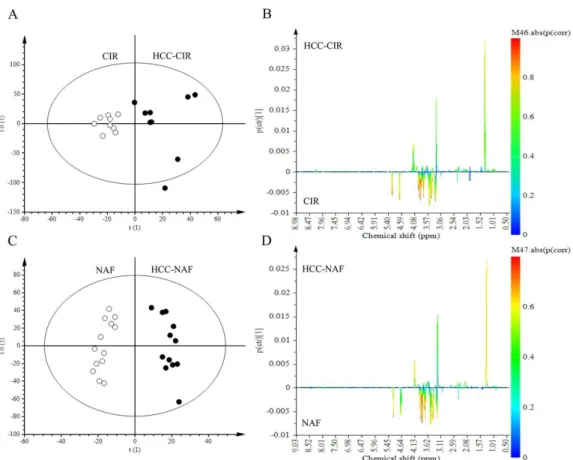
NMR spectra of aqueous extracts of HCC associated with non-cirrhotic NAFLD (n = 13) was compared to those of HCC with cirrhosis (n = 9) (Figure 2A,B). Lac (1.30–1.35 ppm) and Glc (4.61–4.67 ppm) did not contribute to the discrimination since these signals were common to both HCC groups. Among signals contributing to the discrimination, 2 metabolites were identified: β-HB (1.18 ppm) and Gln (2.45 ppm). β-HB (p (corr) = 0.58) was highly expressed in HCC-cirrhosis whereas Gln (p (corr) = 0.45) was highly expressed in HCC-NAFLD (Figure2B).
2.4. Comparison of HCC-NAFLD to HCC-Cirrhosis
NMR spectra of aqueous extracts of HCC associated with non-cirrhotic NAFLD (n = 13) was compared to those of HCC with cirrhosis (n = 9) (Figure 2A,B). Lac (1.30–1.35 ppm) and Glc (4.61– 4.67 ppm) did not contribute to the discrimination since these signals were common to both HCC groups. Among signals contributing to the discrimination, 2 metabolites were identified: β-HB (1.18 ppm) and Gln (2.45 ppm). β-HB (p (corr) = 0.58) was highly expressed in HCC-cirrhosis whereas Gln (p (corr) = 0.45) was highly expressed in HCC-NAFLD (Figure 2B).
Figure 2. Discrimination of HCC-NAFLD from HCC-Cirrhosis: aqueous metabolites analysis. OPLS-DA discriminated HCC-NAFLD (HCC-NAF) from HCC-cirrhosis (HCC-CIR) with 1 predictive and 5 Y-orthogonal components and exhibited an explained variance: (R2X) of 0.46, (R2Y) of 1, predictability (Q2Y) of 0.30. (A) Score plot: each dot corresponds to a spectrum colored according to histology (black for HCC-cirrhosis; Grey for HCC-NAFLD). The constructed model displays a good separation between the spectra of the 2 groups. (B) Loading S-line plot: variations of bucket intensities are represented using a line plot from 0 to 9 ppm with a color scale for correlation coefficient. *: |0.5| > p (corr) > |0.4|; **: p (corr) > |0.5|.
Shared and Unique Structures (SUS) plots were performed to remove the impact of underlying disease on the metabolic profile of HCC and thus, to reveal specific features of HCC-NAFLD and HCC-cirrhosis. OPLS-DA models were obtained for HCC-cirrhosis and HCC-NAFLD and compared with a NTT group (cirrhosis or NAFLD tissues). Two models were generated with HCC-NAFLD and HCC-cirrhosis in comparison with their own control groups (NTT cirrhosis (n = 9) and NTT NAFLD (n = 13)). HCC associated with normal tissue were excluded (n = 6). OPLS-DA discriminated HCC-Cirrhosis from HCC-Cirrhosis tissue (R2X = 0.44, Q2Y = 0.18) and HCC-NAFLD from NAFLD tissue (R2X = 0.35, Q2Y = 0.42) (Figure 3).
Figure 2. Discrimination of HCC-NAFLD from HCC-Cirrhosis: aqueous metabolites analysis. OPLS-DA discriminated HCC-NAFLD (HCC-NAF) from HCC-cirrhosis (HCC-CIR) with 1 predictive and 5 Y-orthogonal components and exhibited an explained variance: (R2X) of 0.46, (R2Y) of 1, predictability (Q2Y) of 0.30. (A) Score plot: each dot corresponds to a spectrum colored according to histology (black for HCC-cirrhosis; Grey for HCC-NAFLD). The constructed model displays a good separation between the spectra of the 2 groups. (B) Loading S-line plot: variations of bucket intensities are represented using a line plot from 0 to 9 ppm with a color scale for correlation coefficient. *: |0.5| > p (corr) > |0.4|; **: p (corr) > |0.5|.
Shared and Unique Structures (SUS) plots were performed to remove the impact of underlying disease on the metabolic profile of HCC and thus, to reveal specific features of HCC-NAFLD and HCC-cirrhosis. OPLS-DA models were obtained for HCC-cirrhosis and HCC-NAFLD and compared with a NTT group (cirrhosis or NAFLD tissues). Two models were generated with HCC-NAFLD and HCC-cirrhosis in comparison with their own control groups (NTT cirrhosis (n = 9) and NTT NAFLD (n = 13)). HCC associated with normal tissue were excluded (n = 6). OPLS-DA discriminated HCC-Cirrhosis from Cirrhosis tissue (R2X = 0.44, Q2Y = 0.18) and HCC-NAFLD from NAFLD tissue (R2X = 0.35, Q2Y = 0.42) (Figure3).
Metabolites 2017, 7, 49 7 of 17
Metabolites 2017, 7, 48 7 of 17
Figure 3. Discrimination of HCC-NAFLD and HCC-Cirrhosis from their own NTT: aqueous metabolites analysis. (A,B) OPLS-DA discriminated HCC-CIR from Cirrhosis tissue (CIR) with 1 predictive and 1 Y-orthogonal components and exhibited an explained variance: (R2X) of 0.44, predictability (Q2Y) of 0.18. (C,D) OPLS-DA discriminated HCC-NAF from NAFLD tissue (NAFLD) with 1 predictive and 2 Y-orthogonal components and exhibited an explained variance: (R2X) of 0.35, predictability (Q2Y) of 0.42.
The SUS-plot comparing the scaled loadings p (corr) of the two OPLS models, visualizes the shared metabolic contribution along the diagonal, and the unique metabolic contribution along the orthogonal axes (Figure 4). Common metabolic features to HCC-NAFLD and HCC-cirrhosis included the prominent high level of Lac (signals at 1.30–1.35 ppm) and low level of Glc (signals at 4.61–4.67; 5.20–5.28 ppm), displayed in the opposite corners of the plot. In contrast, metabolic specificities were displayed in boxes on horizontal and vertical axis: (i) in HCC-Cirrhosis: a high level of β-HB (signals at 1.18 ppm with p (corr) > 0.5 and signals at 1.19–1.20 ppm with p (corr) = 0.45) (Figure 5A), Tyr (signals at 3.94–3.95 ppm and 6.88–6.91 ppm with p (corr) > 0.5 ; signals at 7.17–7.18 ppm, with p (corr) = 0.45), Phe (signal 7.34–7.37 ppm with p (corr) > 0.5; signal 7.40–7.44 ppm with p (corr) = 0.45) and His (signal 7.07–7.09 ppm with p (corr) > 0.5); signal 7.91 ppm with p (corr) = 0.45) (Figure 5B); (ii) in HCC-NAFLD: high level of Glutamate (Glu) and Gln (signals at 2.11–2.17 ppm and 2.45 ppm with p (corr) > 0.5) (Figure 5C).
Figure 3.Discrimination of HCC-NAFLD and HCC-Cirrhosis from their own NTT: aqueous metabolites analysis. (A,B) OPLS-DA discriminated HCC-CIR from Cirrhosis tissue (CIR) with 1 predictive and 1 Y-orthogonal components and exhibited an explained variance: (R2X) of 0.44, predictability (Q2Y) of 0.18. (C,D) OPLS-DA discriminated HCC-NAF from NAFLD tissue (NAFLD) with 1 predictive and 2 Y-orthogonal components and exhibited an explained variance: (R2X) of 0.35, predictability (Q2Y) of 0.42.
The SUS-plot comparing the scaled loadings p (corr) of the two OPLS models, visualizes the shared metabolic contribution along the diagonal, and the unique metabolic contribution along the orthogonal axes (Figure4). Common metabolic features to HCC-NAFLD and HCC-cirrhosis included the prominent high level of Lac (signals at 1.30–1.35 ppm) and low level of Glc (signals at 4.61–4.67; 5.20–5.28 ppm), displayed in the opposite corners of the plot. In contrast, metabolic specificities were displayed in boxes on horizontal and vertical axis: (i) in HCC-Cirrhosis: a high level of β-HB (signals at 1.18 ppm with p (corr) > 0.5 and signals at 1.19–1.20 ppm with p (corr) = 0.45) (Figure5A), Tyr (signals at 3.94–3.95 ppm and 6.88–6.91 ppm with p (corr) > 0.5 ; signals at 7.17–7.18 ppm, with p (corr) = 0.45), Phe (signal 7.34–7.37 ppm with p (corr) > 0.5; signal 7.40–7.44 ppm with p (corr) = 0.45) and His (signal 7.07–7.09 ppm with p (corr) > 0.5); signal 7.91 ppm with p (corr) = 0.45) (Figure5B); (ii) in HCC-NAFLD: high level of Glutamate (Glu) and Gln (signals at 2.11–2.17 ppm and 2.45 ppm with p (corr) > 0.5) (Figure5C).
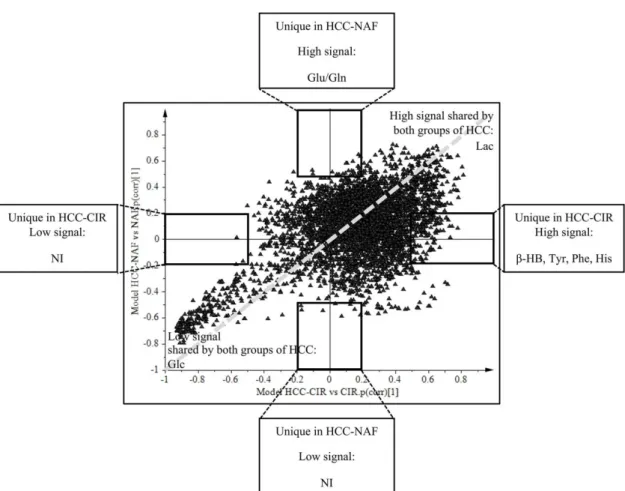
Figure 4. Common and specific metabolites of HCC-cirrhosis and HCC-NAFLD revealed by SUS-plot. Shared and Unique Structures-Plot (SUS-Plot) of 2 models (shown in Figure 3): model A (Orthogonal Partial Least Square-Discriminant Analysis (OPLS-DA) discriminated HCC-cirrhosis (HCC-CIR) from Cirrhosis (CIR), and model C (OPLS-DA discriminated HCC-NAFLD (HCC-NAF) from NAFLD (NAF). HCC-cirrhosis was characterized by increased level β-HB (β-hydroxybutyrate) (signal 1.18 ppm with p (corr) > 0.5 and signal 1.19–1.20 ppm with p (corr) = 0.45), Tyr (tyrosine) (signals 3.94–3.95 ppm, 6.88–6.91 ppm with p (corr) > 0.5 ; signal 7.17–7.18 ppm with p (corr) = 0.45), Phe (phenylalanine) (signal 7.34–7.37 ppm with p (corr) > 0.5 ; signal 7.40–7.44 ppm with p (corr) = 0.45) and His (histidine) (signal 7.07–7.09 ppm with p (corr) > 0.5) ; signal 7.91 ppm with p (corr) = 0.45) (box on the right of horizontal axis). HCC-NAFLD is characterized by increased level of Glu/Gln (glutamate/glutamine) (signal 2.11–2.17 ppm and 2.45 ppm with p (corr) > 0.5) (top box on the vertical axis). These metabolites had VIP (Variable Influence on the Projection) > 1. NI: Not Identified.
Taking together OPLS-DA models and SUS plots, comparing HCC-NAFLD and HCC-cirrhosis provide evidence that HCC-cirrhosis involve increased contribution of β-HB and aromatic amino acids (His, Tyr, Phe) and that HCC-NAFLD involve strong contribution of Gln/Glu.
Figure 4.Common and specific metabolites of HCC-cirrhosis and HCC-NAFLD revealed by SUS-plot. Shared and Unique Structures-Plot (SUS-Plot) of 2 models (shown in Figure3): model A (Orthogonal Partial Least Square-Discriminant Analysis (OPLS-DA) discriminated HCC-cirrhosis (HCC-CIR) from Cirrhosis (CIR), and model C (OPLS-DA discriminated HCC-NAFLD (HCC-NAF) from NAFLD (NAF). HCC-cirrhosis was characterized by increased level β-HB (β-hydroxybutyrate) (signal 1.18 ppm with p (corr) > 0.5 and signal 1.19–1.20 ppm with p (corr) = 0.45), Tyr (tyrosine) (signals 3.94–3.95 ppm, 6.88–6.91 ppm with p (corr) > 0.5 ; signal 7.17–7.18 ppm with p (corr) = 0.45), Phe (phenylalanine) (signal 7.34–7.37 ppm with p (corr) > 0.5 ; signal 7.40–7.44 ppm with p (corr) = 0.45) and His (histidine) (signal 7.07–7.09 ppm with p (corr) > 0.5) ; signal 7.91 ppm with p (corr) = 0.45) (box on the right of horizontal axis). HCC-NAFLD is characterized by increased level of Glu/Gln (glutamate/glutamine) (signal 2.11–2.17 ppm and 2.45 ppm with p (corr) > 0.5) (top box on the vertical axis). These metabolites had VIP (Variable Influence on the Projection) > 1. NI: Not Identified.
Taking together OPLS-DA models and SUS plots, comparing HCC-NAFLD and HCC-cirrhosis provide evidence that HCC-cirrhosis involve increased contribution of β-HB and aromatic amino acids (His, Tyr, Phe) and that HCC-NAFLD involve strong contribution of Gln/Glu.
Metabolites 2017, 7, 49 9 of 17
Metabolites 2017, 7, 48 9 of 17
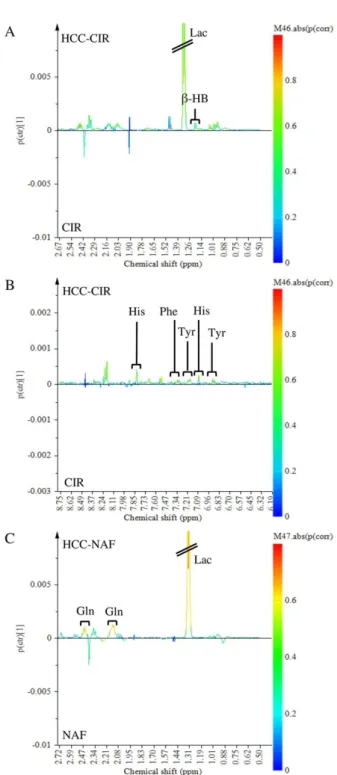
Figure 5. Focus on the loading S-line plot of Orthogonal Partial Least Square-Discriminant Analysis (DA) discriminated HCC-CIR from Cirrhosis tissue (CIR) (A,B) (focus on Figure 3B) and OPLS-DA discriminated HCC-NAF from NAFLD tissue (NAFLD) (C) (focus on Figure 3D): variations of bucket intensities are represented using a line plot with a color scale for correlation coefficient.
2.5. Glutamine Synthetase Immunostaining
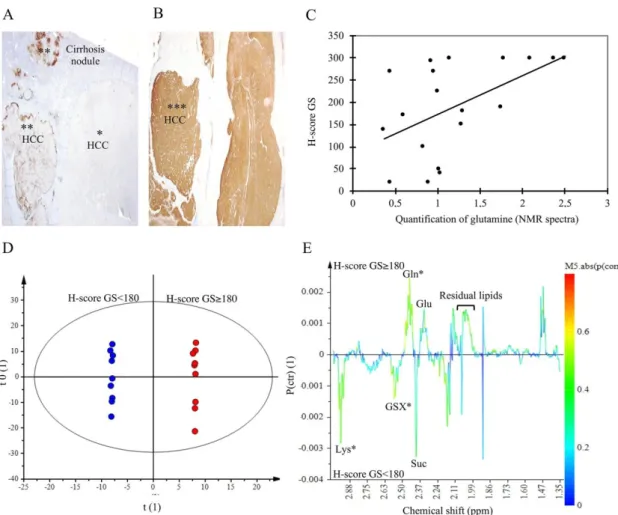
To validate the increase of Gln in HCC-NAFLD, we analyzed Glutamine Synthetase (GS) expression by immunohistochemical staining on tumor tissues. GS immunostaining was realized on HCC-NAFLD tissues (n = 11), and HCC-Cirrhosis (n = 7) (Figure 6A,B). Intense immunoreactivity, defined by a H-score ≥ 180, the median value, concerned mainly NAFLD (63%) versus HCC-Cirrhosis (28%). In addition, in HCC-NAFLD, 34% had a GS staining H-Score equal to 300. This observation is consistent with our metabolomics data, since Gln quantification was correlated with GS staining H-score (Figure 6C). OPLS-DA focusing on NMR spectra from 1.34 to 3 ppm shows a strong discrimination between HCC with a GS H-score ≥ 180 and HCC with a GS H-score < 180
Figure 5.Focus on the loading S-line plot of Orthogonal Partial Least Square-Discriminant Analysis (OPLS-DA) discriminated HCC-CIR from Cirrhosis tissue (CIR) (A,B) (focus on Figure3B) and OPLS-DA discriminated HCC-NAF from NAFLD tissue (NAFLD) (C) (focus on Figure3D): variations of bucket intensities are represented using a line plot with a color scale for correlation coefficient.
2.5. Glutamine Synthetase Immunostaining
To validate the increase of Gln in HCC-NAFLD, we analyzed Glutamine Synthetase (GS) expression by immunohistochemical staining on tumor tissues. GS immunostaining was realized on HCC-NAFLD tissues (n = 11), and HCC-Cirrhosis (n = 7) (Figure6A,B). Intense immunoreactivity, defined by a H-score ≥ 180, the median value, concerned mainly HCC-NAFLD (63%) versus HCC-Cirrhosis (28%). In addition, in HCC-NAFLD, 34% had a GS staining H-Score equal to 300. This observation is consistent with our metabolomics data, since Gln quantification was correlated with GS
staining H-score (Figure6C). OPLS-DA focusing on NMR spectra from 1.34 to 3 ppm shows a strong discrimination between HCC with a GS H-score≥180 and HCC with a GS H-score < 180 (Figure6E). Among signals contributing to the discrimination (p (corr) > 050), we identified and confirmed Gln (2.45 ppm) in HCC exhibiting a high GS staining whereas GSX (2.55 ppm) and lysine (2.96 ppm) were found in HCC with a weak GS staining (Figure6D). This data is consistent with the fact that lysine is a cetogenic amino acid involved in beta-oxydation of fatty acids; this metabolite might explain the overexpression of β-HB found in HCC developed on cirrhosis.
Metabolites 2017, 7, 48 10 of 17
(Figure 6E). Among signals contributing to the discrimination (p (corr) > 050), we identified and confirmed Gln (2.45 ppm) in HCC exhibiting a high GS staining whereas GSX (2.55 ppm) and lysine (2.96 ppm) were found in HCC with a weak GS staining (Figure 6D). This data is consistent with the fact that lysine is a cetogenic amino acid involved in beta-oxydation of fatty acids; this metabolite might explain the overexpression of β-HB found in HCC developed on cirrhosis.
Figure 6. Glutamine Synthetase immuno-staining and correlation with NMR data. (A,B) Immunohistochemical expression of glutamine synthetase (GS): diffuse and intense staining with H-score = 300 (***); focal staining (**) and negative (*). X10. (C) correlation between quantification of glutamine on 1H-NMR spectra and GS H-Score, correlation coefficient = 0.53, p = 0.009 (test of
Pearson). (D,E) Orthogonal Partial Least Square-Discriminant Analysis (OPLS-DA) score scatter plot and loading S-line plot of aqueous extract spectral data from 1.34 to 3 ppm of HCC with H-score < 180 (blue) versus HCC with H-score ≥ 180 (red). n = 18. The model was built with 1 predictive and 6 Y-orthogonal components and exhibited an explained variance: (R2X) of 0.69, (R2Y) of 1, predictability (Q2Y) of 0.79. The buckets are displayed according to the colored scale of correlation coefficient p (corr) (*: p (corr) > |0.5|).
However, we did not find a significant correlation between GS expression (H-score) and stage of differentiation (well or moderately) (R2 = 0.44, p-value = 0.070, Spearman test) (data not shown).
3. Discussion
3.1. Advantage and Limitation of Using Tissue Extract Instead of Intact Tissue in this NMR Metabolomics Study
We performed our metabolic analysis on tissue extracts. Some NMR-based metabolomic studies have used intact tissue and magic angle spinning techniques[14,15]. In these studies, both lipid and
Figure 6. Glutamine Synthetase immuno-staining and correlation with NMR data. (A,B) Immunohistochemical expression of glutamine synthetase (GS): diffuse and intense staining with H-score = 300 (***); focal staining (**) and negative (*). X10. (C) correlation between quantification of glutamine on1H-NMR spectra and GS H-Score, correlation coefficient = 0.53, p = 0.009 (test of Pearson). (D,E) Orthogonal Partial Least Square-Discriminant Analysis (OPLS-DA) score scatter plot and loading S-line plot of aqueous extract spectral data from 1.34 to 3 ppm of HCC with H-score < 180 (blue) versus HCC with H-score≥180 (red). n = 18. The model was built with 1 predictive and 6 Y-orthogonal components and exhibited an explained variance: (R2X) of 0.69, (R2Y) of 1, predictability (Q2Y) of 0.79. The buckets are displayed according to the colored scale of correlation coefficient p (corr) (*: p (corr) > |0.5|).
However, we did not find a significant correlation between GS expression (H-score) and stage of differentiation (well or moderately) (R2 = 0.44, p-value = 0.070, Spearman test) (data not shown).
Metabolites 2017, 7, 49 11 of 17
3. Discussion
3.1. Advantage and Limitation of Using Tissue Extract Instead of Intact Tissue in this NMR Metabolomics Study
We performed our metabolic analysis on tissue extracts. Some NMR-based metabolomic studies have used intact tissue and magic angle spinning techniques[14,15]. In these studies, both lipid and water-soluble metabolites can be obtained in the same spectrum, and spectra are suited for comparison with MR spectral imaging in vivo. In comparison, NMR analysis of tissue extracts requires sample processing, separate analysis of lipid and water-soluble extracts, but has the important advantage to have improved spectral resolution, thus allowing detect more metabolites, especially those with a low concentration including succinate, fumarate, histidine, uracil, NAD in water-soluble extracts, arachidonic acid, linoleic acid in lipid extracts. In this study, we privileged spectral resolution and the number of detectable metabolites.
3.2. HCC Metabolic Profile Involves High Glycolysis and Impaired Phospholipids Metabolism
Few studies have investigated the metabolome of human HCC tissue by NMR-spectroscopy. Most studies of HCC have used Mass Spectrometry [16–18]. Our metabolomics approach combined with multivariate analysis reveals up-regulated levels of Lac, PC, PE, Gln, and Val and down-regulated levels of Glc and MUFA in HCC tissue in comparison with corresponding NTT. High level of Lac with low level of Glc confirms the well-known glycolytic shift found in cancer tissues, including human and animal model of HCC [14,19,20]. This features the “Warburg effect”, where high lactate production is observed even in the presence of oxygen and a low level of aerobic oxidation through the TCA cycle [21]. As previously reported for human HCC tissue, our data showed a decrease of MUFA content and a modification of phospholipids metabolism with an increased level of phospholipid derivatives, suggested a need for synthesis of membranes [14,16].
3.3. Metabolomics Shows Differences between HCC-NAFLD and HCC-Cirrhosis
To our knowledge, this study is the first to investigate tissue metabolome of human HCC according to the underlying pathology including histologically proven NAFLD. In contrast to others tumors (prostate, esophagus, breast etc.), HCC has the particularity to develop on underlying disease such as cirrhosis or NAFLD. As a way to “remove” the impact of the underlying liver disease on the metabolic profile of HCC, a SUS-plot analysis was performed, which allows to highlight common and specific metabolites of two groups of HCC associated with cirrhosis or with non-cirrhotic NAFLD.
This approach has revealed specific metabolites for each HCC, as an increased level of β-HB and aromatic amino acids in HCC-Cirrhosis and overexpression of Gln/Glu in HCC-NAFLD.
β-HB constitutes 70% of ketone bodies and is produced by liver mitochondria from fatty acid oxidation. β-HB was also reported to be increased in an animal model of HCC tissue [22]. Aromatic amino acids, Phe and Tyr, are oxidized into the TCA cycle after conversion into fumarate. Therefore, their accumulation in HCC-cirrhosis may indicate the impairment of the TCA cycle. Phe and Tyr were also found increased in viral B HCC tissue [16] and in serum of cirrhotic patients versus healthy controls [10]. An imbalance with decreased levels of branched-chain amino acids (BCAAs) and increased levels of aromatic amino acids (Tyr, Phe) is commonly seen in plasma of patients with advanced cirrhosis [23]. A recent study reported an association between the ratio of serum BCAAs/aromatic amino acids and HCC risk [24]. In addition to β-HB, accumulation in aromatic amino acids levels suggests impairment of mitochondrial function and inflammatory status in HCC-cirrhosis.
In our cohort, the group of HCC on non-cirrhotic tissue mostly included NAFLD. In particular, there were as many HCC developed on steatosis without inflammatory damages than HCC developed on NASH. Alexander et al. studied a large cohort of 157 HCC patients with non-cirrhotic fatty liver disease and pointed out that only 15% of underlying tissue show steatohepatitis, raising the hypothesis that HCC in NAFLD may arise in the absence of histologically evident inflammation [25]. It becomes
necessary to identify metabolic specificities of HCC developed on NAFLD in absence of cirrhosis. The main result of this study is that HCC associated with non-cirrhotic NAFLD specifically exhibited a high level of Gln. This latter finding sustains the observations reported by Martinez-Granados et al., showing by tissue NMR that Gln levels were higher in non-cirrhotic tissue than in cirrhotic tissue [15]. In hepatocytes, Gln is implicated in ammonium detoxification, thus increased levels of Gln may reflect preservation of ammonium detoxification ability in non-cirrhotic tissue. Moreover, in tumor, Gln is a required substrate for biosynthesis and energy metabolism. Gln is a nitrogen donor for the de novo synthesis of both purines and pyrimidines, and is essential for production of nucleotides during cell proliferation. Oxidation of Gln carbon backbone in mitochondria is a major source of energy for proliferating cells, including tumor cell lines [26]. Gln is produced from Glu by glutamine synthetase (GS). The involvement of GS in liver tissue is wildly described associated with others (Glypican 3, heat shock protein 70) as biomarkers of hepatocellular tumors, particularly overexpressed in malignant tumors [27]. Indeed, Long et al., reported overexpression of GS in 70% of HCC versus 46.7% in cirrhosis and 38% in week fibrosis tissue, suggesting the role of GS in tumorigenesis and malignant progression [28]. Wasfy et al., also pointed out overexpression of GS in HCC and showed specificity and sensitivity of GS of 80% and 84% respectively [29]. The overexpression of GS is highly correlated with β-catenin mutation, and GS is proposed as a reliable marker of β-catenin activation secondary to its mutation [30]. Interestingly, low fibrosis was reported as an intriguing hallmark of β-catenin mutated tumors [30,31]. Our study is the first one to suggest a relationship between GS immunostaining and metabolic composition explored by NMR-spectroscopy. This observation might indicate the interest of the use in vivo of spectroscopy combined to MRI to detect hepatic lesions potentially β-catenin mutated. In our cohort, 63% of HCC-NAFLD has a diffuse GS immunostaining, among which 57% have a H-score equal to 300, versus 28% of HCC-cirrhosis. There are few histological data on GS labelling of HCC-NAFLD and actually, results from studies are conflicting [32,33].
4. Patients and Methods
4.1. Patients and Collection of Specimens
Liver tissue specimens were collected from 28 patients undergoing hepatectomy at the University Hospital of Clermont-Ferrand since November 2011 to May 2014 (n = 21) and from the tumor bank of the University Hospital of Saint-Etienne (n = 7). Written informed consent was obtained from each patient.
HCC was diagnosed before surgery using either radiological Barcelona criteria or liver biopsy histological analysis [34]. Diagnosis was established after surgery using pathological analysis. We did not include patients with a history of a second cancer for the last 2 years or who have received prior treatment for their HCC like chemoembolization. For each patient, tumor tissue (TT) and corresponding distant Non-Tumoral Tissue (NTT) (>2 cm) were collected. Specimen were transported in ice. The pathologists process to sampling on iced laboratory work plan. All tissue samples were snap frozen in liquid nitrogen to immediately “quench” metabolism, and stored at−80◦C until extraction to prevent metabolite destruction.
The study was approved by the Ethic Committee Sud-Est VI Clermont-Ferrand (Agreement number AU887, 04/03/2011).
4.2. Histology
Tissues were fixed in 10% formalin and embedded in paraffin for light microscopy. Paraffin sections with a thickness of 5 µm were stained with hematoxylin and eosin method. HCC type and grade of differentiation (WHO Classification) were established. NTT was characterized by the presence or not of lesions of chronic hepatitis, fibrosis, steatosis, steato-hepatitis and the METAVIR Score. Immunohistochemical analysis of Glutamine Synthetase (GS) was done according to standard procedures (Antibodies from BD Transduction Laboratories™, dilution at 1/400). To evaluate GS
Metabolites 2017, 7, 49 13 of 17
staining, a H-score (0–300) was calculated by multiplying staining intensity (0, negative; 1, weak; 2, moderate; 3, strong) with the positively stained area (0–100%) [32]. Immunohistochemical staining was performed on 24 samples (HCC-NAFLD n = 11, HCC-Cirrhosis n = 7, HCC-Normal n = 6). 4.3. Sample Preparation for NMR-Spectroscopy
Tissue samples were processed to obtain aqueous and lipid extracts. A piece of tissue (250 mg) was mixed with cold acetonitrile/water (1:1, v:v, 1.75 mL) and then homogenized, over ice, using a polytron. Samples were centrifuged (17,000 g, 20 min, 4◦C) and the aqueous supernatant was centrifuged (17,000 g , 15 min, 4◦C) twice and dried to obtain the water-soluble fraction of liver extracts. The organic phase was dissolved in cold chloroform/methanol (2:1, v:v, 1.5 mL), homogenized, centrifuged (17,000 g, 20 min, 4◦C), then, filtered and dried to obtain the lipid phase. All reagents are conserved at 4◦C and all experiments are conducted in ice. All dried samples were stored at−20◦C. 4.4.1H-NMR Spectroscopy
Spectroscopy was performed at room temperature using a Brucker Advance 400 spectrometer operating at 400.13 MHz. The dried extracts were rehydrated in 500 µL of D2O containing Phosphate Buffer (1%) (Aqueous extract) or 500 µL chloroform-d/methanol-d (2:1, v:v) (lipid extract) in 5 mm diameter NMR tubes. For all samples, a one-dimensional1H-NMR spectrum was acquired using a ZGPRESAT sequence with water signal suppression at low power and the following parameters: 8 µs
−90◦pulse length, 10 s relaxation delay, 10 ppm spectral width, 128 transients and 32 K complex data points. Resonance assignment was carried out according to chemical shift values reported in the literature [35] and the free access database Human Metabolome Database (HMDB). We performed 1H-1H COSY and1H-13C HSQC 2 dimensions NMR experiments in a few samples to definitely assign signals corresponding to phosphoethanolamine (PE) and succinate (Suc).
4.5. Data Processing
A line broadening factor of 0.3 Hz was applied to Free Induction Decay (FID) before Fourier transformation.1H-NMR spectra were manually corrected for phase and baseline using MestReNova (Mestrelab Research chemistry software solutions). Peak referencing was done on the signal of creatine at 3.035 ppm for aqueous extracts and phosphatidylcholine (Ptcho) at 3.26 ppm for lipid extracts. The spectra were binned into 0.02 ppm width data samples (from 0 to 9 ppm for the aqueous phase spectra and from 0.2 to 4.4 ppm for the lipid phase spectra), then normalized to the total area under spectrum, after removing spectral regions containing solvent (water, methanol, chloroform) resonances. 4.6. Metabolites Quantification
Metabolite signals were quantified in all tissue spectra. For quantitative metabolomics profiling, spectra were imported into MestReNova and assigned signals were integrated. Quantification was performed by relating metabolite signals to a residual protein signal (lysine at 2.99 ppm), according to a technique derived from [13]. The Wilcoxon test was used to compare NTT and tumour tissues. In the comparison of metabolites levels between the groups of HCC tissue, Kruskal–Wallis test with Dunn’s correction was used (XLSTAT.V 2014.5.02, Addinsoft).
4.7. Multivariate Data Analysis
Spectral data were imported from Excel into SIMCA (SIMCA 13.0 Umetrics, Sweden) and preprocessed using Unit Variance scaling. Unsupervised (Principal Components Analysis, PCA) and supervised multivariate statistical analysis were performed (SIMCA). An Orthogonal Projection to Latent Structure-Discriminant Analysis (OPLS-DA) was run to discriminate groups. The model performance was assessed by parameters R2X, R2Y, and Q2 related to the explained variance of data, the predicted variance and the 7-fold cross validated predicted variance, respectively. For each analysis,
a score plot is presented with the predictive (horizontal axis) and the first orthogonal component of the model (vertical axis). Each point in the score plot represented the projection of an NMR spectrum and thus a patient’s sample. The loading plot represented the covariance between the Y-response matrix and the signal intensity of the various spectral domains. The S-plot was used to visualize both the covariance (p (1)) and the correlation p (corr) (1) structure between the X-variables and the predictive score t (1). The S-line plot was applied to NMR spectral data. It visualized the p (ctr) (1) loading colored according to the absolute value of the correlation p (corr) (1). In addition, the difficulty to define a specific metabolic tissue profile of the HCC is due to the fact that HCC develop on a pre-existing pathologic liver having its own metabolic dysfunction. In this study, we proposed a multivariate statistic method (Shared and Unique Structure-plot), as a way to “remove” the underlying liver disease metabolic profile [36]. The SUS-plot consists in the projection of the scaled loadings p (corr) (1) from two OPLS models and visualizes the shared metabolic contribution along the diagonals, and the unique metabolic features along the respective axes, delineated by boxes in figures. Partial correlation coefficients (p (corr) (1))≥0.45 were considered significant.
5. Conclusions
Our metabolomics analysis allows to discriminate HCC associated with non-cirrhotic NAFLD from HCC associated with cirrhosis. These results should be considered as a preliminary study and these findings should be confirmed in a larger cohort. The observed unique metabolic alterations may be part of the specific carcinogenic processes in cirrhosis or non-cirrhotic NAFLD, and could be checked as candidate biomarkers of malignant transformation. These first results may be a draft of the metabolic background to epidemiological findings of non-cirrhotic NAFLD as a pre-cancerous liver disease.
Acknowledgments: This study was supported by the Program Cancéropôle Lyon Auvergne Rhône Alpes— Oncostarter “MECASTEN”.
Author Contributions:C.T., D.M., A.A. and A.D. conceived and designed the experiments; C.T., S.M., P.D., D.P., E.B., G.L., M.P., J.P. participated to patients’ inclusion, samples and data collection; C.T., D.M., A.-S.B., J.J.-Z., M.P. and A.D. performed the experiments; C.T., D.M., B.P., A.A. and A.D. analyzed and interpreted the data; C.T., D.M., A.A., M.-P.V. and A.D. wrote and corrected the paper; C.T. and A.D. edited the paper.
Conflicts of Interest:The authors declare no conflict of interest.
Abbreviations
Ace Acetate
AFP Alpha-Foeto-Protein Ara A Arachidonic Acid Asc A Ascorbic acid
BCAAs Branched-Chain Amino Acids BMI Body Mass Index
Beta-Glc β-glucose Cho Choline Creat Creatine
E Chol Esterified Cholesterol FID Free Induction Decay For Formate Fum Fumarate Gln Glutamine Glu Glutamate Gly Glycine GPC Glycerophosphocholine GS Glutamine Synthetase
Metabolites 2017, 7, 49 15 of 17
HBV Hepatitis B Virus
HCC Hepatocellular Carcinoma HCV Hepatitis C Virus
HDL High Density Lipoprotein His Histidine
HMDB Human Metabolome Database
H-NMR Hydrogen-Nuclear Magnetic Resonance
HR-MAS MR High Resolution Magic Angle Spinning Magnetic Resonance Lac Lactate
Leu Leucine Lin A Linoleic Acid
MUFA Monounsaturated Fatty Acid NAFLD Non-Alcoholic Fatty Liver Disease NASH Non-Alcoholic Steato-Hepatitis NTT Non Tumoral Tissue
OPLS-DA Orthogonal Partial Least Square-Discriminant Analysis PC Phosphocholine
PCA Principal Components Analysis PE Phosphoethanolamine
Phe Phenylalanine PLS Partial Least Square ppm part per million Ptcho phosphatidylcholine PUFA Polyunsaturated Fatty Acid Sar Sarcosine
SM Sphingomyelin Suc Succinate
SUS-Plot Shared and Unique Structures-Plot T Chol Total Cholesterol
T FA Total Fatty Acid TAG Triacylglycerol TCA cycle Citric Acid Cycle TNF tumor necrosis factor TT Tumor Tissue Tyr Tyrosine Val Valine
VIP Variable Influence on the Projection WHO World Health Organisation β-HB β-hydroxybutyrate
References
1. Ferlay, J.; Soerjomataram, I.; Dikshit, R.; Eser, S.; Mathers, C.; Rebelo, M.; Parkin, D.M.; Forman, D.; Bray, F. Cancer incidence and mortality worldwide: Sources, methods and major patterns in GLOBOCAN 2012. Int. J. Cancer 2015, 136, E359–E386. [CrossRef] [PubMed]
2. Sanyal, A.; Poklepovic, A.; Moyneur, E.; Barghout, V. Population-based risk factors and resource utilization for HCC: US perspective. Curr. Med. Res. Opin. 2010, 26, 2183–2191. [CrossRef] [PubMed]
3. Welzel, T.M.; Graubard, B.I.; Zeuzem, S.; El-Serag, H.B.; Davila, J.A.; McGlynn, K.A. Metabolic syndrome increases the risk of primary liver cancer in the United States: A study in the SEER-Medicare database. Hepatology 2011, 54, 463–471. [CrossRef] [PubMed]
4. Kim, C.H.; Younossi, Z.M. Nonalcoholic fatty liver disease: A manifestation of the metabolic syndrome. Cleve. Clin. J. Med. 2008, 75, 721–728. [CrossRef] [PubMed]
5. Paradis, V.; Zalinski, S.; Chelbi, E.; Guedj, N.; Degos, F.; Vilgrain, V.; Bedossa, P.; Belghiti, J. Hepatocellular carcinomas in patients with metabolic syndrome often develop without significant liver fibrosis: A pathological analysis. Hepatology 2009, 49, 851–859. [CrossRef] [PubMed]
6. Yasui, K.; Hashimoto, E.; Komorizono, Y.; Koike, K.; Arii, S.; Imai, Y.; Shima, T.; Kanbara, Y.; Saibara, T.; Mori, T.; et al. Characteristics of patients with nonalcoholic steatohepatitis who develop hepatocellular carcinoma. Clin. Gastroenterol. Hepatol. 2011, 9, 428–433. [CrossRef] [PubMed]
7. Piscaglia, F.; Svegliati-Baroni, G.; Barchetti, A.; Pecorelli, A.; Marinelli, S.; Tiribelli, C.; Bellentani, S. HCC-NAFLD Italian study group clinical patterns of hepatocellular carcinoma in nonalcoholic fatty liver disease: A multicenter prospective study. Hepatology 2016, 63, 827–838. [CrossRef] [PubMed]
8. Baffy, G.; Brunt, E.M.; Caldwell, S.H. Hepatocellular carcinoma in non-alcoholic fatty liver disease: An emerging menace. J. Hepatol. 2012, 56, 1384–1391. [CrossRef] [PubMed]
9. Stickel, F.; Hellerbrand, C. Non-alcoholic fatty liver disease as a risk factor for hepatocellular carcinoma: Mechanisms and implications. Gut 2010, 59, 1303–1307. [CrossRef] [PubMed]
10. Gao, H.; Lu, Q.; Liu, X.; Cong, H.; Zhao, L.; Wang, H.; Lin, D. Application of1H-NMR-based metabonomics in the study of metabolic profiling of human hepatocellular carcinoma and liver cirrhosis. Cancer Sci. 2009, 100, 782–785. [CrossRef] [PubMed]
11. Zhou, L.; Ding, L.; Yin, P.; Lu, X.; Wang, X.; Niu, J.; Gao, P.; Xu, G. Serum metabolic profiling study of hepatocellular carcinoma infected with hepatitis B or hepatitis C virus by using liquid chromatography-mass spectrometry. J. Proteome Res. 2012, 11, 5433–5442. [CrossRef] [PubMed]
12. Nahon, P.; Amathieu, R.; Triba, M.N.; Bouchemal, N.; Nault, J.-C.; Ziol, M.; Seror, O.; Dhonneur, G.; Trinchet, J.-C.; Beaugrand, M.; et al. Identification of serum proton NMR metabolomic fingerprints associated with hepatocellular carcinoma in patients with alcoholic cirrhosis. Clin. Cancer Res. 2012, 18, 6714–6722. [CrossRef] [PubMed]
13. Morvan, D.; Demidem, A. Metabolomics by proton nuclear magnetic resonance spectroscopy of the response to chloroethylnitrosourea reveals drug efficacy and tumor adaptive metabolic pathways. Cancer Res. 2007, 67, 2150–2159. [CrossRef] [PubMed]
14. Yang, Y.; Li, C.; Nie, X.; Feng, X.; Chen, W.; Yue, Y.; Tang, H.; Deng, F. Metabonomic studies of human hepatocellular carcinoma using high-resolution magic-angle spinning1H-NMR spectroscopy in conjunction with multivariate data analysis. J. Proteome Res. 2007, 6, 2605–2614. [CrossRef] [PubMed]
15. Martínez-Granados, B.; Morales, J.M.; Rodrigo, J.M.; Del Olmo, J.; Serra, M.A.; Ferrández, A.; Celda, B.; Monleón, D. Metabolic profile of chronic liver disease by NMR spectroscopy of human biopsies. Int. J. Mol. Med. 2011, 27, 111–117. [PubMed]
16. Huang, Q.; Tan, Y.; Yin, P.; Ye, G.; Gao, P.; Lu, X.; Wang, H.; Xu, G. Metabolic characterization of hepatocellular carcinoma using nontargeted tissue metabolomics. Cancer Res. 2013, 73, 4992–5002. [CrossRef] [PubMed] 17. Beyo ˘glu, D.; Imbeaud, S.; Maurhofer, O.; Bioulac-Sage, P.; Zucman-Rossi, J.; Dufour, J.-F.; Idle, J.R. Tissue
metabolomics of hepatocellular carcinoma: Tumor energy metabolism and the role of transcriptomic classification. Hepatol. 2013, 58, 229–238. [CrossRef] [PubMed]
18. Budhu, A.; Roessler, S.; Zhao, X.; Yu, Z.; Forgues, M.; Ji, J.; Karoly, E.; Qin, L.-X.; Ye, Q.-H.; Jia, H.-L.; et al. Integrated metabolite and gene expression profiles identify lipid biomarkers associated with progression of hepatocellular carcinoma and patient outcomes. Gastroenterology 2013, 144, 1066–1075. [CrossRef] [PubMed] 19. Paris, D.; Melck, D.; Stocchero, M.; D’Apolito, O.; Calemma, R.; Castello, G.; Izzo, F.; Palmieri, G.; Corso, G.; Motta, A. Monitoring liver alterations during hepatic tumorigenesis by NMR profiling and pattern recognition. Metabolomics 2010, 6, 405–416. [CrossRef]
20. Darpolor, M.M.; Yen, Y.-F.; Chua, M.-S.; Xing, L.; Clarke-Katzenberg, R.H.; Shi, W.; Mayer, D.; Josan, S.; Hurd, R.E.; Pfefferbaum, A.; et al. In vivo MRSI of hyperpolarized [1-13C]pyruvate metabolism in rat
hepatocellular carcinoma. NMR Biomed. 2011, 24, 506–513. [CrossRef] [PubMed]
21. Koppenol, W.H.; Bounds, P.L.; Dang, C.V. Otto Warburg’s contributions to current concepts of cancer metabolism. Nat. Rev. Cancer 2011, 11, 325–337. [CrossRef] [PubMed]
22. Wang, J.; Zhang, S.; Li, Z.; Yang, J.; Huang, C.; Liang, R.; Liu, Z.; Zhou, R.1H-NMR-based metabolomics of tumor tissue for the metabolic characterization of rat hepatocellular carcinoma formation and metastasis. Tumour Biol. J. 2011, 32, 223–231. [CrossRef] [PubMed]
23. Morgan, M.Y.; Milsom, J.P.; Sherlock, S. Plasma ratio of valine, leucine and isoleucine to phenylalanine and tyrosine in liver disease. Gut 1978, 19, 1068–1073. [CrossRef] [PubMed]
Metabolites 2017, 7, 49 17 of 17
24. Stepien, M.; Duarte-Salles, T.; Fedirko, V.; Floegel, A.; Barupal, D.K.; Rinaldi, S.; Achaintre, D.; Assi, N.; Tjønneland, A.; Overvad, K.; et al. Alteration of amino acid and biogenic amine metabolism in hepatobiliary cancers: Findings from a prospective cohort study. Int. J. Cancer 2016, 138, 348–360. [CrossRef] [PubMed] 25. Alexander, J.; Torbenson, M.; Wu, T.-T.; Yeh, M.M. Non-alcoholic fatty liver disease contributes to
hepatocarcinogenesis in non-cirrhotic liver: A clinical and pathological study. J. Gastroenterol. Hepatol. 2013, 28, 848–854. [CrossRef] [PubMed]
26. DeBerardinis, R.J.; Cheng, T. Q’s next: The diverse functions of glutamine in metabolism, cell biology and cancer. Oncogene 2009, 29, 313–324. [CrossRef] [PubMed]
27. Di Tommaso, L.; Roncalli, M. Tissue biomarkers in hepatocellular tumors: Which, when, and how. Front. Med. 2017, 4, 10. [CrossRef] [PubMed]
28. Long, J.; Wang, H.; Lang, Z.; Wang, T.; Long, M.; Wang, B. Expression level of glutamine synthetase is increased in hepatocellular carcinoma and liver tissue with cirrhosis and chronic hepatitis B. Hepatol. Int. 2011, 5, 698–706. [CrossRef] [PubMed]
29. Wasfy, R.E.; Shams Eldeen, A.A. Roles of combined glypican-3 and glutamine synthetase in differential diagnosis of hepatocellular lesions. Asian Pac. J. Cancer Prev. APJCP 2015, 16, 4769–4775. [CrossRef] [PubMed]
30. Cadoret, A.; Ovejero, C.; Terris, B.; Souil, E.; Lévy, L.; Lamers, W.H.; Kitajewski, J.; Kahn, A.; Perret, C. New targets of beta-catenin signaling in the liver are involved in the glutamine metabolism. Oncogene 2002, 21, 8293–8301. [CrossRef] [PubMed]
31. Zucman-Rossi, J.; Benhamouche, S.; Godard, C.; Boyault, S.; Grimber, G.; Balabaud, C.; Cunha, A.S.; Bioulac-Sage, P.; Perret, C. Differential effects of inactivated Axin1 and activated beta-catenin mutations in human hepatocellular carcinomas. Oncogene 2007, 26, 774–780. [CrossRef] [PubMed]
32. Ando, S.; Shibahara, J.; Hayashi, A.; Fukayama, M. β-catenin alteration is rare in hepatocellular carcinoma with steatohepatitic features: Immunohistochemical and mutational study. Virchows Arch. Int. J. Pathol. 2015, 467, 535–542. [CrossRef] [PubMed]
33. Calderaro, J.; Couchy, G.; Imbeaud, S.; Amaddeo, G.; Letouzé, E.; Blanc, J.-F.; Laurent, C.; Hajji, Y.; Azoulay, D.; Bioulac-Sage, P.; et al. Histological subtypes of hepatocellular carcinoma are related to gene mutations and molecular tumour classification. J. Hepatol. 2017, 64, 727–738. [CrossRef] [PubMed]
34. Bruix, J.; Sherman, M.; Llovet, J.M.; Beaugrand, M.; Lencioni, R.; Burroughs, A.K.; Christensen, E.; Pagliaro, L.; Colombo, M.; Rodés, J. Clinical management of hepatocellular carcinoma. Conclusions of the Barcelona-2000 EASL conference. European Association for the Study of the Liver. J. Hepatol. 2001, 35, 421–430. [CrossRef] 35. Fan, T.W.-M. Metabolite profiling by one- and two-dimensional NMR analysis of complex mixtures. Prog.
Nucl. Magn. Reson. Spectrosc. 1996, 28, 161–219. [CrossRef]
36. Wiklund, S.; Johansson, E.; Sjöström, L.; Mellerowicz, E.J.; Edlund, U.; Shockcor, J.P.; Gottfries, J.; Moritz, T.; Trygg, J. Visualization of GC/TOF-MS-based metabolomics data for identification of biochemically interesting compounds using OPLS class models. Anal. Chem. 2008, 80, 115–122. [CrossRef] [PubMed]
© 2017 by the authors. Licensee MDPI, Basel, Switzerland. This article is an open access article distributed under the terms and conditions of the Creative Commons Attribution (CC BY) license (http://creativecommons.org/licenses/by/4.0/).