HAL Id: halshs-01332053
https://halshs.archives-ouvertes.fr/halshs-01332053
Preprint submitted on 15 Jun 2016
HAL is a multi-disciplinary open access
archive for the deposit and dissemination of sci-entific research documents, whether they are pub-lished or not. The documents may come from teaching and research institutions in France or abroad, or from public or private research centers.
L’archive ouverte pluridisciplinaire HAL, est destinée au dépôt et à la diffusion de documents scientifiques de niveau recherche, publiés ou non, émanant des établissements d’enseignement et de recherche français ou étrangers, des laboratoires publics ou privés.
for Non-resource Tax Revenue and VAT’s Revenue
Jean-François Brun, Maïmouna Diakite
To cite this version:
Jean-François Brun, Maïmouna Diakite. Tax Potential and Tax Effort: An Empirical Estimation for Non-resource Tax Revenue and VAT’s Revenue. 2016. �halshs-01332053�
C E N T R E D'E T U D E S E T D E R E C H E R C H E S S U R L E D E V E L O P P E M E N T I N T E R N A T I O N A L
SÉRIE ÉTUDES ET DOCUMENTS
Tax Potential and Tax Effort: An Empirical Estimation for
Non-resource Tax Revenue and VAT’s Revenue
Jean-François Brun
Maïmouna Diakité
Études et Documents n° 10
June 2016
To cite this document:
Brun J.-F., Diakité M. (2016) “Tax Potential and Tax Effort: An Empirical Estimation for Non-resource Tax Revenue and VAT’s Revenue”, Études et Documents, n° 10, CERDI.
http://cerdi.org/production/show/id/1814/type_production_id/1
CERDI
65 BD. F. MITTERRAND
63000 CLERMONT FERRAND – FRANCE TEL.+33473177400
FAX +33473177428
2
The authors
Jean-François Brun Associate Professor
CERDI – Clermont Université, Université d’Auvergne, UMR CNRS 6587, 63009 Clermont-Ferrand, France.
E-mail: j-francois.brun@udamail.fr
Maïmouna Diakité
PhD Student in Economics
CERDI – Clermont Université, Université d’Auvergne, UMR CNRS 6587, 63009 Clermont-Ferrand, France and co-directorship University of Ottawa, Faculty of Social Sciences, School of International Development and Global Studies, 120 University (8005) Ottawa, ON K1N 6N5, Canada.
E-mail: maimouna.diakite@etu.udamail.fr
Corresponding author: Maïmouna Diakité
This work was supported by the LABEX IDGM+ (ANR-10-LABX-14-01) within the program “Investissements d’Avenir” operated by the French National Research Agency (ANR).
Études et Documents are available online at: http://www.cerdi.org/ed
Director of Publication: Vianney Dequiedt Editor: Catherine Araujo Bonjean
Publisher: Mariannick Cornec ISSN: 2114 - 7957
Disclaimer:
Études et Documents is a working papers series. Working Papers are not refereed, they constitute
research in progress. Responsibility for the contents and opinions expressed in the working papers rests solely with the authors. Comments and suggestions are welcome and should be addressed to the authors.
3
Abstract
Taxation is one of the main components of a country’s fiscal space. Its internal origin and the accountability it creates between rulers and populations make it a key element in financing public expenditure. Tax capacity differs between countries and depends on structural factors. A number of empirical studies attempted to determine countries’ overall tax potential and tax effort (Lotz and Morss, 1967; Stotsky and WoldeMariam, 1997; Fenochietto and Pessino, 2013). However, the methodologies used tend to underestimate or overestimate countries’ tax potential and thereby their tax effort. The purpose of this study is to better assess countries’ non-resource tax potential and VAT’s tax potential independently using a more appropriate method. It is in line with the study of Brun et al. (2014) and rests on a large sample of developing countries over the period 1980/2014. We first employ the previous models and discuss about their shortcomings, after we use the stochastic frontier model of Kumbhakar, Lien and Hardaker (2014). This model allows to disentangle the overall tax effort into a persistent tax effort due to policy economy decisions and a time-varying tax effort relating to tax administration efficiency. The results are more realistic. Low income countries have higher tax effort along the period even if their tax effort decline at the end of period on the opposite of resource depending countries. In fact, the latter characterized by lower tax effort compared to non-resource countries improved the efficiency of their system since 2010. The results also suggest that inefficiency in taxation depends more on policy decisions than on tax administration performance.
Keywords
Tax potential, Tax effort, Value-added tax, Non-resource revenues, Stochastic frontier model, Inefficiency.
JEL codes
Introduction
Resources allocation is a crucial function for a State. In fact, the public administration supplies some social infrastructures required for the welfare of population and contributing to the smooth running of economic activities in order to boost economic growth. Public ex-penditures concern education, health, roads, military exex-penditures, social security benefits, the supply of culture and sports infrastructures, operating expenditures, etc. These expen-ditures can be sorted according to their nature being more or less incompressible. One of the main resolutions adopted by the third international conference on financing for development is to mobilize resources for financing development post-2015 that requires to raise public resources such as tax revenues. " We commit to enhancing revenue administration through modernized, progressive tax systems, improved tax policy and more efficient tax collection. We will work to improve the fairness, transparency, efficiency and effectiveness of our tax systems, including by broadening the tax base and continuing efforts to integrate the in-formal sector into the in-formal economy in line with country circumstances"1. Nowadays, all
countries face important challenges concerning security and climate change which adds to the structural financing requirement.
The mobilization of tidy resources is needed to finance at least a significant proportion of these expenditures. Recourse to various aspects of fiscal space must be optimised (marginal costs of various components of fiscal space must be equalised) (Chambas et al. , 2006).
Taxation is one of the main components of countries fiscal space. Its origin internal and the accountability it creates between rulers and populations make it a key element in mo-bilizing public resources. For some countries such as Timor-Leste, the overall tax revenues represent more than fifteen percent to Gross Domestic Product(GDP)2. For the highest grants receivers, taxation is a protection against the tall revenues failing if the relationship with the donors worsens or if that one is being through an adverse economic conditions. Mobilize a suitable level of non-resource tax revenues consists to have a component of public resources remaining stable over time which will be less sensitive to the failings of commodity prices for resource depending countries.
Being aware of revenues-generating power of taxation, governments choose a combination of taxes allowing them to have an adequate level of revenues. We can distinguish between cor-porate income tax, personal income tax, value-added tax (VAT), accises, etc. Benevolent go-vernments try to make the least distortive combination while ensuring revenues. Value-added tax, to this extent is regarded as the least distortive tax which can generate a consequent amount of revenues. Its revenue-raising power justifies its choice by the majority of countries
1. Report of the third international conference on financing for development, Addis Ababa, 13-16 July 2015, Resolutions Adopted by the Conference, A/CONF.227/20, United Nations, New York 2015.
2. In 2010, Timor-Leste’s overall tax revenues to GDP represented more than eighteen percent to GDP and until now it represents more than sixteen percent to GDP.
which start a tax transition process.
Tax revenues level differs between countries. It is well known that the level of development is correlated with countries’ tax performance. Conforming to our analysis, over the period 2000/2014, emerging countries had an average non-resource tax ratio to GDP ratio of 15.83 compared to 10.31 for low income countries. But some low income countries such as Burundi3
raised more revenue ratio than a number of emerging countries. Governments tax according to their fiscal revenues forecasting or to achieve a goal set on by their regional institution of belonging4. However, the tax capacity is not the same for all countries and it depends on structural factors. Tax potential determined by taking into account structural factors must be the reference for governments revenue collection target as much as it regards countries characteristics to fix a level of revenues which can be generated. The amount of revenue collection will depend on tax effort brought by tax administrations under duress of tax policies elaborated by decisions takers. A number of empirical studies in cross section or panel data attempted to determine countries’ tax potential or tax effort (Lotz and Morss (1967), Bahl (1971), Stotsky and WoldeMariam (1997), Fenochietto and Pessino (2013), Brun, Chambas and Combes (2006). However, just a limited number of studies as that of Brun et al. (2014) focused on non-resource tax potential. Moreover, methodologies used tend to underestimate or overestimate countries’ tax potential and thereby their tax effort. The purpose of this study is to better assess countries’ non-resource tax potential and VAT’s tax potential independently using a more appropriate method. It is in line with the study of Brun et al. (2014) and rests on a large sample of developing countries over the period 1980/2014. We first employ the previous models and discuss their shortcomings next we use the stochastic frontier model of Kumbhakar, Lien and Hardaker (2014) which allows to disentangle the overall tax effort into a persistent tax effort due to policy economy decisions and a time-varying tax effort relating to tax administration efficiency. The results are more realistic compared to those obtained with the previous methodologies. Low income countries have higher tax effort along the period even if their tax effort declines at the end of period on the opposite of resource depending countries. In fact, the latter are characterized by lower tax effort compared to non-resource countries and improved importantly the efficiency of their system since 2010. The results also suggest that inefficiency in taxation depends more on policy decisions than on tax administration performance.
3. Burundi’s non-resource tax ratio to GDP over the period 2000/2014 was 15.36 percent to GDP. 4. To coordinating the setting of tax rates and bases for the major taxes through regional directives, WAEMU Treaty mandates the convergence of the tax revenues-to-GDP ratio to at least 17 percent, and the convergence of tax revenues structures. (Mansour and Rota-Graziosi, 2013).
1
The impact of natural resources on countries’ tax
effort : stylized facts
Natural resources for a state constitute an important source of public resources. It gene-rates an important rent usable to improve socio-economic conditions. In addition, resource depending countries apply taxes on their exports to recover a larger share of the rent. On the other hand, a vibrant mining sector dominated by a few large firms can generate large taxable surpluses (Gupta, 2007). By these channels, increasing revenues, the impact of na-tural resources on total revenues would be positive as obtained in the previous studies Bahl (1971), Chelliah et al. (1975), Tait et al. (1979). For Botlhole (2010) the nature of this rela-tion depends on the quality of institurela-tions. However, as Martinez Vazquez (2001), Lim (1988) said it, resource depending countries develop poor capacity to collect tax revenues. So, for these countries the link between natural resource revenues and non-resource tax revenues is in general negative. To test these assumptions empirically, we did two OLS linear regressions with our subsample of 31 resource depending countries. First, the overall tax revenues have been regressed on total natural resource rent and second it is the non-resource revenues that have been regressed on it. As shown by Figure 1, we found a positive impact for the overall tax revenues and a negative impact for non-resource revenues which confirm the idea that the resource depending countries provide less effort in term of revenue collection knowing that they rely on their natural endowment.
Figure 1 – Effect of resource revenues on tax collection
Afghanistan Algeria Angola Bolivia Botswana Cameroon Chad Congo, Rep. Gabon Guinea India Indonesia
Iran, Islamic Rep. MalaysiaMongoliaMauritania
Nigeria Papua New Guinea
Sudan
Syrian Arab Republic Timor−Leste Turkmenistan Venezuela, RB Vietnam Yemen, Rep. 0 10 20 30 40 50 Total Tax 0 20 40 60 Rent Afghanistan Algeria Angola Bolivia Botswana Cameroon Chad Congo, Rep. Gabon Guinea India Indonesia
Iran, Islamic Rep. Libya MalaysiaMauritania
Mexico Mongolia
Nigeria Papua New Guinea Peru
Sudan
Syrian Arab Republic Thailand Timor−Leste Turkmenistan Venezuela, RB Vietnam Yemen, Rep. 0 10 20 30 40 50 Non−resource Tax 0 20 40 60 Rent (Average 1980/2014)
Source: ICTD (2015), Mansour (2014); GFS (International Monetary Fund); WDI (World Bank); national data and authors’ calculations.
2
Toward a necessity to measure the efficiency of VAT
systems by the empirical tool
The generalisation of Value-added tax around the world5 is due to the important
reve-nues it creates and to its neutrality which is the main argument to justify the attention of the empirical research on this tax. The neutrality of VAT arises at the following levels : on
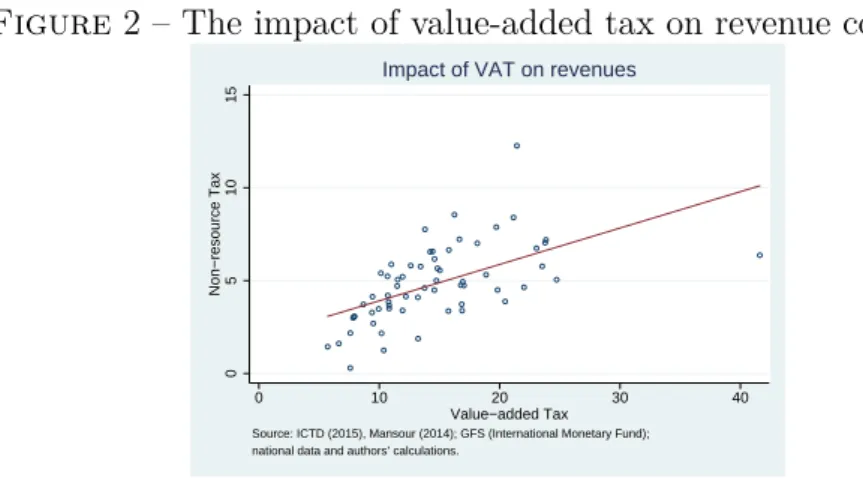
Figure 2 – The impact of value-added tax on revenue collection
0 5 10 15 Non−resource Tax 0 10 20 30 40 Value−added Tax Source: ICTD (2015), Mansour (2014); GFS (International Monetary Fund); national data and authors’ calculations.
Impact of VAT on revenues
the opposite of trade tax, VAT doesn’t create distortions by encouraging local production to the disfavour of imported goods. Similar goods are taxed at the same rate regardless to their origin, so focusing on VAT is a positive sign by which a country proves to its current and future trade partners, its trade openness commitment. VAT does not affect the competitive-ness of local producers insofar as exports are taxed to zero-rate thus, exporters can benefit from refund of the VAT charged on the production of exported goods. It doesn’t increase the company’s cost of production by the fact that they can deduct the VAT on their intermediate inputs of those they charge on the sell thereby, one can say that VAT is more favorable to the economic growth than the corporate income tax. Unlike some systems on sale tax VAT on a product, is neutral vis-a-vis the degree of integration of production i.e. the number of companies which contributed to its production6. The International Monetary Fund, kno-wing its ability to raise revenue, encourages countries to set on a VAT system in abandoning thereby their previous systems of sale tax. The reforms undertaken by tax authorities to run the VAT system or to improve its efficiency had a positive impact on all taxes collection. That explains its use, as a proxy of tax administration performance, in a number of empirical studies such as those of Aizenman and Jinjarak (2005), Ruhashyankiko and Stern (2006), Sancak, Velloso and Xing (2010). The regional institutions assign a key role to VAT in the context to harmonize their tax policies. The Commission of WAEMU has designated it as the main instrument of tax transition of its member states. The European Union financed some studies such as Reckon (2009) and Netherlands Bureau for Economic Policy Analysis (2013) in the purpose to evaluate the efficiency of European countries’ VAT systems. Moreo-ver, other multilateral institutions published some reports on countries’ VAT efficiency. Since
5. To this day, value-added tax has been introduced in more than 160 countries around the world. 6. Study of Brun and Diakité (2015) presented at the first African Tax Research Network annual congress.
2008, OECD, each two years, elaborates reports on its countries’ VAT systems. The IMF in 2010 and 2011 did two major publications on Value-added tax efficiency. Brun and Chambas (2010) conducted a study on the efficiency of VAT of some African countries under the aus-pices of the African Development Bank, Trigueros et al. (2012) for Latina America countries.
However, these studies used some indicators known to measure VAT efficiency which have some limitations. The main criticism that can be addressed to the efficiency ratio elabora-ted by Ebrill et al. (2001) is its fluctuation according to the share of consumption in GDP. In fact, one can remark that for two countries having similar VAT revenues and the same consumption data, this ratio will be more important for the country for which consumption share in GDP is higher. Concerning c-efficiency developed by the same authors, the use of aggregate data on final consumption for its determining causes some problems insofar as among these data are included the VAT paid on purchases by final consumers. For this rea-son, the OECD since 2008 deducts the VAT collected on consumption in order to determine the VAT Revenue Ratio (VRR) in the purpose to measure the VAT efficiency of its member states more adequately. Nevertheless, the VRR itself is not without contempt on the fact that for the interpretation of the ratio, one supposes that some changes in the tax system will not affect the level or the composition of consumption. This reproach can be direc-ted on all of the present indicators used the measure the VAT systems efficiency. Gemmel and Hasseldine (2012), concerning the VAT gaps indicators, point out the issue of reliabi-lity of the data employed to determine them and they advise to use these data with caution7.
So using empirical tools to measure VAT systems’ effort will allow to tax administrations to have an alternative indicator to appreciate their tax collection effort.
3
Literature review
A number of studies have been focused on measuring countries’ tax potential and tax effort. One can sort them into three categories according to the methodology used.
Early studies such as Bastable (1903), Clark (1945) assessed countries’ tax effort by ap-preciating the ratio tax revenues to income.
The study of Lotz and Morss (1967) attempted to provide a more robust indicator of countries’ tax effort. They are regarded as the precursors of the use of the least squares estimators in the assessment of the tax potential. By working on a large sample of deve-loping and developed countries, the authors used regression analysis and identified some determinants of governments’ tax capacity allowing to determine tax effort (difference bet-ween actual and predicted tax revenues). As Hinrichs (1965), they found that income and
trade openness are a robust determinants of a country’s tax capacity. The rank of countries according to their tax effort determined in previous studies changed with this methodology. Bahl (1971) developed tax effort’s indices for forty-nine developing countries covering the three years’ period 1966/1968. He regressed the ratio of tax revenues (excluding social se-curity taxes) to Gross National Product on the structural factors used by his predecessors and added agriculture share in GNP and resource revenues which have proven to be signi-ficant. He found that countries with higher mining share in GNP have the lowest tax effort indices and the existence of a regional bias in the tax effort ranking. Chelliah et al. (1975) determined countries’ tax efforts through the same variables as Bahl (1971) plus exports and they compared their evolution in reference to precedents IMF staff studies for forty-seven countries. They have not observed a significant change about countries tax effort ranking for the period 1969/1971. They remarked that countries with the highest tax ratio to GDP are those which have the highest tax efforts. Tait et al. (1979) have done the same study for the period 1972/1976. They also remarked no significant change in countries’ tax effort during this period. Stotsky and WoldeMariam (1997) developed tax effort measures for forty-three sub-Saharan African countries during the period 1990/1995. Their strategy rested on a panel data fixed effects estimator. The findings of the authors are similar to those of Bahl (1971) and Chelliah et al. (1975). Martinez-Vazquez (2001), in studying Mexican tax system, deter-mined tax efforts of 32 developing countries during the period 1990/1996. He obtained by a panel data regression that Mexico is among the bottom third countries in term of tax effort (ratio of actual to predicted tax revenues). Martinez-Vazquez (2007) remarked no significant improvement about Pakistan tax effort and he explained that by the large tax exemption and low tax compliance in Pakistan. Brun, Chambas and Combes (2006) assessed tax effort of a sample of eighty-five developing countries over the period 1980/2003 through a three years’ averages by sorting them according to their geographic area. A random effects esti-mator was used and they regarded net exports of mineral and oil as a robust determinant of countries’ tax potential. They found that tax effort of these developing countries decrea-sed during the period 2000/2003 compared to 1990/1994. Particularly, Latina-American and Asian countries are distinguished by a constant negative tax effort during all of the period. Bird, Martinez-Vazquez and Torgler (2008), Botlhole (2010) showed that a country’s tax effort may be influenced by its institutional factors such as corruption, voice and accounta-bility. Botlhole (2010) employed a GMM estimator and a IV2SL estimator to assess forty-six sub-Saharan African countries’ tax potential and tax effort. He found that African countries over the period 1990/2007 performed below their tax potential. Brun, Chambas and Man-sour (2014) developed non-reMan-source tax effort indices for a large sample of 124 developing countries over the period 1980/2012 by using a random effects estimator. For sub-Saharan African countries they found a decreasing in their tax effort until the early of 2000s during which, these countries improved their revenue mobilization due to the economic policy mea-sures that they introduced from the early 1990s. Latina American and Asian countries are distinguished by a constant decreasing tax effort along the period which however seems to
arise for Latina American on the opposite of Asian countries.
In the late 90s, some researchers have been interested in the stochastic frontiers models which were originally based on the measurement of the productivity of firms. Jha et al. (1999) attempted to determine the tax efficiency of fifteen major Indian states by a stochas-tic frontier model. They found that the poorest states have the highest tax efforts. Alfirman (2003) by employing the model of Aigner, Lovell, and Schmidt (1977) assessed tax potential of Indonesian local governments and found that they did not achieve their tax potential. Barros (2005), employed a Cobb Douglas cost frontier model to measure the efficiency of tax offices in Portugal and found that it varies between offices and along the period. Pes-sino and Fenochietto (2010) developed a tax stochastic frontier analysis to determine tax potentials and tax efforts for a sample of ninety-six countries (developing and developed) over a sixteen years’ period 1991/2006. They regarded tax effort as the ratio of actual to potential tax collection. They used three specifications i.e. the stochastic frontier models of Battese and Coelli (1992, 1995) estimated by the maximum likelihood method. They added to the traditional variables income inequality and public expenditures in education. They found that countries with higher levels of revenue (such as OECD countries) are near their tax capacity on the opposite of countries with lower level of revenue but there are some ex-ceptions like Singapore, Hong Kong among the high income countries and Namibia, Kenya among the low income countries. They explained the inefficiencies in countries’ tax collection by corruption and the percentage change of consumer price index. In a second publication in 2013, the authors employed the same strategy and a Mundlack random effects model to determine tax effort of an enlarged sample of 113 countries. Here, they did a distinction bet-ween 17 resource depending countries (where revenues from natural resources represented more than 30 percent of total tax revenues) for which they have just taken the non-resource tax revenues as dependant variable instead of the overall tax revenues taken for the 96 non-resource depending countries. The estimation of tax effort has been realized for each subsample independently. They found some large inefficiency parameters which are in an order of 2.8 for non-resource depending countries and 6.4 for resource depending countries. Overall, they found that the average tax effort of high income countries is higher compared to that of the other countries and it is higher for low income countries than for middle in-come countries. Cyan, Martinez Vazquez and Voluvic (2013) highlighted the economic logic beneath the concept of tax effort as defined in the previous studies and they try to link the tax effort to each country’s financing requirement. Their study rested on a sample of ninety-four countries over the period 1970/2009. They compared the two approaches used to determine countries’ tax effort (traditional regression approach by adding institutional factors and stochastic frontier approach in two steps) to a new approach consisting to de-termine countries tax effort conforming to their public expenditures8. They concluded by
8. The authors added to traditional variables, population variables as Bird, Martinez-Vazquez and Torgler (2008), education, inflation, Gini index, corruption as Pessino and Fenochietto (2010), grants, the lagged government debt, production of crude oil, a measure of tax system’s complexity, a globalization index, age
the fact that the level of public expenditure of a country may serve as an additional in-formative measure to quantify its tax effort. The study of Langford and Ohlenburg (2016) quantified the overall tax capacity for 85 non-resource rich countries covering a 27 years’ period by using the stochastic frontier model of Battese and Coelli (1995). They added to traditional variables mobilized to assess tax capacity the MIT’s economic complexity in-dex, ethnic tension and private sector credit. They found a wide variation in the estimated level of tax effort across the sample, on average the tax performance of the upper-middle and high income countries is higher than those of the low and lower-middle income countries.
About the value-added tax effort, to the best of our knowledge, there is no study which determines it independently by an empirical analysis. However, we must stress that there are some indicators communally used to appreciate countries’ VAT performance as mentioned below such as the efficiency and the c-efficiency ratios elaborated by Ebrill et al. (2001), the VAT Revenue Ratio proposed by OECD (2008), the VAT gaps indicators developed by Reckon (2009), Keen (2013) for European Union countries, Trigueros et al. (2012) for Latina American countries, Brun and Diakité (2015) for African countries.
A number of empirical studies attempted to explain VAT performance or misperformance. First, by using variables describing the rules of the tax system such as the tax standard rate, threshold, base (Ebrill et al., 2001, Agha and Haughton, 1996). The number of year since the introduction of VAT is equally regarded as a relevant indicator of the tax performance by these authors. Structural factors have been mobilized i.e. the national income, imports, exports or trade openness, agriculture value-added, population variables (dependency rate, urban share or population density), literacy, income inequality and a large number of po-licy economy factors among them inflation (Ebeke, 2008), business concentration and gross capital formation in a specific sector or its size, consumption of particular item (alcohol, petroleum in Keen and Lockwoods, 2006), costs of tax administration(Agha and Haugh-ton, 1996), output gap (IMF, 2015), lagged VAT efficiency indicator or total tax revenues (Bird and Martinez Vasquez, 2010). McCartney (2003 and 2006), Ruhashyankiko and Stern (2006), Christie and Holzner (2006) taken into account the impact of institutional factors like corruption, quality of legal or juridical system, a proxy of tax morale, the durability of policy system, a proxy for the wish for a fairer taxation on revenue mobilization. Overall, they found that the VAT performance is very different between countries and geographic areas. Developed countries and small islands have the best value-added tax performances on the opposite of sub-Saharan African countries. African countries, with comparable statutory VAT rates, have on average less VAT revenue per unit of aggregate private consumption, (Ruhashyankiko and Stern, 2006).
4
Empirical analysis
4.1
Variables and data
4.1.1 Choice of variables
Estimating a tax potential equation requires to mobilize some structural factors that can define a level of revenue that a country can collect. The purpose is to predict a maximum level of revenue that the country can generate taking into account its specific characteristics. In this sense, it is different from the tax performance which is related to its ability to collect tax. Thus, tax performance can be influenced by policy decisions in adopting tax laws, tax management, the level of education of tax collectors, tax morale, the quality of institutions (bureaucracy quality, corruption). So, it is by improving its performance that a country can attain its tax potential or tax capacity. To remain consistent with this viewpoint, the assess-ment of tax potential and thereby tax effort in this study rests just on structural variables viz the logarithm of GDP per capita. An important national income supposes a wide tax base. In addition, demand for public goods increases with the level of development (Wag-ner’s law), particularly because of social insurance requirements (Rodrik, 1999). The sign of its coefficient is expected to be positive.Agriculture value-added, subsistence agriculture, common in sub-Saharan African countries is informal. The majority of developing countries exempts the agriculture sector called " hard to tax ". A higher non-agriculture share in GDP should thus produce a higher tax ratio (Bird and Martinez Vasquez, 2008). The sign of its coefficient is expected to be negative. Openness, as said by Lotz and Morss (1967), taxable capacity also increases with the size of the foreign trade sector for two reasons : first, it is administratively easier to tax trade inflows and outflows than domestic transactions. Second, the " degree of openness "in many countries, especially in early stages of develop-ment indicates the relative importance of cash crops and subsistence agriculture. Moreover, greater trade openness favours increased productivity and steadier growth (Frankel, 1999).
Resource revenues to GDP, early studies such as Chelliah et al. , (1975) Tait et al. ,
(1979) found a positive impact of mining on taxation which can be explained by the taxation at export of oil and mining products often agriculture products. However, as Bahl (1971) found, countries with higher mining share to Gross National Product have the lowest tax effort indices. Moreover, the shocks engendered by non-renewable resources are likely to have a negative effect on tax revenues (Tanzi, 1981). The development of Dutch disease driven by the intensive use of revenues from mining can negatively affect other tradable sector tax bases, therefore leading to a further reduction in the domestic tax effort (Brun et al. , 2014). By using non-resource government revenues as a dependant variable we hope to find a nega-tive impact of resource revenues to GDP as Bornhorst et al. (2009), Ossowski and Gonzales (2012), Thomas and Trevino (2013), Civilly and Gupta (2014) and Brun et al. (2014).
The same variables have been used to assess VAT’s potential and effort knowing that they determine also VAT collection. This explains the use of these variables in the studies
concerning the value-added tax. GDP in Aizenman and Jinjarak (2005), Ruhashyankiko and Stern (2006), Openness in Ebrill et al. (2001), Keen and Lockwoods (2006) ; Agriculture value-added in Bird and Martinez Vasquez (2010). For the resource revenue to GDP, we did not find a study that uses this variable but in our opinion, it is relevant given that resource depending countries tend to overlook their non-resource tax collection and have lower VAT rates such as Nigeria with a rate of 5% in 2011 or grant important VAT exemptions. For instance, the share of exempted goods by the government of Gabon was 52.98% in 20119.
4.1.2 Data
Estimations are done with two unbalanced panels of 114 countries for the non-resource tax potential over the period 1980/2014 and 57 countries for the VAT potential over the period 1995/2014. There are 31 resource- depending countries (RDCs) in the first panel and 17 in the second. We defined as resource depending countries having resource tax greater or equal to 7% to GDP and/or countries having resource tax share to overall tax of 60% or more. According to the level of development, the first sample contains 30 Low Income Countries (LICs), 41 Lower Middle Income Countries (LMICs) and 43 Upper Middle Income Countries (UMICs)10. The second is respectively composed of 15 LICs, 19 LMICs and 23 UMICs. Data on the structural variables (GDP per Capita, Openness, Agriculture Share to GDP and Total natural resource rent) have been derived from the World Development Indi-cator database of the World Bank. Data on non-resource tax come from Mansour (2014) for Sub-Saharan-Africa countries and the rest coming from ICTD (2015), Government Finance Statistics(GFS) of the International Monetary Fund and national data ; Data on Value-added tax revenues are from the IMF’s GFS dataset. The average non-resource tax is 14.23% to GDP over the period, 15.32% for non-resource countries and 10.75% for resource depending countries. The average value-added tax per country ranges from 0.3% to 12.26% to GDP ; The minimum value is for Iran (a resource depending country) which adopted its VAT regime in 2008 and the maximum value for Moldova.
4.2
Estimation strategies
Like some previous studies, we estimated countries’ tax potential and effort using panel data regression. We first used a random effects estimator that we extended to a generalized two-stages least squares random-effects instrumental variables estimator (G2SLS-RE-IV) by instrumenting the GDP per capita which was lagged in the former estimations. Thereafter, for a better assessment of countries’ tax potential, we used stochastic tax frontier models. As a first step, we employed a reference model applied in a large number of empirical researches (including that of Pessino and Fenochietto 2010 and 2013), that of Battese and Coelli (1992). Then, we discussed the shortcomings of this model and the others used to predict countries
9. Brun and Diakité, (2015).
10. Countries are classified according to the 2014’s classification of the world’s economies by the World Bank.
tax potential, we explained the repercussions of their use on tax potential assessment. Finally, we presented and used the stochastic frontier model of Kumbhakar, Lien and Hardaker (2014) in its random effects form that we believe more pertinent. To the best of our knowledge, our study is the first to use this model to predict tax potential and we think that the obtained results are more realistic. All tax effort indices are predicted following the Jondrow et al. (1982) technique.
4.2.1 Regression by the random effects estimator
Working with panel data allows to take into account each country unobserved hetero-geneity that can be modelled deterministically (fixed-effects) or randomly (random effects). To predict tax potential, we preferred to include random effects because, as said by Brun et
al. 2014, fixed effects estimator assimilate the unobserved heterogeneity to structural factors
while random effects estimator assimilate only part of the unobserved heterogeneity to struc-tural factors thus, the results are more coherent. We define tax effort as the ratio between actual tax revenue and tax potential.
The econometric models are as follow :
— Equation of non-resource tax potential
logN RTit = β′Xit+ ϵit (1)
Xit = T N Rit; logGDPit−1; V AGit; Openit. (2)
Where logN RTit is the logarithm of non-resource tax revenues ; T N Rit is the total natural resource rent ; logGDPit−1 is the logarithm of lagged per capita GDP ; V AGit is the agriculture value-added to GDP ; Openitcorresponds to the sum of imports and exports in GDP percent and ϵit corresponds to the error term.
— Equation of value-added tax
logV ATit = β′Xit+ ϵit (3)
Xit = T N Rit; logGDPit−1; V AGit; Openit. (4)
Where logV ATit is the logarithm of value-added tax revenues.
4.2.2 Regression by the g2sls random effects instrumental variables estimator
As mentioned above, the level of development is favourable to tax revenues collection. However, tax revenues enter in the accounts in calculating the national income. Previous studies (Brun Chambas and Combes 2006, Brun Chambas and Mansour 2014), as in our first regressions, to address this endogeneity problem, used the lagged GDP per capita to treat the inverse-causality between tax revenues and income per capita. Here, we generalized
our random effects estimator to a G2SLS random effects instrumental variables estimator.
Botlhole (2010) as Ali and Isse (2006) used land area as instrument of income and jus-tified this choice by the fact that on average, large countries are often rich. But, we know that there are some LICs such as Niger, Mali having a large land area.
In this study, we used two instruments that we think more reliable : an indicator mea-suring the access to improved sanitation facilities which refers to the percentage of the population using improved sanitation facilities extracted from the World Bank development indicators dataset. The idea behind its use is that economic growth relies on productive hu-man capital in good health. As said by Audibert et al. (2012), health status is an important predictor of economic development. In boosting economic growth, it has a positive effect on tax revenues collection by increasing the taxable income. The second instrument that we employed is the rainfall11. In fact, agriculture is still predominant in developing countries,
in 2009, more than 25 percent of GDP was derived from agriculture in many least developed countries according to the Food and Agriculture Organization of the United Nations’ data. The agriculture sector viz subsistence-farm employs a large part of the workforce. Confor-ming to the same data, over 60 percent of the entire workforce, in sub-Saharan Africa are involved in agriculture. So, a poor rainfall affecting agricultural production tends to reduce the national income. Being aware that poor rainfall can at the same time reduce tax revenue by reducing the income of farmers, thereby their consumption of taxable items (knowing that their own production is generally exempted in developing countries and their activities are informal thus, they don’t report income for tax purposes), we lagged this variable to lessen this effect. The Sargan-Hansen statistic obtained is of 0.079 with a p-value of 0.7787 for the equation of non-resource tax potential and respectively 1.156 and a p-value 0.2824 for the equation of value-added tax. We can therefore state that at least one of our instrumental variables is exogenous.
4.2.3 Regression by the stochastic frontier models
The Stochastic frontier estimation methodology was first proposed by Aigner, Lovell & Schmidt (1977) and Meeusen & van den Broeck (1977). It was initially used for modelling production and technical efficiency of firms. A production function predicts a maximum le-vel of outputs that a firm can product given a lele-vel of inputs. As said by Kumbhakar et al. (2015), all production processes represent a transformation of inputs (for example, labor, capital, and raw material) into outputs (which can be either in physical units or services). A production function simply describes this transformation relationship as a "black box"’
11. This variable was employed to instrument the economic development (income per capita) by Brückner (2011) in a study consisting to measure the impact of economic growth and the size of the agricultural sector on the urbanization rate and by Guerineau and Sawadogo (2015) in analyzing the determinants of life insurance development. It has been derived from the National Aeronautics and Space Administration (NASA) Global Precipitation Climatology Project (GPCP) dataset.
which concerts inputs into outputs. The difference between the stochastic production and the other used in empirical research concerns the error term which in the former is divided in two or more parts. From an econometric point of view, the estimation of frontiers is interes-ting because the concept of maximality puts a bound on the dependent variable (or, in some models, at least on some component of the dependent variable) (Førsen, Lovell and Schmidt, 1980). Stochastic frontier models are estimated by the maximum likelihood method to panel data or by the corrected ordinary least squares to cross section data.
The first models proposed are time invariant technical inefficiency models developed by Pitt and Lee (1981), Schmidt and Sickles (1984) Battese and Coelli (1988).
The general specification of these models is as follow :
logYit = α + f (logXit; β) + ϵit (5)
ϵit = vit− ui (6)
logYit is the logarithm of revenue for firm i at time t (about taxation, tax revenues for country i in year t) ; logXit is the vector of inputs in logarithm (vector of structural factors which determine countries’ tax capacity) ; β is the associated vector of parame-ters to be estimated ; vit(t = 1...T ) corresponds to the two-sided random statistical noise ;
ui ≥ 0, (i = 1...N) is the one-sided inefficiency term, it is time-invariant and specific to each country and distributed independently of vit. The function is of transcendental logarithmic type.
The maximum likelihood uses the following assumptions in estimating the parameters :
ui ∼ N(0, σ2) (7)
vit∼ N(0, σ2v) (8)
Tax potential in these models is the ratio of tax performance (actual revenues) to technical efficiency predicted thereby tax effort corresponds to the technical efficiency.
1. Regressions by the stochastic frontier model of Battese and Coelli (1992) The time decay model of Battese and Coelli (1992) as those of Cornwell, Schmidt and Sickles (1990), Kumbhakar (1990),Lee-Schmidt (1993), is from the second generation of the stochastic frontier models. These models question the assumption done by the previous about the invariability of technical inefficiency. In fact, this means that coun-tries can’t improve their tax performance over time. Thus, a tax reform or changes in tax management would not have any practical effect on tax performance, which is unlikely. The time-varying model technical efficiency model of Battese and Coelli (1992) corrects this deficiency by allowing efficiency to change over time and
expo-nentially. It is a random effects type, so its use is consistent with our first regressions. The model takes the following form :
Yit = f (Xit; β)exp(vit− uit) (9)
uit = ηitui = exp[−η(t − T )]ui (10)
t∈ g(i); i = 1...N (11)
vit ∼ N(0, σv2) (12)
ui ∼ N(µ, σ2) (13)
When countries improve or know a decrease in their tax performance respectively (η ≥ 0, η ≤ 0) if it remains constant, η = 0. The parameters µ and σ2 define the
statistical properties of the country effects associated to the last time period (T) for which observations are available12. The efficiency term can be either half-normal
distributed or truncated normal distributed. The half normal distribution assumes that the mode in the distribution is zero (Pascoe et al. , 2003). The assumption underlying is that the proportion of tax administrations achieving their potential is the greatest. However, the truncated distribution which is more general, assumes that this proportion can vary. Here the mode in the distribution is positive.
2. Toward a better assessment of the tax potential : regressions by the
sto-chastic frontier model of Kumbhakar, Lien and Hardaker (2014) in its random effects form
The panel data model of Battese and Coelli (1992) is somewhat restrictive because it only allows inefficiency to change over time and exponentially. Furthermore, this model mix firm effects to inefficiency (Kumbhakar et al. 2014). Greene (2005), Wang and Ho (2010) proposed some models which allow to separate individual heteroge-neity. However, none of the above models distinguish between persistent and time-varying efficiency13. Identifying the magnitude of persistent inefficiency is important, especially in short panels, because it reflects the effects of inputs like management (Mundlak, 1961) as well as other unobserved inputs which vary across firms but not over time14. The advantage of the stochastic frontier model of Kumbhakar, Lien and
Hardaker (2014) is that in addition to consider countries heterogeneity apart from their technical efficiency, it does a distinction between their time-varying and per-sistent inefficiency. In other words, it divides the error term into four components : random countries effects which capture time invariant unobserved variables (omitted
12. Battese and Coelli (1995) developed a model in which countries’ technical inefficiency depends on exogenous factors. To comply with our definition of tax potential, we decided to not use this model by take into account the inefficiencies variables which for us impact rather countries’ tax performance than their tax potential
13. The model of Kumbhakar and Hesmati (1995) done this distinction but not take into account the country effects.
structural factors) ; countries’ heterogeneity knowing that they differ in culture, tax morale ; persistent technical efficiency relating to tax laws, the form of organisation of inland revenue services (for instance dividing it into the division of major enter-prises, the small and medium-sized enterprises department and municipalities tax administrations) and remains constant unless there is a tax reform or a changes in organisation that affect the management style ; and time-varying efficiency such as the experience of tax officers, their performance. Thus, we can assess at the same time the tax effort due to the policy decisions and this due to tax administration performance and the overall tax effort which is the product of the first two. This has an important policy involvement by the fact that if the persistent inefficiency component is large it means that the increasing of tax effort requires a change in tax laws or a change in organisation and an important residual inefficiency is a wake-up call for tax admi-nistration to improve its performance and be more vigilant about tax evasion. This may lead to deeper issues like administrative corruption. Furthermore, by this metho-dology we can assess tax effort of countries according to the tax performance of the top 10 percentile (most efficient countries) and median that will allow us to mitigate the existence of outliers in our sample that conduct in high estimates of tax potential.
The model is of the form :
Yit= α + f (Xit; β) + θi+ vit− ηi− λit (14)
θi is the random country effects ; vit is the country’s latent heterogeneity ; ηi is the persistent inefficiency ; λit corresponds to the short run varying inefficiency.
The model is estimated in three steps. It can be rewritten as :
Yit = α∗f (Xit; β) + ωi+ ϵit (15)
Where :
α∗ = α− E(ηi)− E(λit); (16)
ωi = θi− ηi+ E(ηi); (17)
ϵit = vit− λit+ E(λit). (18)
ωi and ϵit have constant variance and zero mean.
Step 1 : (β) is estimated by the standard random effects estimator that corresponds to our first regression in this study. Thereby we obtained the predicted values of ϵit ( ˆϵit) and ωi ( ˆωi).
ϵit and ( ˆϵit). λit ∼ N+(0, σ2) and vit ∼ N(0, σv2) so E(λit) =
√
2
πσ. We estimate the equality (18) by stochastic frontier technique, thus we obtain ˆλit. Time-varying Tax effort = −λit.
In Step 3, ηi is estimated following a similar procedure as in Step 2, by assuming
ηi ∼ N+(0, σ2η). E(ηi) =
√
2
πση and θi ∼ N
(0, σ2
θ) so here we estimate the equality (17) and obtain ( ˆηi).
Persistent Tax Effort = exp(−ηi). ˆ
ηi and ˆλit are the Jondrow et al. (1982) estimators of ηi and λit. Overall tax effort = Persistent Tax Effort*Time-varying Tax effort
5
Empirical findings
5.1
Results of estimates through the random effects and the
g2sls-random effects instrumental variables models
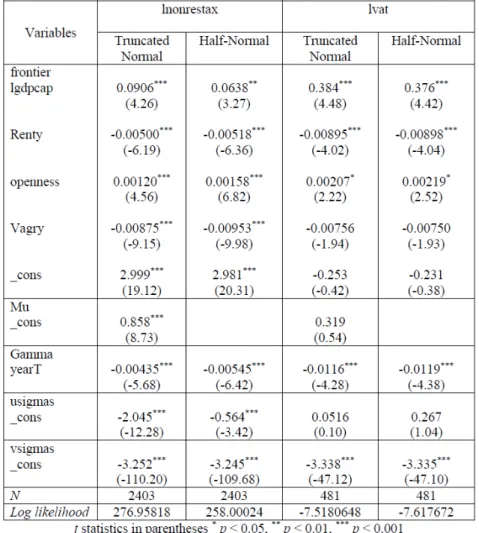
With the random effects estimator, for the non-resource tax equation, all of the coeffi-cients are significant and their signs are consistent with those presumed (as shown in the Table 1, below) which means that economic growth and openness increase the potential re-venues to be collected by a nation. On the opposite, a large natural resource rere-venues and share of agriculture value-added are unfavourable to the non-resource tax collection. The significance of coefficients and their signs are the same in the G2SLS random effects instru-mental variables estimation. As said above, the p-value associated to the Sargan statistic is sufficiently high to confirm the assumption that at least one of our instruments is valid. Concerning the value-added tax equation, for the two first estimations, the coefficients are also statistically significant except for that of agriculture value-added in the G2SLS- random effects estimation. The statistic of Sargan-Hansen is also significant even if it is higher than that of the non-resource tax equation.
The non-resource tax potentials predicted with the random effects estimator and the G2SLS-RE-IV estimator are available in Table 1015. The potential predicted with the two
models are similar even if those predicted with the G2SLS-RE-IV estimator are lower. With the random effects model, they range from 27.58 in GDP percent for Seychelles (a non-resource country) to 14.01 for Bolivia (a non-resource depending country), in 2012, with a res-pectively tax efforts of 102.97 and 152.30. This means that Bolivia in 2012 collected more than 150 percent of its tax potential. Results for the other countries tend also to affirm that all of the countries in the sample are near or exceed their potential16. The tax effort
15. In order to provide a readable angle in the Table 10, we present the results for the tax potential and tax effort for the last year period for that information are available.Results for the other estimations are available in the tables below that one and are presented in the same way.
Table 1 – Random effects and G2SLS-RE-IV estimations’ results
levels are similar for the value-added tax. In fact, the predicted tax effort accounted for up to 283.71 for Moldova in 2011. If the random effects estimator is preferable to that of fixed effects to predict tax potential, compared to stochastic frontier models, it doesn’t give the maximum level of revenue (the frontier) that can be collected, thereby, the tax effort predic-ted is overestimapredic-ted. We must stress that this effect is amplified if the sample is constitupredic-ted by countries having similar characteristics, the reference standard being provided by the average behaviour of the whole panel.
5.2
Results of estimates by the half normal and the truncated
normal stochastic frontier models of Battese and Coelli (1992)
By a maximum likelihood estimation of the parameters, we obtained a statistical signifi-cance for all of the coefficients except for the agriculture value-added in the two value-added tax equations.The coefficients of yearT in the gamma function are significant which implies that (for the first specification) countries’ non-resource tax inefficiency decreased along the period this means that they knew an increasing in the effort about 0.43% per year. In the Value-added tax potential truncated normal equation, Mu (The pretruncation mean of the distribution of the inefficiency) is not significant and the log likelihoods are quite similar in the two estimations which means that truncated normal model is not preferred to the half normal model.model allows efficiency to change exponentially. Thereby, the tax potential of a low income country such as Burkina Faso is 25.31 (half normal model) or more 30.50 in GDP percent (truncated normal model) in 2010. These estimations are excessive, given that a developed country like France, moreover known for the efficiency or its tax administration collected 25.46 as the ratio of non-resource tax to GDP the same year. If the VAT potentials predicted are better, however same case occurs with a number of countries like Botswana for which the VAT potentials are respectively with the two models 26.62 and 25.80 to GDP.17
Table 2 – Results of estimations by the time decay model of Battese and Coelli (1992)
5.3
Results of estimates by the model of Kumbhakar, Lien and
Hardaker (2014)
As mentioned above, the tax effort from this model is predicted by following a procedure in three steps and the first corresponds to the standard random effects estimation. Having presented the results of this estimation in Table 1 here we will comment directly the results of the Step 2.
17. The pretruncation means of the distribution of the inefficiency terms are some constants. usigmas and vsigmas are the variance parameters in the table below.
Estimates of the error components from the random effects models by the stochastic fron-tier method, allow us to obtain the time-varying tax effort. By dividing countries according to the level of development, we remark that on average, over the last five years (2010/2014), the time-varying tax effort of the low income countries (92.67) was higher than that of the lower middle income countries (87.95) and that of the upper middle income countries (87.87). For the VAT time-varying effort, there is no significant difference between the average tax effort of the UMICs (88.85) and that of the LICs (88.59). This of the LMICs is 86.76.
Table 3 – Estimation of the error component to predict the time-varying tax effort
By estimating the random effects components also with the stochastic tax frontier me-thod, we obtained the persistent tax efforts. They are significantly lower than the time-varying tax efforts especially those of the value-added tax. These results are consistent with the findings of the study of Brun and Diakité (2015) on sub-Saharan African countries, according to which for these countries, tax gaps depend more on policy decisions (laws, or-ganization) than tax officers’ performance. The figures on the average time-varying and the persistent tax efforts are in the Table 5 below.
Table 4 – Estimation of the random effects component to predict the persistent tax effort
Table 5 – Average persistent and time-varying non-resource tax efforts by income group
product of its two components (persistent and time-varying tax efforts)18. The average non-resource tax effort of the LICs was the highest in the early 1980s, it has declining subsequently and has re-reached its former level in the 2000s characterized by important changes in tax management to run or improve VAT systems. Moreover, one can observe that even if the average non-resource tax effort of these countries failed at the end of the period that of VAT continues to rise. the LMICs and the UMICs are also characterized by important tax efforts which have not however regular trends. If the tax efforts of the non-resource countries (NRCs) are higher than those of the RDCs, the latter demonstrated a willingness to improve the efficiency of their tax system at the end of the period, even if there is much work to be done namely about the value-added tax. As shown by the non-resource tax and VAT efforts’ maps (Figure 7 and Figure 8), we don’t observe a regional homogeneity in term of tax efforts except for the value-added tax effort in WAEMU area which shows an efficiency particularly high.
The tax potentials obtained by this model which allows to disentangle countries’ hete-rogeneity and their tax effort seem much more consistent whether it is for the non-resource tax or VAT. The differences in efficiency have not affected tax effort indices and thereby countries’ tax potentials, as shown by the Figure 3 and the Figure 4 below, there is not an important difference between these tax potentials and those predicted by the median which allows to mitigate the existence of outliers in the sample.
18. Figure 5 and Figure 6 in the appendix show the evolution of the three categories of tax efforts over the period and per income group for the non-resource tax and value-added tax.
Table 6 – Non-resource tax efforts along the period by income group
Figure 3 – Non-resource tax’s potential predicted by the model of Kumbhakar et al. (2014) 20 25 30 35 Tax Potential 1980 1985 1990 1995 2000 2005 2010 2015 Year
Kumbhakar et al. (2014) Top 10 Percentile Median
Source: ICTD (2015), Mansour (2014); GFS (International Monetary Fund); WDI (World Bank); national data and authors’ calculations.
Non−resource Tax Potential by Kumbhakar et al.(2014)model
Figure 4 – Figure 4 : VAT’s potential predicted by the model of Kumbhakar et al. (2014)
5 10 15 20 25 VAT Potential 1995 2000 2005 2010 2015 Year
Kumbhakar et al. (2014) Top 10 Percentile Median
Source: GFS (International Monetary Fund); WDI (World Bank) and authors’ calculations.
Conclusion and recommendations
This study intended to provide more consistent non-resource tax and VAT efforts and potentials for a large sample of developing countries. This required to go through the pre-vious methodologies, discuss their shortcomings to go toward a more relevant model with more realistic and robust predictions. The stochastic frontier model of Kumbhakar, Lien and Hardaker (2014) besides the benefits it provides in term of giving a maximal tax potential that a country can reach by improving its tax effort allows to disentangle the effort between a persistent tax effort due to the policy decisions and a time-varying tax effort relating to tax officer’s performance. Hence, the sources of inefficiency being known, it is easier for countries to make appropriate decisions to improve their tax performance.
Our findings prove that a large number of developing countries make efforts to collect taxes even if there are possible improvements namely regarding value-added tax collection. The LICs characterised by important tax efforts along the period, showed a decline in their performance at the end of the period on the opposite of the resource-depending countries (which are generally emerging countries) that enhanced efficiency of their tax system. It proves that these countries are willing to increase a more stable component of their fiscal space which goes to their advantage when looking at the fiscal problems faced by most of them to this day, what drives some countries to call on additional foreign fund to finance their economies.
Furthermore, we must stress that the top performing countries, in terms of tax effort, should instead stabilize their tax revenues. Their actions can be oriented toward a reduction of the distortions introduced by taxation and to increase the performance of tax adminis-tration by modernization, acquiring more technical resource to fight tax evasion notably transnational than to increase the tax burden.
References
Agha A. and Haughton J., (1996), "Designing VAT systems : some efficiency considera-tions", The Review of Economics and Statistics 78, No.2, pp. 303-308.
Aigner D.J., Lovell C.A.K., Schmidt P., (1977), "Formulation and estimation of stochas-tic frontier production function models.", J Econ 6 :21-37.
Aizenman J. and Jinjarak Y., (2005), "The Collection Efficiency of the Value Added Tax : Theory and International Evidence", NBER Working Paper No. 11539, Programs ITI PE.
Alfirman L., (2003), "Estimating Stochastic Frontier Tax Potential : Can Indonesian Lo-cal Governments Increase Tax Revenues Under Decentralization ?", Center for Economic
Analysis Working Paper No. 03-19, Department of Economics, University of Colorado at
Boulder, Colorado 80309.
Ali A. and Isse H.S., (2006), "An Empirical Analysis of the Determinants of Foreign Aid : A Panel Approach", International Advances in Economic Research, 12, pp. 241-250.
Audibert M., Combes P.M., Drabo A., (2012), "Global burden of disease and economic growth." 2012.12. halshs-00678713’
Bahl R. W., (1971), "A Regression Approach to Tax Effort and Tax Ratio Analysis", IMF
Staff Papers,18, pp. 570-612.
Barros C. P., (2005), "Performance measurement in tax offices with a stochastic frontier model", Journal of Economic Studies, Vol. 32 pp. 497 - 510 Permanent link to this docu-ment : http ://dx.doi.org/10.1108/01443580510631388 Downloaded on : 18 April 2016, At : 00 :56 (PT).
Bastable C. F., (1903), "Public Finance and Changes in the Value of Money", Public Finance, 3rd ed. (London, 1903), pp. 136-37 ; Colin Clark, The Economic Journal, Vol. LV (1945), pp. 371-89 ; Colin Clark, Taxmanship : Principles and Proposals for the Reform of Taxation, Institute of Economic Affairs, Hobart Paper No. 26 (London, 1964).
Battese G. E., Coelli T.J., (1995), "A model for technical inefficiency effects in a stochas-tic frontier production function for panel data" Empirical Econ 20 :325-332.
Battese G. E., Coelli T. J., (1992), "Frontier production functions, technical efficiency and panel data : with application to paddy farmers in India", J Prod Anal 3, pp. 153-169.
Battese G. E., Coelli T. J. (1988), "Prediction of firm-level technical efficiencies with a generalized frontier production function and panel data", J Econ, 38, pp. 387-399.
Bird R. M. and Martinez-Vasquez J., (2010), "Value Added Tax : Onward and Upward ?", available from : http : //eduart0.tripod.com/sitebuildercontent/sitebuilderf iles
/vatonwardandupward.pdf accessed on 20 February 2015.
Bird R. M., Martinez-Vazquez J. and Torgler B., (2008), "Tax Effort in Developing Coun-tries and High-Income CounCoun-tries : The Impact of Corruption, Voice and Accountability",
Economic Analysis and Policy, Vol. 38, pp. 55-71.
Bornhorst, F., Gupta, S. and Thornton, J., (2009), "Natural Resource Endowments and the Domestic Revenue Effort", European Journal of Policy Economy, 25 : 439-446.
Botlhole T. D., (2010), "Tax effort and the determinant of tax ratio in Sub-Sahara Africa", International Conference on Applied Economics- ICOAE 2010.
Brückner, M., (2011), "Economic Growth, Size of the Agricultural Sector, and Urbaniza-tion", Research Paper No. 2011-16, University of Adelaide, School of Economics.
Brun J. F. and Diakité M., (2015), "Vers un diagnostic approfondi de l’efficacité des systèmes de TVA des pays en développement", version presented at the first African Tax Research Network Annual Congress.
Brun J. F., Chambas G. and Mansour M., (2014), "Tax Effort of Developing Countries : An Alternative Measure", in Financing sustainable development by addressing vulnerabilities, M. Boussichas and P. Guillaumont edited by Economica, Paris.
Brun J. F., Chambas G., (2010), "Sénégal : Évaluation du potentiel de recettes publiques", African Development Bank.
Brun J.F., Chambas G. and Combes J.L., (2005), "La réduction des inégalités pour une meilleure mobilisation fiscale", in Afrique au Sud du Sahara : Mobiliser des ressources fiscales
pour le développement, Economica, Chambas G. (dir.), Chapitre 2, pp. 21-38.
Center for Social and Economic Research, Netherlands Bureau for Economic Policy Ana-lysis, (2013), Study to Quantify and Analyze the VAT Gap in the EU-27 Member States, Final Report, TAXUD/2012/DE/316, FWC No. TAXUD/2010/CC/104.
Chambas G., Brun J. F., Combes J. L. et al. , (2006), "Evaluation de l’espace budgétaire des pays en développement, Document conceptuel", PNUD, New-York.
Chelliah, R. J., Baas, H. J. and Kelly, M. R., (1975), "Tax Ratios and Tax Effort in Developing Countries", IMF Staff Papers, 2 (1) : 187-205.
Crivelli, E. and Gupta, S., (2014), "Resource Blessing, Revenue Curse ? Domestic Reve-nue Effort in Resource-Rich Countries", European Journal of Policy Economy, 35 : 88-101.
Cornwell C., Schmidt P. and Sickles R. C., (1990), "Production Frontiers with Cross-Sectional and Time-Series Variation in Efficiency Levels", Journal of Econometrics, 46, pp. 185-200.
Cyan M., Martinez-Vasquez J. and Vulovic V., (2013), "Measuring tax effort : Does the estimation approach matter and should effort be linked to expenditure goals ?", International
Center for Public Policy Working Paper 13-08, Georgia State University.
Ebéké C., (2010), "Remittances, Value added tax and tax revenue in developing coun-tries", CERDI Working Paper 2010.30, Centre d’Etudes et de Recherches sur le Développe-ment International, Université d’Auvergne. Available at ’http ://www.cerdi.org/uploads/ed/2010
/2010.30.pdf’.
Ebrill L., Bodin J. P., Keen M. and Summers V., (2001), The Modern VAT, International Monetary Fund, Washington, DC.
International Monetary Fund, (2015), "Current challenges in revenue mobilization : im-proving tax compliance", Staff Report, International Monetary Fund Washington, D.C.
Førsund F.R., Lovell C.A.K., Schmidt P., (1980), "A survey of frontier production func-tions and their relafunc-tionship to efficiency measurement", Journal of Econometrics, 13, pp. 5-25.
Gemmel N. and Hasseldine J., (2012), "The tax gap : A methodological review", Working
Paper in Public Finance 09/2012, University of Wellington.
Greene W., (2005), "Fixed and random effects in stochastic frontier models", J Prod Anal, 23, pp. 7-32.
Guerineau S. and Sawadogo R., (2015), "On the determinants of life insurance develop-ment in Sub-Saharan Africa : the role of the institutions quality in the effect of economic
deve-lopment", Etudes et Documents CERDI num. 19, available at http : //cerdi.org/production/show/id
/1717/typeproductionid/1.
Gupta A. S., (2007), "Determinants of Tax Revenue Efforts in Developing Countries",
IMF Working Paper 07/184, Washington DC : International Monetary Fund.
Hinrichs H., (1965), "Determinants of Government Revenue Share among Less Developed Countries", Economic Journal, 75, pp. 546-56.
International Monetary Fund, (2011), Revenue Mobilization in developing Countries, IMF, Fiscal Affairs Department.
International Monetary Fund, (2010), From Stimulus to Consolidation : Revenue and Ex-penditure Policies in Advanced and Emerging Economies, Washington.
Jha R., Mohanty M. S., Somnath C., Chitkara P., (1999), "Tax efficiency in selected Indian states", Empirical Economics, 24-641-654.
Jondrow J., Lovell C.A.K., Materov I.S., Schmidt P., (1982), "On the estimation of tech-nical inefficiency in stochastic frontier production function model", J Econ, 19 :223-238.
Keen M., (2013), "The Anatomy of the VAT", National Tax Journal, Vol. 66, pp. 423-46. Keen M. and Lockwoods B., (2006), "Is the VAT a money machine ?", National Tax
Jour-nal, Vol. LIX, No. 4.
Kumbhakar S. C., Wang H. J. and Horncastle A. P., (2015), "A Practitioner’s Guide to Stochastic Frontier Analysis Using Stata", Cambridge University Press.
Kumbhakar S. C., Lien G. and Hardaker J. B., (2014), "Technical Efficiency in Compe-ting Panel Data Models : A Study of Norwegian Grain Farming", Journal of Productivity
Analysis, 41(2), 321-37.
Kumbhakar S.C., Heshmati A., (1995), "Efficiency measurement in Swedish dairy farms : an application of rotating panel data 1976-88" Am J Agric Econ, 77 :660-674.
Kumbhakar S. C., (1990), "Production Frontiers, Panel Data, and the Time-varying Tech-nical Inefficiency", Journal of Econometrics, 46, 201-11.
Langford B. and Ohlenburg T., (2016), "Tax revenue potential and effort - an empirical investigation", Working Paper International Growth Centre, Version : 31 January 2016.
Lee Y. and Schmidt P., (1993), "A production Frontier Model with Flexible Temporal Variation in Technical Efficiency", in Fried H., Lovell K. and Schimdt S. et al. , the
measu-rement of Productive Efficiency, Oxford University Press.
Lim D., (1988), "Tax effort and expenditure policy in resource-rich countries" in Economic
Development Policies in Resource-rich Countries (1988) edited by Urrutia M. and Yucawa S.
Lotz J. and Morss E., (1967), "Measuring Tax effort in Developing Countries", IMF Staff
Paper, Vol.14, pp. 478-99. Mansour M. (2014), "A Tax Revenue Dataset for Sub-Saharan
Africa : 1980-2010", FERDI Working Paper No. I19.
Mansour M. and Rota-Graziosi G., (2013), "Tax Coordination in the West African Eco-nomic and Monetary Union", International Monetary Fund Working Paper WP/13/163, Washington.
Martinez-Vazquez J., (2007), "An Assessment of Pakistan’s Tax System : A Report for the World Bank and the Central Board of Revenue of Pakistan" International Studies Program
Working Paper No. 06-24, Andrew Young School of Policy Studies, Georgia State University.
Martinez-Vazquez J., (2001), "Mexico : an evaluation of the main features of the tax sys-tem", International Studies Program Working Paper 01-12, Atlanta, Georgia, Andrew Young School of Policy Studies.
McCarten W., (2006), "The Role of Organization Design Strategies of Developing Coun-tries : Benchmarking with VAT Performance", in J. Alm, J. Martinez-Vasquez, and M. Rider, eds., The Challenges of Tax Reform in a Global Economy, New York : Springer, pp. 13-39. McCarten W., (2003), "The Role of Organizational Design in the Revenue Strategies of De-veloping Countries : Benchmarking with VAT Performance", Draft (Washington : The World Bank).
Meeusen W., van den Broeck J., (1977), "Efficiency estimation from Cobb-Douglas pro-duction functions with composed error", International Economic Review 18 :435-444.
Mundlack Y., (1961), "Empirical production function free of management bias", Journal
of Farm Economics, 43(1), 44-56. Organisation for Economic Co-operation and Development,
(2008), Consumption Tax Trends 2008 VAT/GST and Excise Rates, Trends and Adminis-tration Issues, OECD.