HAL Id: hal-00304146
https://hal.archives-ouvertes.fr/hal-00304146
Submitted on 7 May 2008HAL is a multi-disciplinary open access
archive for the deposit and dissemination of sci-entific research documents, whether they are pub-lished or not. The documents may come from teaching and research institutions in France or abroad, or from public or private research centers.
L’archive ouverte pluridisciplinaire HAL, est destinée au dépôt et à la diffusion de documents scientifiques de niveau recherche, publiés ou non, émanant des établissements d’enseignement et de recherche français ou étrangers, des laboratoires publics ou privés.
Seasonal variations in aerosol optical properties over
China
Y. Wang, J. Xin, Zhenyu Li, S. Wang, P. Wang, W. M. Hao, B. L. Nordgren,
H. Chen, L. Wang, Y. Sun
To cite this version:
Y. Wang, J. Xin, Zhenyu Li, S. Wang, P. Wang, et al.. Seasonal variations in aerosol optical properties over China. Atmospheric Chemistry and Physics Discussions, European Geosciences Union, 2008, 8 (3), pp.8431-8453. �hal-00304146�
ACPD
8, 8431–8453, 2008 AOD Y. Wang et al. Title Page Abstract Introduction Conclusions References Tables Figures ◭ ◮ ◭ ◮ Back CloseFull Screen / Esc
Printer-friendly Version Interactive Discussion
Atmos. Chem. Phys. Discuss., 8, 8431–8453, 2008 www.atmos-chem-phys-discuss.net/8/8431/2008/ © Author(s) 2008. This work is distributed under the Creative Commons Attribution 3.0 License.
Atmospheric Chemistry and Physics Discussions
Seasonal variations in aerosol optical
properties over China
Y. Wang1, J. Xin1, Z. Li2, S. Wang3, P. Wang1, W. M. Hao4, B. L. Nordgren4, H. Chen1, L. Wang1, and Y. Sun1
1
LAPC, Institute of Atmospheric Physics, Chinese Academy of Sciences, Beijing 100029, P. R. China
2
Department of Meteorology, The University of Maryland, College Park, MD 20782, USA
3
College of Atmospheric Science, Lanzhou University, Lanzhou 730000, P. R. China
4
USDA Forest Service, Fire Sciences Laboratory, Missoula, MT 59808, USA Received: 25 January 2008 – Accepted: 7 April 2008 – Published: 7 May 2008 Correspondence to: J. Xin (xjy@dq.cern.ac.cn)
ACPD
8, 8431–8453, 2008 AOD Y. Wang et al. Title Page Abstract Introduction Conclusions References Tables Figures ◭ ◮ ◭ ◮ Back CloseFull Screen / Esc
Printer-friendly Version Interactive Discussion
Abstract
The seasonal variations in background aerosol optical depth (AOD) and aerosol type are investigated over various ecosystems in China based upon three years’ worth of meteorological data and data collected by the Chinese Sun Hazemeter Network. In most parts of China, AODs are at a maximum in spring or summer and at a minimum
5
in autumn or winter. Minimum values (0.10∼0.20) of annual mean AOD at 500 nm are found in the Qinghai-Tibetan Plateau, which is located in the remote northeast corner of China, the northern forest ecosystems and Hainan Island. Annual mean AOD ranges from 0.25 to 0.30 over desert and oasis areas as well as the desertification grasslands in northern China; the annual mean AOD over the Loess Plateau is moderately high
10
at 0.36. Regions where the highest density of agricultural and industrial activities are located and where anthropogenic sulphate aerosol and soil aerosol emissions are con-sistently high throughout the whole year (e.g. the central-eastern, southern and eastern coastal regions of China) experience annual mean AODs ranging from 0.50∼0.80. Re-markable seasonal changes in the main types of aerosol over northern China
(charac-15
terized by the Angstrom exponent, α) are seen. Due to biomass and fossil fuel burning from extensive agricultural practices in northern rural areas, concentrations of smoke and soot aerosols rise dramatically during autumn and winter (high α), while the main types of aerosol during spring and summer are dust and soil aerosols (low α). Over southeast Asia, biomass burning during the spring leads to increases in smoke and
20
soot emissions. Over the Tibetan Plateau and Hainan Island where the atmosphere is pristine, the main types of aerosol are dust and sea salt, respectively.
1 Introduction
China is situated in the eastern part of Asia, on the west coast of the Pacific Ocean. It is the third largest country in the world, comprising about 6.7% of the world’s total land
25
trop-ACPD
8, 8431–8453, 2008 AOD Y. Wang et al. Title Page Abstract Introduction Conclusions References Tables Figures ◭ ◮ ◭ ◮ Back CloseFull Screen / Esc
Printer-friendly Version Interactive Discussion
ical forests and from the Qinghai-Tibet Plateau to immense plains and the seashore, China contains a variety of ecosystems. The vast Chinese mainland is one of the major global aerosol sources. During the past few decades, China has become one of the major players in the uncertainty of aerosol climate and radiation effects on the Earth system, due to dramatic increases in large-scale farming, urbanization and industrial
5
activities (IPCC, 2001 and 2007; Huebert et al., 2003; Li, 2004; Seinfeld et al., 2004). Substantially more coal and biomass burning events and dust storms occur in China, adding more absorbing soot and organic aerosols into the Asian and Pacific atmo-spheres (Lelieveld et al., 2001; Seinfeld et al., 2004; Streets et al., 2001, 2003, 2004, 2005).
10
Many aerosol-related investigations have been conducted by Chinese scientists (Luo et al., 2000; Mao et al., 2002; Qiu et al., 2003), including the use of satellite data to retrieve aerosol optical properties over China (Liu et al., 2003b; Zhang et al., 2003b; Xiu et al., 2003). Kim et al. (2007) discussed seasonal variations of columnar aerosol optical properties over eastern Asia determined from multi-year Moderate Resolution
15
Imaging Spectroradiometer (MODIS) and Light Detection and Ranging (LIDAR) data, and Aerosol Robotic Network (AERONET) Sun/sky radiometer measurements. Al-though there is a similar trend in the distribution of aerosol optical depths (AODS), their quantitative comparability is poor, due to a lack of systemic ground-based net-work measurements, as well as the large errors in the satellite retrievals (Liang et al.,
20
2006; Wang et al., 2007).
Under the aegis of the East Asian Study of Tropospheric Aerosols – an Interna-tional Regional Experiment (EAST-AIRE) (Li et al., 2007), the Chinese Sun Hazemeter Network (CSHNET) was successfully implemented to obtain the spatial and temporal distributions of aerosol optical properties in China (Xin et al., 2006, 2007). This
pa-25
per uses long-term network data and synchronous meteorological data to elaborate the seasonal variability of aerosol optical properties, size, composition and sources throughout China. The work will reduce uncertainties of aerosol climate and radiation effects over the Chinese continent.
ACPD
8, 8431–8453, 2008 AOD Y. Wang et al. Title Page Abstract Introduction Conclusions References Tables Figures ◭ ◮ ◭ ◮ Back CloseFull Screen / Esc
Printer-friendly Version Interactive Discussion
2 Data
The CSHNET is the first standard network established in China to measure aerosol op-tical properties and their spatial and temporal variations throughout the country. A de-scription of the network and the instruments deployed can be found in Xin et al. (2006, 2007). Figure 1 shows the locations of the sites in the CSHNET. Nineteen CERN
(Chi-5
nese Ecosystem Research Network) stations were installed in relatively remote areas so that large-scale regional background conditions of some typical ecosystems could be monitored. A calibration center is located at the Xianghe site (39.753◦N, 116.961◦E, 30 m above sea level) where annual calibrations of the hand-held hazemeters against the CIMEL sunphotometer are performed. A new calibration center is located at the
10
Lhasa site (29.645◦N, 91.033◦E, 3.69 km above sea level) where Langley plot
calibra-tions are made in August or September of each year. Two calibration methods ensure the accuracy of the hazemeters. Vaisala M520 automatic meteorological stations pro-vide ground measurements of meteorological parameters, wind speed, temperature and humidity, at the CERN sites.
15
A log-linear fitting was applied to AODs at three wavelengths (405 nm, 500 nm and 650 nm) (Kim et al., 2004) to estimate the Angstrom exponent (α), a basic parameter related to the aerosol size distribution. In general, α ranges from 0.0 to 2.0, with the smaller α corresponding to larger aerosol particle sizes (Dubovik et al., 2002; Kim et al., 2004). AOD, α, temperature (T) and relative humidity (RH) are averaged over a
20
day. The highest local wind speed (Vmax) is the highest recorded of the hour-average
wind speed in the day.
3 Results and discussion
The annual and seasonal mean values of AOD and α are delineated in Table 1 for the regional background sites. Figure 2 shows a marked seasonal cycle in the
monthly-25
Au-ACPD
8, 8431–8453, 2008 AOD Y. Wang et al. Title Page Abstract Introduction Conclusions References Tables Figures ◭ ◮ ◭ ◮ Back CloseFull Screen / Esc
Printer-friendly Version Interactive Discussion
gust 2004 to August 2007 in northeast China. The scatterplot of α as a function of AOD, classified according to Vmax, shows that Vmaxhas no influence on the relationship
be-tween α and AOD. At the Shenyang site, 35 km south of Shenyang City, a suburban agricultural site in northeast China, the annual mean and standard deviation of AOD and α are 0.49±0.13 and 0.93±0.28, respectively. Remote sites, such as Sanjiang,
5
Hailun and Changbai Mt., have clean air so the annual mean AOD is low and ranges from 0.18 to 0.22; the annual mean α ranges from 1.17 to 1.96 at these sites. The scat-terplot of α as a function of T shows that α increases with decreasing T, which implies a systematic seasonal shift in aerosol type. The aerosol particle size decreases from autumn to winter, reflecting the agricultural practice of burning crop stalks in autumn
10
and the increase in fossil fuel and biomass burning for heating as the winter season approaches (Cao et al., 2005). A ginseng plantation is located in the Changbai Mt. region and burning grass is a traditional way to prepare the land for planting ginseng during the fall (Yu et al., 1999). Meanwhile, a gradual increase in snow and ice cover on the ground prevents soil erosion and thus restricts the emission of coarse-mode
15
mineral particles, which is also suggested by the low AOD loading during this season. An opposite trend is observed from winter to spring and summer when AOD values increased and α decreased. In spring and summer, the aerosols seem to be more of a continental type due to regional dust transmission and local soil emission. The scat-terplot of AOD as a function of RH illustrates that continental aerosols (0.5<α<1.5) are
20
hygroscopic in nature and that small smoke aerosols (α>1.5) and large dust aerosols (α<0.5) are water-insoluble.
Figure 3 presents similar results as Fig. 2 but for the arid and semi-arid regions of northern China, including Fukang (oasis), Ordos (sandy grasslands), Shapotou (desert) and Ansai (arid agrarian land). The annual mean AOD and α show similar
25
seasonal variations and range from 0.27 to 0.37 and from 0.47 to 0.96, respectively. AODs and atmospheric turbidity are larger over the desert (Sapotou) and arid agricul-tural (Ansai) sites than at the two other sites. Because the sole source of aerosols in the more desert-like region is natural dust emission, dust aerosols are more persistent
ACPD
8, 8431–8453, 2008 AOD Y. Wang et al. Title Page Abstract Introduction Conclusions References Tables Figures ◭ ◮ ◭ ◮ Back CloseFull Screen / Esc
Printer-friendly Version Interactive Discussion
at the Shapotou site (Gai et al., 2006; Xin et al., 2005). The scatterplot of α as a function of AOD shows that when Vmax>10 m/s, aerosol particles are generally bigger
than when Vmax<10 m/s, which implies that powerful winds blow local large dust
par-ticles into the atmosphere during the springtime in northern China (Xia et al., 2004). The scatterplot of α as a function of T shows that α increases as T decreases when
5
AOD<0.5, which indicates the background presence of smoke aerosols in autumn and winter due to biomass burning by the local farmers (Cao et al., 2005). For RH>60%, the scatterplot of AOD as a function of RH shows the hygroscopicity of continental aerosols (0.5<α<1.5) in these areas (Gai et al., 2006).
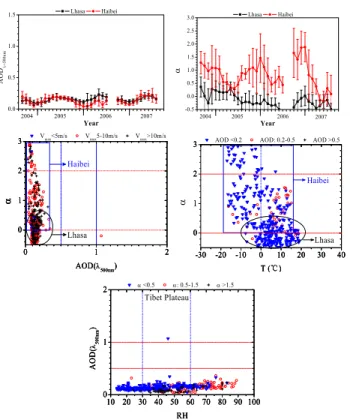
Figure 4 shows observations taken at two sites on the Tibetan Plateau. Haibei is
10
classified as an alpine meadow ecosystem and Lhasa is categorized as an alpine shrub-grassland ecosystem; some level of livestock and agricultural activity takes place in both regions. The annual mean AOD is 0.13±0.05 and 0.15±0.04 at the Haibei and Lhasa sites, respectively; the annual mean α is 0.82±0.51 and −0.15±0.25, respec-tively. Both sites have very clean air with low and stable AODs throughout the year,
15
although the windy springtime weather can cause a mild increase in AOD. At Haibei, α varies greatly over a narrow range of AOD, implying the presence of different types of aerosols. There is an increase in small aerosol particles during the long winter due to regional biomass burning. However, frequent cold air surges from Siberia often bring clean air into the region, which washes away pollutants and causes the large
day-to-20
day variations in α. At Lhasa, without significant anthropogenic impact and pollution emission, large continental/dust aerosol particles are simplex aerosol type, which is in line with large residual soil particles on the plateau surface (Yang et al., 1994a; Liu et al., 1997). The unusually low values of α may be subject to large uncertainties due to the very low AOD values (Jeong et al., 2005). Because of the very narrow range of
25
AOD, the scatterplot of AOD as a function of RH cannot describe the hygroscopicity of aerosol particles.
Figure 5 shows results from three forest ecosystems representing the range from northern temperate forests to southern tropical forests. The Beijing Forest site is a
ACPD
8, 8431–8453, 2008 AOD Y. Wang et al. Title Page Abstract Introduction Conclusions References Tables Figures ◭ ◮ ◭ ◮ Back CloseFull Screen / Esc
Printer-friendly Version Interactive Discussion
warm temperate forest ecosystem in northern China. The annual mean AOD and
α at this site are 0.22±0.09 and 0.82±0.39, respectively. The seasonal variations of
AOD and α are similar to those from the other sites in northern/northeastern China and their magnitudes fall somewhere between those from the northeastern ecosystem sites (Sanjiang, Hailun and Changbai Mt.) and the northern desert sites (Shapotou and
Or-5
dos). During autumn and winter, fossil fuel and biomass burning generate smoke and soot aerosols (Cao et al., 2005), which reduces the size of the dominant aerosol parti-cles. During spring and summer, dust storm transportation (Zhou et al., 2004) and local soil dust emission increase both AOD and the size of dominant aerosol particles. The scatterplot shows α as different functions of AOD when Vmax>5 m/s and Vmax<5 m/s.
10
The scatterplot represents a local relationship between α and AOD when the local wind is low (Vmax<5 m/s). Whereas, when the local wind is high (Vmax>5 m/s), the
scatterplot shows that α not only rises up with low AOD but also drops down with high AOD, which implies that smoke and dust aerosols are blew into the area from outside regions rather than emitting from the local area. The scatterplot of α as a function of
15
T for AOD<0.2 shows that the aerosol loading from combustion processes increases during the heating season in northern China. The scatterplot of AOD as a function of RH for 0.5<α<1.5 shows the hygroscopicity of continental aerosols.
Dinghu Mountain, a subtropical evergreen forest ecosystem, is located along the Pearl River Delta and is about 84 km away from Guangzhou in southeast China. This
20
area has a typical monsoon climate. The annual mean AOD and α are 0.66±0.21 and 1.00±0.41, respectively. The relatively high aerosol loading is the result of the rapid development of regional industrialization (Wu, 2003; Li et al., 2004; Liu et al., 2003b). Both northwesterly winds during the winter and southeasterly winds during the summer can wash away local aerosol pollution (Liu et al., 2003a; Qi et al., 2000), so AODs
25
are low during these seasons. Southeasterly winds blow in large sea salt particles, resulting in a decrease in α during the summer. The scatterplot of α as a function of T also illustrates that sea salt is dominant during the summer. The scatterplot of AOD as a function of RH shows that AOD increases as RH increases, which implies that
ACPD
8, 8431–8453, 2008 AOD Y. Wang et al. Title Page Abstract Introduction Conclusions References Tables Figures ◭ ◮ ◭ ◮ Back CloseFull Screen / Esc
Printer-friendly Version Interactive Discussion
aerosols are hygroscopic in this region (Wu, 2003).
The Xishuangbanna station is located in the tropical forests of Yunnan Province in southwest China. The annual mean AOD and α are 0.45±0.17 and 1.34±0.39, re-spectively. Figure 5 shows anomalous seasonal variations in AOD and aerosol type. Dense foggy weather frequently occurs in the region, especially during autumn and
5
winter (Li et al., 1992; Huang et al., 2000), resulting in fewer measurements taken at the site. Fog of a certain thickness can remove some amount of large hygroscopic aerosols from the atmosphere, which leads to the decrease in AOD and the increase in α. Suspended fog droplets are generally indistinguishable from haze droplets so the presence of large fog droplets can lead to an increase in AOD and a decrease in α.
10
During the rainy season from May to October, a large amount of aerosol is removed from the atmosphere which reduces AOD. During the dry spring season, AOD and α are at their highest, which implies large emissions of smoke and soot due to biomass burning which is most active in the region and the whole of southeast Asia during this time (Wu et al., 2004; Tang et al., 2003; Liu et al., 1999).
15
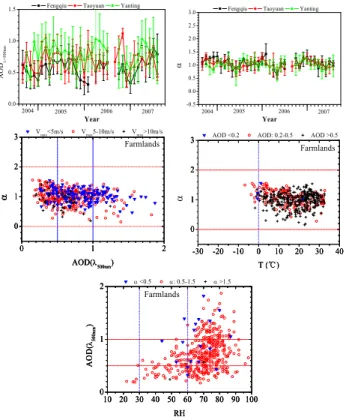
Figure 6 shows the aerosol optical properties at Fengqiu, Taoyuan and Yanting, re-spectively. The three stations are located in areas dominated by farmland in the east-ern/central/southern parts of China. The annual mean AODs at Fengqiu, Taoyuan and Yanting are 0.56±0.14, 0.69±0.17 and 0.79±0.17, respectively. AODs at these loca-tions are much higher than in more remote areas because of industrial development
20
and human activities in this part of China (Luo et al., 2000). The annual mean α is approximately equal to 1 with a standard deviation of ∼0.16 for there stations. The re-gional government has advocated and reinforced a policy for comprehensive utilization of crop stalks, so that smoke aerosol emissions from biomass burning is minimized (Wu et al., 2001; Guan et al., 2005). More mineral dust aerosols and anthropogenic
25
sulphate aerosols are emitted in eastern China, southern China and the Sichuan Basin (Tian et al., 2005; Wu et al., 2002; Guan et al., 2005), due to intensive farming and in-dustrial activities and the exposure of bare soil. The day-to-day variation of AOD is large, and its seasonal dependence is irregular. During winter and spring, weather
ACPD
8, 8431–8453, 2008 AOD Y. Wang et al. Title Page Abstract Introduction Conclusions References Tables Figures ◭ ◮ ◭ ◮ Back CloseFull Screen / Esc
Printer-friendly Version Interactive Discussion
patterns instigating serious pollution events usually occur in Hunan Province (Xiong et al., 2003; Zhang et al., 2003a) and over the Sichuan Basin (Liu et al., 2003b). The scatterplot of AOD as a function of RH given in Fig. 6 shows that AODs increase with increasing RH, implying that the abundant anthropogenic sulphate aerosols in the re-gion are hygroscopic in nature (Zhang and Shi, 2002).
5
Figure 7 shows the seasonal variations of AOD and α along the east/south coast of China. The annual mean AODs at the Jiaozhou Bay, Tai Lake and Sanya Bay sites are 0.64±0.13, 0.45±0.09 and 0.23±0.10, respectively, and the annual mean α are 1.16±0.19, 0.80±0.24 and 0.39±0.38, respectively. AODs are high at Jiaozhou Bay be-cause rapid industrial development and human activities increase aerosol emissions,
10
especially sulphate aerosols along the eastern coastal area and northern China (Luo et al., 2000; Tian et al., 2005). Dust and continental pollution transport from spring to summer contribute to large AODs with substantial standard deviations (Yang et al., 1994b; Xiao et al., 1998; Sheng et al., 2005), while influxes of cold air and clean ocean air alternately wash atmospheric pollution out of the atmosphere and decrease AODs
15
during the winter and fall seasons in the region. Aerosol pollution is also strong at Tai Lake because the region is dotted with thousands of small privately-owned factories emitting huge amounts of pollutants (Liu et al., 2003a; Zhang et al., 2003b). The small seasonal variations in AOD and α show that regional aerosol emissions and aerosol components are relatively stable. Local sources include soil, coal combustion,
metal-20
lurgical and automobile exhaust, and waste incineration (Xu et al., 2002; Zhou et al., 2006). Large particles, such as soil dust and anthropogenic sulphate, are dominant. In contrast to results from Jiaozhou Bay and Tai Lake, Sanya Bay is very clean and large sea salt particles dominate (Wu, 1995; Wu et al., 1996). During spring, the transition period from the monsoon season, some aerosols originate from Hainan Island so that
25
AOD and α rise. The scatterplot of AOD as a function of RH (α<0.5) indicates that aerosols along the east/south coast are hygroscopic in nature (Xiao et al., 1998).
ACPD
8, 8431–8453, 2008 AOD Y. Wang et al. Title Page Abstract Introduction Conclusions References Tables Figures ◭ ◮ ◭ ◮ Back CloseFull Screen / Esc
Printer-friendly Version Interactive Discussion
4 Conclusions
In this study, Chinese Sun Hazemeter Network (CSHNET) and meteorological data were analyzed in order to discriminate the spatial and temporal contributions of aerosol optical properties and aerosol types over different ecosystems in China. The annual mean AOD at 500 nm averaged over the active anthropogenic regions, e.g. the
cen-5
tral/eastern, southern and eastern coastal areas, is 0.60, which is about 3 times the regional background mean value over the relatively remote dry-clean regions in China (mean AOD∼0.23). Similar monthly and seasonal variations of AODs and aerosol types were found among the measurements over northern and southern China.
(1) During spring, dust is the dominant aerosol over northern desert and desertified
10
regions. However, dust aerosols transported by dust storms result in an increase in AOD and coarse particle size throughout eastern and southeastern China.
(2) During the humid summer season, hygroscopic sulphate aerosols increase AODs and particle sizes over the central/eastern, southern and eastern coastal areas.
(3) During autumn and winter, relatively thick vegetation and ice-snow coverage limits
15
the emission of soil dust so that AOD decreases in northern China. The majority of observation sites are under the influence of biomass and fossil fuel burning which produce heavy loadings of fine-mode aerosols, smoke and soot.
(4) In the central/eastern, southern and eastern coastal areas, the amount of fine-mode particles remains constant due to environmental regulations and economic
mea-20
sures reducing stalk combustion. Many sites show a mix of sulphate aerosols, mineral aerosols, and smoke aerosols throughout the year.
(5) A small amount of dust and sea salt aerosols are detected over the Tibetan Plateau and at Hainan Island. At the tropical rainforest site, the seasonal and monthly variations of aerosol properties are complicated due to regional dense fog and strong
25
biomass burning in southeast Asia.
Acknowledgements. This work was partly supported by the Project of Field Station Network
ACPD
8, 8431–8453, 2008 AOD Y. Wang et al. Title Page Abstract Introduction Conclusions References Tables Figures ◭ ◮ ◭ ◮ Back CloseFull Screen / Esc
Printer-friendly Version Interactive Discussion (40525016; 40675073; 40520120071), the 863 Program (2006AA06A301) and the NASA
Ra-diation Science Program (NNG04GE79G). The authors are grateful to NASA/GSFC and the CERN stations managed by the Chinese Academy of Sciences for their contribution to this research.
References
5
Cao, G., Zhang, X., Wang, D., and Zheng, F.: Inventory of atmospheric pollutants discharged from biomass burning in China continent, China Environ. Sci., 25, 4, 389–393, 2005, in Chinese.
Dubovik, O., Holben, B. N., Eck, T. F., Smirnov, A., Kaufman, Y. J., King, M. D., Tanre, D., and Slutsker, I.: Variability of absorption and optical properties of key aerosol types observed in
10
worldwide locations, J. Atmos. Sci., 59, 590–608, 2002.
Gai, Ch., Li, X., and Zhao, F.: Mineral aerosol properties observed in the northwest region of China, Global Planet. Change, 52, 173–181, 2006.
Guan, H., Chen P., Gong, S., and Zhang, D.: Characteristics of air quality and preventing and curing countermeasures of air pollution in cities of Henan Province, Areal Research and
15
Development, 24, 2, 125–128, 2005, in Chinese.
Huang, J., Li, Z., Huang, Y., and Huang, Y.: A three-dimensional model study of complex terrain (Xishuangbanna) fog, Chinese J. Atmos. Sci., 24, 6, 821–834, 2000, in Chinese.
Huebert, B. J., Bates, T., Russell, P. B., Shi, G., Kim, Y. J., Kawamura, K., Carmichael, G., and Nakajima, T.: An overview of ACE-Asia: Strategies for quantifying the relationships between
20
Asian aerosols and their climatic impacts, J. Geophys. Res., 108, D23, 8633, 2003.
IPCC: Climate Change 2001: The Scientific Basis, Cambridge University Press, New York, 291–335, 2001.
IPCC: IPCC: Climate Change 2007: The Physical Science Basis, Cambridge University Press, New York, 131–216, 2007.
25
Jeong, M. J, Li, Z., Chu, D. A., and Tsay, S.-T.: Quality and Compatibility
Analy-ses of Global Aerosol Products Derived from the Advanced Very High Resolution Ra-diometers and the Moderate Imaging Spectroradiometer, J. Geophy. Res., 110, D10S09, doi:10.1029/2004JD004648, 2005.
Kim, D., Sohn, B., Nakajima, T., Takamura, T., Choi, B., and Yoon, S.: Aerosol optical properties
ACPD
8, 8431–8453, 2008 AOD Y. Wang et al. Title Page Abstract Introduction Conclusions References Tables Figures ◭ ◮ ◭ ◮ Back CloseFull Screen / Esc
Printer-friendly Version Interactive Discussion over East Asia determined from ground-based sky radiation measurements, J. Geophys.
Res., 109, D02209, doi:10.1029/2003JD003387, 2004.
Kim, S. W., Yoon, S. C., Kim, J., and Kim, S. Y.: Seasonal and monthly variations of columnar aerosol optical properties over East Asia determined from multi-year MODIS, LIDAR, and AERONET Sun/sky radiometer measurements, Atmos. Environ., 41, 8, 1634–1651, 2007.
5
Lelieveld, J., Crutzen, P. J., Ramanathan, V., Andreae, M. O., Brenninkmeijer, C. A. M., Cam-pos, T., Cass, G. R., Dickerson, R. R., Fischer, H., Gouw, J. A. de, Hansel, A., Jefferson, A., Kley, D., Laat, A. T. J. de, Lal, S., Lawrence, M. G., Lobert, J. M., Mayol-Bracero, O. L., Mitra, A. P., Novakov, T., Oltmans, S. J., Prather, K. A., Reiner, T., Rodhe, H., Scheeren, H. A., Sikka, D., and Williams, J.: The Indian Ocean Experiment: Widespread air Pollution from
10
South and South-East Asia, Science, 291, 5506, 1031–1036, 2001.
Li, Ch., Lau, K. A., Mao, J., and Chen, A.: An aerosol pollution episode in Hong Kong with remote sensing products of MODIS and LIDRA, Journal of Appl. Meteorol. Sci., 15, 6, 641– 650, 2004, in Chinese.
Li, Z., Zhong, L., and Yu, X.: The temporal-spatial distribution and physical structure of land
15
fog in Southwest China and the Changjiang River Basin, Acta Geographica Sinica, 47, 3, 242–251, 1992, in Chinese.
Li, Z.: Aerosol and climate: A perspective from East Asia, in: Observation, Theory, and Mod-eling of the Atmospheric Variability, edited by: Zhu, D., World Scientific Pub. Co., 501–525, 2004.
20
Li, Z., Chen, H., Cribb, M., Dickerson, R., Holben, B., Li, C., Lu, D., Luo, Y., Maring, H., Shi, G., Tsay, S.-C., Wang, P., Wang, Y., Xia, X., Zheng, Y., Yuan, T., and Zhao, F.: Preface to special section on East Asian Studies of Tropospheric Aerosols: An International Regional Experi-ment (EAST-AIRE), J. Geophy. Res., 112, D22S00, doi:10.1029/2007JD008853, 2007. Liang, S., Zhong, B., and Fang, H.: Improved estimation of aerosol optical depth from MODIS
25
imagery over land surfaces, Remote Sens. Environ., 104, 416–425, 2006.
Liu, G., Mao, J., and Li, Ch.: Optical depth study on atmospheric aerosol in Yangtze River Delta region, Shanghai Environ. Sci., 22(Suppl.), 58–63, 2003a, in Chinese.
Liu, G., Zhu, A., Liu, X., Yuan, Z., Chen, J., Lau K. A., Mao J., and Li, Ch.: Characteristics of distribution and seasonal variation of aerosol optical depth in eastern China with MODIS
30
products, Chinese Sci. Bull., 48, 22, 2488–2495, 2003b.
Liu, H. Y., Chang, W. L., Samuel, J. O., Chan, L. Y., and Joyce, M. H.: On springtime high ozone events in the lower troposphere from Southeast Asian biomass burning, Atmos. Environ., 33,
ACPD
8, 8431–8453, 2008 AOD Y. Wang et al. Title Page Abstract Introduction Conclusions References Tables Figures ◭ ◮ ◭ ◮ Back CloseFull Screen / Esc
Printer-friendly Version Interactive Discussion 15, 2403–2410, 1999.
Liu, H., Zhang, X., and Shen, Zh.: The chemical composition and concentration of atmospheric aerosol at Wudaoliang and its seasonal variation, Plateau Meteorology, 16, 2, 122–129, 1997, in Chinese.
Luo, Y., L ¨u, D., and Li, W.: The characteristics of atmospheric aerosol optical depth variation
5
over China in recent 30 years, Chinese Sci. Bull., 45, 549–554, 2000, in Chinese.
Mao, J., Zhang, J., and Wang, M.: Summary comment on research of atmospheric aerosol in china, Acta Meteorologica Sinica, 60(5), 625–634, 2002, in Chinese.
Qi, Sh., Sheng, G., and Ye, Zh.: Study on organic pollutant bachground in aerosols in Pearl River Delta area, China Environ. Sci., 20, 3, 225–228, 2000, in Chinese.
10
Qiu, J., Lu, D., Chen, H., Wang G., and Shi, G.: Modern research progresses in atmospheric physics, Chinese J. Atmos. Sci., 27, 4, 628–652, 2003, in Chinese.
Seinfeld, J. H., Carmichael, G. R., Arimoto, R., Conant, W. C., Brechtel, F. J., Bates, T. S., Cahill, T. A., Clarke, A. D., Doherty, S. J., Flatau, P. J., Huebert, B. J., Kim, J., Markowicz, K. M., Quinn, P. K., Russell, L. M., Russell, P. B., Shimizu, A., Shinozuka, Y., Song, Ch. H.,
15
Tang, Y., Uno, I., Vogelmann, A. M., Weber, R. J., Woo, J., and Zhang, X. Y.: ACE-ASIA: Regional Climatic and Atmospheric Chemical Effects of Asian Dust and Pollution, B. Am. Meterol. Soc., 85, 3, 367–380, 2004.
Sheng, L., Guo, Zh., and Gao, H.: Preliminary study on Element composition and source apportionment of atmospheric aerosol over Bohai Sea, Environmental Monitoring in China,
20
21, 1, 16–20, 2005, in Chinese.
Streets, D. G., Gupta, S., Waldhoff, S. T., Wang, M. Q., Bond, T. C., and Bo, Y.: Black carbon emissions in China, Atmos. Environ., 35, 4281–4296, 2001.
Streets, D. G., Carmichael, G. R., Fernandes, S. D., Fu, Q., He, D., Klimont, Z., Nelson, S. M., Tsai, N. Y., Wang, M. Q., Woo, J.-H., and Yarber, K. F.: An inventory of gaseous and
25
primary aerosol emissions in Asia in the year 2000, J. Geophys. Res., 108, D21, 8809, doi:10.1029/2002JD003093, 2003.
Streets, D. G., Bond, T. C., Lee, T., and Jang, C.: On the future of carbonaceous aerosol emissions, J. Geophys. Res., 109, D24212, doi:10.1029/2004JD004902, 2004.
Streets, D. G. and Aunan, K.: The importance of China’s household sector for black carbon
30
emissions, Geophys. Res. Lett, 32, L12708, doi:10.1029/2005GL022960, 2005.
Tang, Y., Carmichael, G. R., Woo, J.-H., Thongboonchoo, N., Kurata, G., Uno, I., Streets, D. G., Blake, D. R., Weber, R. J., Talbot, R. W., Kondo, Y., Singh, H. B., and Wang, T.:
ACPD
8, 8431–8453, 2008 AOD Y. Wang et al. Title Page Abstract Introduction Conclusions References Tables Figures ◭ ◮ ◭ ◮ Back CloseFull Screen / Esc
Printer-friendly Version Interactive Discussion The influences of biomass burning during TRACE-P experiment identified by the regional
chemical transport model, J. Geophys. Res., 108, D21, 8824, doi:10.1029/2002JD003110, 2003.
Tian, H., Ma, J., Li, W., and Liu, H.: Simulation of forcing of sulfate aerosol on direct radiation and its climate effect over middle and eastern China, J. Appl. Meteorol. Sci., 16, 3, 322–333,
5
2005, in Chinese.
Wang L., Xin, J., Wang, Y., Li, Z., Wang, P., Liu, G., and Wen, T.: Validation of MODIS aerosol products by CSHNET over China, Chinese Sci. Bull., 25, 12, 1708–1718, 2007.
Wu, D.: A review and outlook on the aerosol study over South China, Journal of Tropical Mete-orology, 19(Suppl.), 145–151, 2003, in Chinese.
10
Wu, D.: The distribution Characteristics of water-soluble composition of atmospheric aerosol over north of the South China Sea, Scientia Atmospherica Sinica, 19(5), 615–622, 1995, in Chinese.
Wu, D., You, J., and Guan, Y.: The distribution feature of giant sea-salt nucleus in atmosphere over Yongxing (Xisha Islands) during the northeast winter monsoon, Journal of Tropical
Me-15
teorology, 12(2), 122–129, 1996.
Wu, J., Jiang, W., Liu, H., and Tang, J.: Simulation of the direct and indirect radiative effects of sulfate aerosol, Acta Scientiae Circumstantiae, 22(2), 129–134, 2002, in Chinese.
Wu, J., Jiang, W., and Chen, X.: Simulation of effects to tropospheric ozone over South East Asia and South China from biomass burning, Environ. Sci., 25(2), 1–6, 2004, in Chinese.
20
Wu, L., Chen, J., and Zhu, X.: Straw-burning in rural areas of China: causes and controlling strategy, China Population, Resources and Environment, 11(51), 110–112, 2001, in Chi-nese.
Xia, X., Chen, H., and Wang, P.: Aerosol properties in a Chinese semiarid region, Atmos. Environ., 38, 4571–4581, 2004.
25
Xiao, H., Gregory, R. C., and Yang, Z.: A modelling evaluation of the impact of mineral aerosols on the particulate sulfate formation in East Asia, Scientia Atmospherica Sinica, 22(3), 343– 353, 1998, in Chinese.
Xin, J., Wang, S., Wang, Y., Yuan, J., Zhang, W, and Liu, Ch.: Optical properties and size distribution of dust aerosols over the Tengger Desert in Northern China, Atmos. Environ., 39,
30
5971–5978, 2005.
Xin, J., Wang, Y., Li, Z. and Wang, P.: Introduction and calibration of the Chinese Sun Hazeme-ter Network, Environ. Sci., 27(9), 1697–1702, 2006, in Chinese.
ACPD
8, 8431–8453, 2008 AOD Y. Wang et al. Title Page Abstract Introduction Conclusions References Tables Figures ◭ ◮ ◭ ◮ Back CloseFull Screen / Esc
Printer-friendly Version Interactive Discussion Xin, J., Wang, Y., Li, Z., and Wang, P.: AOD and Angstrom exponent of aerosols observed
by the Chinese Sun Hazemeter Network from August 2004 to September 2005, J. Geophy. Res.,112, D05203, doi:10.1029/2006JD007075, 2007.
Xiong, M., Lu, H., and Wu, F.: Analysis on air quality in major cities of Hunan Province, Jour Nat Scie Hunan Norm Uni, 26(1), 89–92, 2003, in Chinese.
5
Xiu, X., Zhou, X. Weng, Y., Tian, G. Liu, Y., Yan, P., Ding, G., Zhang, Y., Mao, J, and Qiu, H.: Explore aerosol variational field by using MODIS data and ground-based photometer observation, Chinese Sci. Bull., 48, 15, 1680–1685, 2003, In Chinese.
Xu, J., Bergin, M. H., Yu, X., Liu, G., Zhao, J., Carrico, C. M., and Baumann, K.: Measurement of aerosol chemical, physical and radiative properties in the Yangtze delta region of China,
10
Atmos. Environ., 36, 161–173, 2002.
Yang, L., Wang, M., Lu, G., and Gong, Y.: The observation and research for the continen-tal aerosol background characteristics in the northern part of the Qinghai-Xizang Plateau, Plateau Meteorology, 13(2), 135–143, 1994a, in Chinese.
Yang, Sh., Yang, Y., and Chen, B.: Input of atmospheric trace elements to the near-China
15
ocean, Environ. Chem., 13(5), 382–388, 1994b, in Chinese.
Yu, J., Liu, J., Wang, J., and Zheng, Y.: The impact of ecological environment and strategy of sustainable development from ginseng industrial development in the Changbai Mountain region, Agro-Environ. and Develop., 16, 4, 28–30, 1999, in Chinese.
Zhang, G., Zeng, G., Jiang, Y., and Liu, H.: Analysis on the variant characteristics, present
20
situation and origin of acid rain in Hunan Province, Res. of Environ. Sci., 16(5), 14–17, 2003a, in Chinese.
Zhang, J., Si, Zh., Mao, J., and Wang, M.: Remote sensing aerosol optical depth over China with GMS-5 satellite, Chinese J. Atmos. Sci., 27(1), 23–35, 2003b, in Chinese.
Zhang, L. and Shi, G.: The impact of relative humidity on the radiative property and radiative
25
forcing of sulfate aerosol, Acta Meteorologica Sinica, 60(2), 230–237, 2002, in Chinese. Zhou, R., Liu, H., and Jiang, W.: The study on the transport of dust aerosol in China, Scientia
Meteorologica Sinica, 24(1), 16–25, 2004, in Chinese.
Zhou, Zh., Liu, K., and Sun, Y.: Characteristics of Elements in PM2.5 and Sources Analysis of PM2.5 in Rural Areas of Southern Jiangsu Province, Res. Environ. Sci., 19(3), 24–28, 2006,
30
ACPD
8, 8431–8453, 2008 AOD Y. Wang et al. Title Page Abstract Introduction Conclusions References Tables Figures ◭ ◮ ◭ ◮ Back CloseFull Screen / Esc
Printer-friendly Version Interactive Discussion
Table 1. The annual and seasonal means and standard deviations of aerosol optical depth
(AOD) at 500 nm and Angstrom exponent (α) measured at the CSHNET regional background sites.
Region or ecosystem The site name Annual mean Spring Summer Autumn Winter
AOD α AOD α AOD α AOD α AOD α
Northeastern China
Sanjiang 0.21±0.09 1.28±0.61 0.27±0.12 0.96±0.15 0.24±0.07 0.64±0.14 0.20±0.06 1.35±0.50 0.15±0.03 1.90±0.58 Hailun 0.18±0.05 1.96±0.53 0.20±0.05 1.84±0.28 0.19±0.04 1.36±0.61 0.13±0.01 2.33±0.37 0.19±0.04 2.23±0.33 Changbai Mt. 0.22±0.09 1.17±0.43 0.26±0.09 0.87±0.21 0.30±0.07 0.84±0.28 0.15±0.04 1.39±0.39 0.16±0.02 1.54±0.35 Shenyang 0.49±0.13 0.93±0.28 0.53±0.11 0.76±0.17 0.55±0.21 0.69±0.27 0.45±0.07 1.15±0.24 0.45±0.06 1.08±0.16
An arid region of north China
Fukang 0.29±0.11 0.96±0.28 0.25±0.03 0.78±0.20 0.25±0.03 0.82±0.17 0.23±0.06 1.21±0.24 0.42±0.14 1.01±0.27 Ordos 0.27±0.10 0.47±0.37 0.35±0.08 0.21±0.14 0.31±0.13 0.35±0.41 0.20±0.04 0.50±0.27 0.21±0.06 0.85±0.36 Shapotou 0.32±0.09 0.90±0.28 0.36±0.11 0.65±0.22 0.31±0.11 0.88±0.25 0.29±0.06 0.98±0.27 0.32±0.07 1.06±0.24 Ansai 0.36±0.11 0.86±0.60 0.47±0.09 0.42±0.26 0.33±0.06 0.21±0.24 0.31±0.08 1.08±0.29 0.32±0.11 1.57±0.45 The Tibet Plateau HaibeiLhasa 0.13±0.05 0.82±0.51 0.17±0.05 0.33±0.31 0.18±0.03 0.62±0.41 0.11±0.03 1.25±0.32 0.10±0.04 1.04±0.42 0.15±0.04 −0.15±0.25 0.19±0.03 −0.18±0.28 0.17±0.02 −0.21±0.32 0.13±0.02 −0.16±0.21 0.12±0.02 −0.06±0.21 Forest ecosystem Beijing Forest 0.22±0.09 0.82±0.39 0.29±0.10 0.55±0.25 0.27±0.08 0.62±0.24 0.18±0.07 0.93±0.30 0.15±0.04 1.20±0.41 Dinghu Mt. 0.66±0.21 1.00±0.41 0.80±0.20 1.21±0.48 0.56±0.24 1.31±0.52 0.69±0.15 0.78±0.20 0.59±0.24 0.86±0.25 Xishuangbanna 0.45±0.17 1.34±0.39 0.61±0.15 1.60±0.23 0.34±0.13 0.91±0.40 0.37±0.10 1.21±0.32 0.44±0.15 1.55±0.20 Farmland ecosystem Fengqiu 0.56±0.14 1.08±0.18 0.62±0.09 0.92±0.19 0.71±0.10 1.07±0.09 0.50±0.10 1.13±0.14 0.45±0.13 1.22±0.13 Taoyuan 0.69±0.17 1.04±0.14 0.70±0.10 0.92±0.12 0.60±0.13 0.94±0.06 0.73±0.23 1.12±0.12 0.70±0.18 1.14±0.11 Yanting 0.79±0.17 1.02±0.15 0.93±0.10 0.92±0.19 0.81±0.07 1.11±0.11 0.67±0.19 1.03±0.15 0.76±0.16 1.05±0.08
Bay and lake ecosystem
Jiaozhou Bay 0.64±0.13 1.16±0.19 0.70±0.08 1.05±0.19 0.79±0.08 1.05±0.18 0.57±0.12 1.31±0.15 0.53±0.07 1.20±0.11 Lake Tai 0.45±0.09 0.80±0.24 0.43±0.08 0.77±0.25 0.59±0.03 0.73±0.46 0.49±0.07 0.93±0.11 0.39±0.09 0.88±0.19 Sanya Bay 0.23±0.10 0.39±0.38 0.26±0.06 0.61±0.28 0.22±0.09 −0.04±0.24 0.20±0.12 0.32±0.26 0.21±0.12 0.50±0.39
ACPD
8, 8431–8453, 2008 AOD Y. Wang et al. Title Page Abstract Introduction Conclusions References Tables Figures ◭ ◮ ◭ ◮ Back CloseFull Screen / Esc
Printer-friendly Version Interactive Discussion CERN station (19) City site (4) (116.37E,39.97N,44m) (115.43E,39.97N,1130m) (128.63E,42.40N,736m) (110.18E,39.48N,1300m) (114.40E,35.00N,68m) (101.32E,37.45N,3230m) (87.92E,44.28N,470m) (126.63E,47.43N,240m) (120.18E,35.90N,6m) (133.52E,47.58N,56m) (123.63E,41.52N,31m) (121.75E,31.12N,5m) (120.22E,31.40N,6m) (111.45E,28.92N,78m) (105.45E,31.27N,420m) (101.27E,21.90N,570m) (103.82E,36.07N,1520m) (91.33E,29.67N,3688m) (109.47E,18.22N,3m) (112.53E,23.17N,300m) Fukang Haibei Lhasa Xishuangbanna Sanya Dinghu Mountain Yanting Taoyuan Shanghai Lanzhou Shapotou (104.95E,37.45N,1357m) Ordos Beijing forest Beijing Jiaozhou Bay Shenyang Fengqiu Changbai Mountain Sanjiang Hailun Xianghe Calibration center (2)
The Chinese Sun Hazemeter Network (CSHNET)
Ansai (109.31E,36.85N,1208m) (121.09E,25.00N,230m) Taibei Lake Tai 80 90 100 110 120 130 East Longitude 5 10 15 20 25 30 35 40 45 50 N o rt h L a ti tu d e
ACPD
8, 8431–8453, 2008 AOD Y. Wang et al. Title Page Abstract Introduction Conclusions References Tables Figures ◭ ◮ ◭ ◮ Back CloseFull Screen / Esc
Printer-friendly Version Interactive Discussion 0.0 0.5 1.0 1.5 2004 2005 2006 2007 A O Dλ = 5 00nm Year
Changbai Mt. Hailun Sanjiang Shenyang
-0.5 0.0 0.5 1.0 1.5 2.0 2.5 3.0 2004 2005 2006 2007 α Year
Changbai Mt. Hailun Sanjiang Shenyang
0 1 2 0 1 2 3 AOD(λ500nm) α
Vmax<5m/s Vmax5-10m/s Vmax>10m/s
Northeastern China 0 1 2 0 1 2 3 AOD(λ500nm) α 0 1 2 0 1 2 3 AOD(λ500nm) α -30 -20 -10 0 10 20 30 40 0 1 2 3 T (℃) α
AOD <0.2 AOD: 0.2-0.5 AOD >0.5
Northeastern China -30 -20 -10 0 10 20 30 40 0 1 2 3 T (℃) -30 -20 -10 0 10 20 30 40 0 1 2 3 T (℃) 10 20 30 40 50 60 70 80 90 100 0 1 2 RH A O D ( λ500n m ) α <0.5 α: 0.5-1.5 α >1.5 Northeastern China 10 20 30 40 50 60 70 80 90 100 0 1 2 RH A O D ( λ500n m ) 10 20 30 40 50 60 70 80 90 100 0 1 2 RH A O D ( λ500n m )
Figure 2. Seasonal variations in monthly-averaged aerosol optical depth (AOD) at 500 nm and
α α
α
Fig. 2. Seasonal variations in monthly-averaged aerosol optical depth (AOD) at 500 nm and
Angstrom exponent (α) (upper left plot), α as a function of AOD (upper right plot), daily-averaged α as a function of temperature (T, lower left plot) and daily-daily-averaged AOD as a
function of relative humidity (RH, lower right plot). Data are from Changbai Mountain (a
temperate forest ecosystem), Hailun (a farmland ecosystem in the Songnen Plain), Sanjiang (a marsh/farmland ecosystem), Shenyang (a suburban farmland ecosystem) in northeastern China.
ACPD
8, 8431–8453, 2008 AOD Y. Wang et al. Title Page Abstract Introduction Conclusions References Tables Figures ◭ ◮ ◭ ◮ Back CloseFull Screen / Esc
Printer-friendly Version Interactive Discussion 0.0 0.5 1.0 1.5 2007 2006 2005 2004 A O Dλ = 500 nm Year
Fukang Shapotou Ordos Ansai
-0.5 0.0 0.5 1.0 1.5 2.0 2.5 3.0 2007 2006 2005 2004 α Year
Fukang Shapotou Ordos Ansai
0 1 2 0 1 2 3 AOD(λ500nm) α
Vmax<5m/s Vmax5-10m/s Vmax>10m/s
North desert 0 1 2 0 1 2 3 AOD(λ500nm) α 0 1 2 0 1 2 3 AOD(λ500nm) α -30 -20 -10 0 10 20 30 40 0 1 2 3 T (℃) α
AOD <0.2 AOD: 0.2-0.5 AOD >0.5
North desert -30 -20 -10 0 10 20 30 40 0 1 2 3 T (℃) -30 -20 -10 0 10 20 30 40 0 1 2 3 T (℃) 10 20 30 40 50 60 70 80 90 100 0 1 2 RH A O D ( λ500n m ) α <0.5 α: 0.5-1.5 α >1.5 North desert 10 20 30 40 50 60 70 80 90 100 0 1 2 RH A O D ( λ500n m ) 10 20 30 40 50 60 70 80 90 100 0 1 2 RH A O D ( λ500n m )
Figure 3. Seasonal variations in monthly-averaged aerosol optical depth (AOD) at 500 nm and
α α
α
Fig. 3. Seasonal variations in monthly-averaged aerosol optical depth (AOD) at 500 nm and
Angstrom exponent (α) (upper left plot), α as a function of AOD (upper right plot), daily-averaged α as a function of temperature (T, lower left plot) and daily-daily-averaged AOD as a function of relative humidity (RH, lower right plot). Data are from Fukang (an oasis ecosys-tem in the transition zone extending from Tianshan Mountain to the Gurbantunggut Desert), Ordos (a sandy grassland ecosystem in the temperate semi-arid grassland zone), Shapotou (a desert ecosystem in the arid region of northern China), Ansai (an agricultural ecosystem in the Loess Plateau) in an arid region of north China.
ACPD
8, 8431–8453, 2008 AOD Y. Wang et al. Title Page Abstract Introduction Conclusions References Tables Figures ◭ ◮ ◭ ◮ Back CloseFull Screen / Esc
Printer-friendly Version Interactive Discussion 0.0 0.5 1.0 1.5 2007 2006 2005 2004 A O Dλ = 5 00nm Year Lhasa Haibei -0.5 0.0 0.5 1.0 1.5 2.0 2.5 3.0 2007 2006 2005 2004 α Year Lhasa Haibei 0 1 2 0 1 2 3 Lhasa AOD(λ500nm) α
Vmax<5m/s Vmax5-10m/s Vmax>10m/s
Haibei 0 1 2 0 1 2 3 AOD(λ500nm) α 0 1 2 0 1 2 3 AOD(λ500nm) α -30 -20 -10 0 10 20 30 40 0 1 2 3 Lhasa T (℃) α
AOD <0.2 AOD: 0.2-0.5 AOD >0.5
Haibei -30 -20 -10 0 10 20 30 40 0 1 2 3 T (℃) -30 -20 -10 0 10 20 30 40 0 1 2 3 T (℃) 10 20 30 40 50 60 70 80 90 100 0 1 2 RH A O D ( λ500n m ) α <0.5 α: 0.5-1.5 α >1.5 Tibet Plateau 10 20 30 40 50 60 70 80 90 100 0 1 2 RH A O D ( λ500n m ) 10 20 30 40 50 60 70 80 90 100 0 1 2 RH A O D ( λ500n m ) α α α
Fig. 4. Seasonal variations in monthly-averaged aerosol optical depth (AOD) at 500 nm and
Angstrom exponent (α) (upper left plot), α as a function of AOD (upper right plot), daily-averaged α as a function of temperature (T, lower left plot) and daily-daily-averaged AOD as a function of relative humidity (RH, lower right plot). Data are from Haibei (an alpine meadow ecosystem) and Lhasa (an alpine shrub-grassland ecosystem) on the Tibet Plateau.
ACPD
8, 8431–8453, 2008 AOD Y. Wang et al. Title Page Abstract Introduction Conclusions References Tables Figures ◭ ◮ ◭ ◮ Back CloseFull Screen / Esc
Printer-friendly Version Interactive Discussion 0.0 0.5 1.0 1.5 2004 2005 2006 2007 A O Dλ = 500 nm Year
Beijing Forest Dinghu Mt. Xishuangbanna
-0.5 0.0 0.5 1.0 1.5 2.0 2.5 3.0 2004 2005 2006 2007 α Year
Beijing Forest Dinghu Mt. Xishuangbanna
0 1 2 0 1 2 3 AOD(λ500nm) α
Vmax<5m/s Vmax5-10m/s Vmax>10m/s
Beijing Forest 0 1 2 0 1 2 3 AOD(λ500nm) α 0 1 2 0 1 2 3 AOD(λ500nm) α 0 1 2 0 1 2 3 AOD(λ500nm) α
Vmax<5m/s Vmax5-10m/s Vmax>10m/s
Dinghu Mt. & Xishuangbanna
0 1 2 0 1 2 3 AOD(λ500nm) α 0 1 2 0 1 2 3 AOD(λ500nm) α -30 -20 -10 0 10 20 30 40 0 1 2 3 South forests T (℃) α
AOD <0.2 AOD: 0.2-0.5 AOD >0.5
Beijing forest -30 -20 -10 0 10 20 30 40 0 1 2 3 T (℃) -30 -20 -10 0 10 20 30 40 0 1 2 3 T (℃) 10 20 30 40 50 60 70 80 90 100 0 1 2 RH A O D ( λ500n m ) α <0.5 α: 0.5-1.5 α >1.5 Forests 10 20 30 40 50 60 70 80 90 100 0 1 2 RH A O D ( λ500n m ) 10 20 30 40 50 60 70 80 90 100 0 1 2 RH A O D ( λ500n m )
Figure 5. Seasonal variations in monthly-averaged aerosol optical depth (AOD) at 500 nm and
α α
α
Fig. 5. Seasonal variations in monthly-averaged aerosol optical depth (AOD) at 500 nm and
Angstrom exponent (α) (upper left plot), α as a function of AOD (upper right plot), daily-averaged α as a function of temperature (T, lower left plot) and daily-daily-averaged AOD as a function of relative humidity (RH, lower right plot). Data are from the Beijing Forest (a warm temperate forest ecosystem to the west of Beijing City), Dinghu Mountain (a subtropical ev-ergreen forest ecosystem at the Pearl River Delta) and Xishuangbanna (a tropical rainforest ecosystem in Yunnan Province).
ACPD
8, 8431–8453, 2008 AOD Y. Wang et al. Title Page Abstract Introduction Conclusions References Tables Figures ◭ ◮ ◭ ◮ Back CloseFull Screen / Esc
Printer-friendly Version Interactive Discussion 0.0 0.5 1.0 1.5 2007 2006 2005 2004 A O Dλ = 500 nm Year
Fengqiu Taoyuan Yanting
-0.5 0.0 0.5 1.0 1.5 2.0 2.5 3.0 2007 2006 2005 2004 α Year
Fengqiu Taoyuan Yanting
0 1 2 0 1 2 3 AOD(λ500nm) α
Vmax<5m/s Vmax5-10m/s Vmax>10m/s
Farmlands 0 1 2 0 1 2 3 AOD(λ500nm) α 0 1 2 0 1 2 3 AOD(λ500nm) α -30 -20 -10 0 10 20 30 40 0 1 2 3 T (℃) α
AOD <0.2 AOD: 0.2-0.5 AOD >0.5
Farmlands -30 -20 -10 0 10 20 30 40 0 1 2 3 T (℃) -30 -20 -10 0 10 20 30 40 0 1 2 3 T (℃) 10 20 30 40 50 60 70 80 90 100 0 1 2 RH A O D ( λ50 0n m ) α <0.5 α: 0.5-1.5 α >1.5 Farmlands 10 20 30 40 50 60 70 80 90 100 0 1 2 RH A O D ( λ50 0n m ) 10 20 30 40 50 60 70 80 90 100 0 1 2 RH A O D ( λ50 0n m )
Figure 6. Seasonal variations in monthly-averaged aerosol optical depth (AOD) at 500 nm and
α α
α
Fig. 6. Seasonal variations in monthly-averaged aerosol optical depth (AOD) at 500 nm and
Angstrom exponent (α) (upper left plot), α as a function of AOD (upper right plot), daily-averaged α as a function of temperature (T, lower left plot) and daily-daily-averaged AOD as a function of relative humidity (RH, lower right plot). Data are from Fengqiu (a farmland ecosys-tem on the Huang-huai-hai Plain), Taoyuan (a subtropical farmland ecosysecosys-tem) and Yanting (a farmland ecosystem in the hilly region of the Sichuan Basin).
ACPD
8, 8431–8453, 2008 AOD Y. Wang et al. Title Page Abstract Introduction Conclusions References Tables Figures ◭ ◮ ◭ ◮ Back CloseFull Screen / Esc
Printer-friendly Version Interactive Discussion 0.0 0.5 1.0 1.5 2007 2006 2005 A O Dλ= 500 nm Year
Jiaozhou Bay Tai Lake Sanya Bay
2004 -0.5 0.0 0.5 1.0 1.5 2.0 2.5 3.0 2007 2006 2005 2004 α Year
Jiaozhou Bay Tai Lake Sanya Bay
0 1 2 0 1 2 3 AOD(λ500nm) α
Vmax<5m/s Vmax5-10m/s Vmax>10m/s
Bays and lake
0 1 2 0 1 2 3 AOD(λ500nm) α 0 1 2 0 1 2 3 AOD(λ500nm) α -30 -20 -10 0 10 20 30 40 0 1 2 3 T (℃) α
AOD <0.2 AOD: 0.2-0.5 AOD >0.5
Bays and lake
-30 -20 -10 0 10 20 30 40 0 1 2 3 T (℃) -30 -20 -10 0 10 20 30 40 0 1 2 3 T (℃) 10 20 30 40 50 60 70 80 90 100 0 1 2 RH A O D ( λ500n m ) α <0.5 α: 0.5-1.5 α > 1.5
Bays and lake
10 20 30 40 50 60 70 80 90 100 0 1 2 RH A O D ( λ500n m ) 10 20 30 40 50 60 70 80 90 100 0 1 2 RH A O D ( λ500n m )
Figure 7. Seasonal variations in monthly-averaged aerosol optical depth (AOD) at 500 nm and
α α
α
,
Fig. 7. Seasonal variations in monthly-averaged aerosol optical depth (AOD) at 500 nm and
Angstrom exponent (α) (upper left plot), α as a function of AOD (upper right plot), daily-averaged α as a function of temperature (T, lower left plot) and daily-daily-averaged AOD as a function of relative humidity (RH, lower right plot). Data are from Jiaozhou Bay (a marine ecosystem on the west coast of the Yellow Sea) Lake Tai (a freshwater lake ecosystem at the Yangtze River Delta) and Sanya Bay (a tropical marine ecosystem in the South China Sea).