Computational Methods for Physiological Data
by
Zeeshan Hassan Syed
S.B.,
Massachusetts Institute of Technology (2003)
M.Eng., Massachusetts Institute of Technology (2003)
Submitted to the Harvard-MIT Division of Health Sciences and
Technology, and the MIT Department of Electrical Engineering and
Computer Science
in partial fulfillment of the requirements for the degree of
Doctor of Philosophy in Computer Science and Biomedical
Engineering
at the
MASSACHUSETTS INSTITUTE OF TECHNOLOGY
September 2009
ARCHIVES
@
Zeeshan Hassan Syed, MMIX. All rights reserved.
The author hereby grants to MIT permission to reproduce and
distribute publicly paper and electronic copies of this thesis document
in whole or in part.
MASSAH
S
INS
TE
OFTECHNOLOGY
OCT 0 2 2009
LIBRARIES
Author
...
Harvard-MIT Division of Health Sciences and Technology, and the
MIT Department of Electrical Engineering and Computer Science
July 31, 2009
Certified by.
...
,,.....
.
...
...
John V. Guttag
Professor, Electrical Engineering and Computer Science
Thesis Supervisor
A
ccepted by ...
...
...
...
Ram Sasisekharan
Director, Harvard-MIT Division of Health Sciences and Technology
Computational Methods for Physiological Data
by
Zeeshan Hassan Syed
Submitted to the Harvard-MIT Division of Health Sciences and Technology, and the MIT Department of Electrical Engineering and Computer Science
on July 31, 2009, in partial fulfillment of the requirements for the degree of
Doctor of Philosophy in Computer Science and Biomedical Engineering
Abstract
Large volumes of continuous waveform data are now collected in hospitals. These datasets provide an opportunity to advance medical care, by capturing rare or sub-tle phenomena associated with specific medical conditions, and by providing fresh insights into disease dynamics over long time scales.
We describe how progress in medicine can be accelerated through the use of so-phisticated computational methods for the structured analysis of large multi-patient, multi-signal datasets. We propose two new approaches, morphologic variability (MV) and physiological symbolic analysis, for the analysis of continuous long-term signals. MV studies subtle micro-level variations in the shape of physiological signals over long periods. These variations, which are often widely considered to be noise, can contain important information about the state of the underlying system. Symbolic analysis studies the macro-level information in signals by abstracting them into sym-bolic sequences. Converting continuous waveforms into symsym-bolic sequences facilitates the development of efficient algorithms to discover high risk patterns and patients who are outliers in a population.
We apply our methods to the clinical challenge of identifying patients at high risk of cardiovascular mortality (almost 30% of all deaths worldwide each year). When evaluated on ECG data from over 4,500 patients, high MV was strongly associated with both cardiovascular death and sudden cardiac death. MV was a better predic-tor of these events than other ECG-based metrics. Furthermore, these results were independent of information in echocardiography, clinical characteristics, and biomark-ers. Our symbolic analysis techniques also identified groups of patients exhibiting a varying risk of adverse outcomes. One group, with a particular set of symbolic char-acteristics, showed a 23 fold increased risk of death in the months following a mild heart attack, while another exhibited a 5 fold increased risk of future heart attacks. Thesis Supervisor: John V. Guttag
Acknowledgments
I chose John Guttag as an academic advisor at the end of freshman year, an exercise that entailed randomly selecting from a list of faculty members I had never met. For a decision made with precious little information, it has proven to be a pivotal one. Working with John has been one of my most cherished and enduring associations. He has been a teacher, mentor, colleague, friend, and family over the last many years,
and his devotion to his students has been - surreal. None of the work presented in
this thesis would have been possible without his inspiration and technical intuition, and his positive influence on my life and personality extends beyond the realm of research. It has been an absolute delight to have worked with John, and a pleasure to anticipate learning so much more from him in the years to come.
I also owe a great debt of gratitude to Collin Stultz, whose contributions to the work presented in this thesis are immeasurable. His dynamism and incredible knowl-edge of medicine and engineering have been invaluable while working at the inter-section of these disciplines, and his unstinted support for our research has been a great comfort over the years. In addition, Collin has been a source of guidance on matters both technical and non-technical, and his dedication to the cause of others is an example that will remain with me for a long time.
I am indebted to Benjamin Scirica, who has been an esteemed colleague and won-derful friend during the course of this project. All aspects of our work have benefited immensely from Ben's varied skills. He has given direction to our research with his clinical insights and experience, helped us gain access to data that was instrumental in the development and testing of new hypotheses, suggested sophisticated statistical techniques to evaluate our work rigorously. and been an excellent sounding board for new ideas. Throughout the course of this project, Ben has helped accelerate progress and motivated us with his endless enthusiasm. I also thank Ben for introducing us to Christopher Cannon, Peter Stone, David Morrow, Satishkumar Mohanavelu, Eugene Braunwald and the rest of the TIMI Study Group at the Brigham and Women's Hos-pital. I am grateful to them for sharing their data and expertise with us, and consider myself fortunate to have worked with some of the finest clinical minds of our time.
I also feel privileged to have worked with George Verghese, who continues to be a role model with his extensive knowledge spanning many disciplines and his humility. His feedback and questions have helped identify important areas where significant improvements were possible, and have been essential in helping me develop a more
complete grasp of complex engineering principles.
I am grateful to Piotr Indyk for the substantial algorithmic improvements in our work, most notably in the area of symbolic analysis, which were possible with his help. Piotr has always been available to help on short notice, and it has been fascinating to watch him reason about complicated theoretical issues with great ease and clarity. Manolis Kellis has also helped by sharing his expertise on motif discovery meth-ods. His in-depth knowledge and input have helped shape much of our work on computational physiology.
This work has also benefited greatly from Gari Clifford and his expertise in the analysis of electrocardiographic data. Gari has contributed many important tools
that were used in our project and almost all aspects of this thesis bears some imprint of his ideas.
Thomas Heldt has motivated our work on the pathophysiology of morphologic variability, and his suggestions on experiments to validate our theory represent an exciting area of future research. In addition, Thomas has been a source of encour-agement and during the course of this project, has grown to be a good friend.
I thank Roger Mark, George Moody, and the Physionet Group for contributing the Physionet database, which formed the starting point of our work. The work in this thesis also owes greatly to Barbara Liskov and the Programming Methodology Group at MIT. Their kindness in sharing computational resources was critical in helping us develop, refine and validate our work, and has allowed the scale of our project to expand significantly.
I would also like to thank James Glass, Hari Balakrishnan, Tommi Jaakkola, Samuel Madden, Michael Collins, Dina Kitabi, Srini Devadas, and Ronitt Rubinfeld for their many suggestions to improve various aspects of this work, and for their help in determining how best to communicate our findings to the rest of the scientific community. The presence of so many brilliant and friendly individuals is an aspect of MIT that continues to amaze even after all these years.
I am grateful to Adam Wolfberg for creating the opportunity for us to extend our work to fetal datasets. Adam has added an important dimension to our research, and helped evolve our vision of how computational methods can make a broad clinical impact. His enthusiasm while solving the hard problem of fetal risk stratification has been inspirational.
I am also indebted to Charles Vest, Danielle Guichard-Ashbrook, Humayun Bashir, Umer Shah, Salik Malik, and Mubasher Humayun. Their support and guidance en-abled me to return to MIT for my PhD, and I credit them with this work.
I take great pride in having been one of the initial members of the Data Driven Medicine Group, which has been a fabulous home for me over the years, and allowed me to meet some exceptional individuals. I owe a great deal both personally and professionally to Dorothy Curtis, Sheila Marian, Donna Kaufmann, John Ankcorn, Eugene Shih, Godfrey Tan, Irene Fan, Jenna Wiens, Anima Singh, Al Kharbouch, Daniel Leeds, Jason Gift, Marcia Jung, Joyatee Sarker, and Jennifer Carlisle. I also thank all the members of the Network and Mobile Systems group, who have shared many experiences with me for the last many years: Srikanth Kandula, Sachin Katti, Magda Balazinska, Michel Goraczko, Allen Miu, Kyle Jamieson, Hariharan Rahul, Vladimir Bychkovsky, Jaeyeon Jung, Nick Feamster, Bodhi Priyantha, and David Andersen.
I mention Phil Sung separately, for his contributions to this thesis are immense. He has been a close colleague over the last two years, and his brilliance and work ethic have led to significant improvements in the way that morphologic variability is measured. It was a pleasure working with him, and I sincerely hope our paths will cross again in the future.
Ali Shoeb appears late in this list, but only because he represents the bridge between my professional and social lives. I have enjoyed his company since the start of freshman year, taken nearly all of my classes at MIT with him, followed in his
example by joining the Harvard-MIT Health Sciences and Technology program, and shared an office with him for as long as I can recall. I have often marveled at the range and depth of Ali's knowledge, and his ability to explain things with pristine clarity. His contributions to this thesis are too many to recount, and his suggestions pervade all aspects of our work.
It would be impossible to mention all of my other friends at MIT, but I thank Ebad, Murtaza, Daanish, Rehan, Saad, Elena, Sarfraz, Faisal, Imran, and Adnan, in particular, for contributing ideas that have gone into improving the work presented in this thesis, and for making my academic career at MIT a pleasure.
Finally, I dedicate my efforts to my family, who have made many sacrifices to allow me to be where I am today. My parents have taught me to advance myself at every step of life, value integrity, work hard, and demonstrate a concern for others. I am eternally indebted for everything that they have empowered me to achieve. I also owe thanks to my wife, whose consistent support and encouragement during the later stages of my PhD have been an immensely valuable asset.
Contents
1 Introduction 1.1 Opportunities . ... 1.2 Challenges . ... 1.3 Proposed Solutions . ... 1.4 Clinical Application . ... 1.5 Contributions . ... 1.6 Organization of Thesis . ... 2 Background 2.1 Cardiac Function . ... 2.2 Electrocardiogram ...2.3 Acute Coronary Syndromes ...
2.4 Arrhythmias . ...
2.5 Post-ACS Risk Stratification ...
2.5.1 TIMI Risk Score ...
2.5.2 Echocardiography ...
2.5.3 Long Term ECG Techniques .
2.6 Summary ...
3 Morphologic Variability
3.1 Pathophysiology of Morphologic Variability
3.2 Measuring Morphologic Variability . . ..
3.2.1 ECG Signal Preprocessing . . . . .
9 49 50 52 54
. .
.
.
. .
. .
. . . . .
...
...
.
...
. .
3.2.2 ECG Segmentation and Removal of Ectopy ... . 55
3.2.3 Comparing ECG Beats ... ... 56
3.2.4 Morphologic Distance (MD) Time Series . ... 59
3.2.5 Spectral Energy of Morphologic Differences ... . 60
3.3 Evaluation of Morphologic Variability ... 63
3.3.1 Methodology ... ... . 63
3.3.2 Results ... ... 65
3.4 Other Applications of MV: Quantifying Treatment Effects . ... 72
3.5 Summary ... ... .. 73
4 Symbolic Analysis 75 4.1 Overview of Symbolization and Computational Physiology ... 76
4.1.1 Symbolization ... ... . 76
4.1.2 Computational Physiology ... . 77
4.1.3 Challenges ... ... .. 78
4.1.4 Our Approach ... ... . 79
4.2 Creating Symbolic Representations ... 80
4.2.1 Max-Min Clustering with Dynamic Time-Warping ... . 83
4.2.2 Evaluation ... ... .. 85
4.3 Symbolic Analysis ... ... 99
4.3.1 Pattern Discovery in Positive Examples . ... 100
4.3.2 Evaluation of Pattern Discovery in Positive Examples ... 110
4.3.3 Pattern Discovery in Positive/Negative Examples ... . 118
4.3.4 Evaluation of Pattern Discovery in Positive/Negative Examples 132 4.3.5 Symbolic Mismatch ... ... 134
4.3.6 Evaluation of Symbolic Mismatch . ... 139
4.4 Other Applications of Symbolic Analysis: Fetal Risk Stratification . . 144
4.5 Summary ... ... .. 149
5 Visualization of Long-Term Data 151 5.1 Visualizing Data as Symbolic Sequences . ... 151
5.2 Prototypical Representation of Biological Activity . ... 155
5.2.1 Prototype Construction ... .. 156
5.2.2 Evaluation ... ... . 159
5.3 Summary ... ... .. 163
6 Conclusion and Future Work 165 6.1 Summary ... ... .. 165
6.1.1 New Concepts ... ... 165
6.1.2 New Methods ... ... 167
6.1.3 New Clinical Results ... .. . 167
6.2 Conclusions ... ... 168
6.3 Future Work ... ... .. 169
List of Figures
2-1 Main components of the cardiac conduction system. . ... 33
2-2 Cardiac conduction pathway and corresponding ECG recording. . . . 36
2-3 Consequences of coronary thrombosis. . ... . . . 37
3-1 Healthy myocardium. ... . 51
3-2 Myocardium with islands of non-conducting or slowly conducting tissue. 51
3-3 Race conditions leading to variability in ECG morphology. ... . 51
3-4 Time-varying islands of non-conducting or slowly conducting tissue. . 52
3-5 ECG tracings from two patients. . ... . . 53
3-6 System for measuring morphologic variability. . ... . 53
3-7 Alignment of beats by dynamic time-warping. . ... . 57
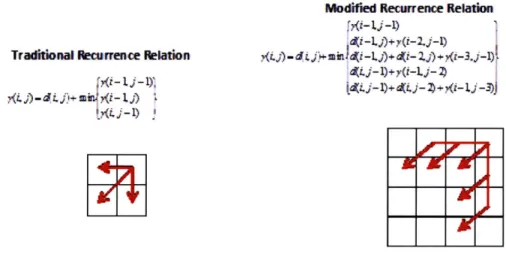
3-8 Traditional and modified recurrence relation of dynamic time-warping. 60
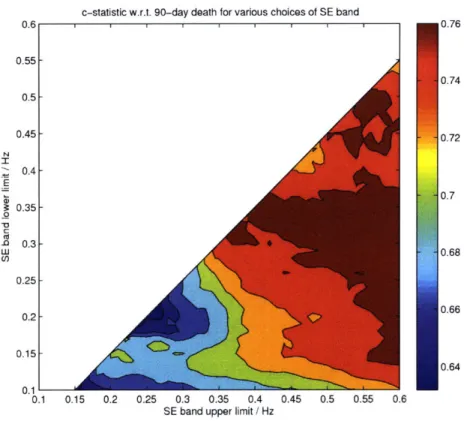
3-9 Heatmap showing c-statistic as a function of low- and high-frequency cutoffs. A maximum c-statistic value of 0.77 is obtained for the
fre-quency band 0.300.55 Hz. ... ... 62
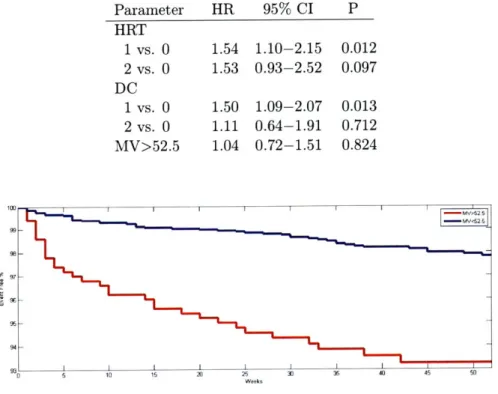
3-10 Kaplan-Meier survival curves for cardiovascular death in patients with
LV EF>40% ... . . . ... . . . . . . . 69
3-11 Kaplan-Meier survival curve for sudden cardiac death in patients with
LV EF>40% .. . . . .. . . . . . . . . .. 70
3-12 Kaplan-Meier survival curve for myocardial infarction in patients with
LVEF>40% ... ... 70
4-1 Parallel between the use of symbolization in computational biology and
4-2 Overview of symbolic analysis: (a) Raw data corresponding to Patient 106 in the MIT-BIH Arrhythmia Database. The red rectangle denotes a particular pattern hidden within the raw data. This pattern is diffi-cult to identify by visual examination of the original signal alone. (b) The raw ECG data is mapped into a symbolic representation (11 lines of the symbol sequence are elided from this figure). (c) An example rhythm of a repeating sequence, found in the symbolized representa-tion of a region of data corresponding to the boxed area of the raw data in (a). (d) An archetypal representation, created using the techniques
in Section 5.2, of the repeating signal. . ... 81
4-3 Histogram of clusters per patients: The number of clusters determined automatically per patient is distributed as shown, with a median value
of 22... ... . ... .. 86
4-4 Mislabeling Error: Over a quarter of the patients had no mislabel-ing errors usmislabel-ing our clustermislabel-ing approach, over 65% had less than 1%
mislabeled beats relative to cardiologist labels. . ... 91
4-5 Raw tracing of ECG for patient 213 in the MIT-BIH database with fusion of ventricular and normal beats: A sequence of ECG is shown containing beats labeled as both normal (N) and fusion (F). The mor-phological differences between the two classes of beats are subtle. This
excerpt corresponds to time 4:15 in the recording. . ... . . 92
4-6 Raw tracing of ECG for patient 124 in the MIT-BIH database with junctional escape beats: A sequence of ECG is shown containing both right bundle branch block (R) and junctional premature (J) beats. The morphological differences between the two classes of beats are again
4-7 Raw tracing of ECG for patient 115 in the MIT-BIH database with normal beats: A sequence of ECG is shown containing normal beats. This sequence represents an example where morphology-based analysis separates the beats into short (first 7 beats) and long (last three beats) classes. The beats still fall in the same clinical class, but this separa-tion, which indicates an abrupt change in heart rate, may potentially be of interest for the purpose of higher level analysis. This excerpt
corresponds to time 7:40 in the recording. . ... . . 93
4-8 Raw tracing of ECG for patient 106 in the MIT-BIH database with normal beats: (a) ECG corresponding to time 16:54 in the file. (b) ECG corresponding to time 21:26 in the file. Morphology-based anal-ysis places the beats shown in (a) and (b) into separate clusters based on changes in amplitude. ... . 93
4-9 A patient with ventricular bigeminy. ... 95
4-10 A patient with ventricular trigeminy. ... . . . 96
4-11 A rhythm of 4 units corresponding to an ectopic atrial rhythm... . 96
4-12 A patient with recurrent tachyarrhythmic episodes. These episodes ap-pear in the raw tracing as dense regions, corresponding to an increased number of heart beats during these periods owing to faster heart rate. 97 4-13 Raw ECG tracing, symbolic signal and entropy taken over 30 second windows for a patient with atrial fibrillation. As in Figure 14, atrial fibrillation in the raw tracings corresponds to the dense regions. . . . 98
4-14 Respiration and arterial blood pressure signals for a patient with pulsus paradoxus. ... . 98
4-15 ECG and arterial blood pressure signals for a patient in whom fast heart rate leads to increased arterial blood pressure. . ... 99
4-16 Prediction through conservation in the context of a population of pa-tients affected by a common acute clinical event . ... 100
4-17 Motifs of length 4, 10 and 16 found using TCM. . ... . 111
4-19 Motifs of length 4, 10 and 16 found using Consensus. . ... . 112
4-20 Motifs of length 4, 10 and 16 found using Gibbs2. . ... . . 114
4-21 Relation of the average contribution of each sequence to the log-odds
likelihood for the best scoring motif with increasing values of C. . . 114
4-22 Motifs of length 4 found using Consensus (top) and Seeded Consensus
(bottom). ... ... ... 115
4-23 Two-stage Gibbs2 motifs of length 4. The top motif comprises a work-ing set of size 12, while the second motif corresponds to those 11 se-quences (from a total population of 23) that were not included in the
original working set. ... ... 116
4-24 Motifs of length 4 found using Consensus (top) and Seeded Consensus
(bottom). ... ... ... 119
4-25 Overview of the pattern discovery process. . ... 121
4-26 In the absence of clustering there is significant redundancy between the Hamming radii of approximate patterns. Partitioning the data into disjoint clusters can help address this issue. In our work, we reduce the original approximate patterns into a small group with some overlap to
span the search space. ... ... 127
4-27 Calculating symbolic mismatch (SM) between two patients. ECG sig-nals are first symbolized using a Max-Min iterative clustering approach that employs a dynamic time-warping (DTW) distance measure to compare beat morphology. The resulting symbol centroids and prob-ability distribution over all symbol classes are used to obtain a final SM value measuring the long-term electrocardiographic dissimilarity
between the patients. ... ... 136
4-28 A hypothetical example of the SM calculation. . ... 137
4-29 Stages in the patient clustering process to determine high risk minority
groups that are population outliers. . ... 138
4-30 Kaplan-Meier survival curves for (a) death, (b) MI and (c) death/MI
4-31 Relation between morphologic entropy and IL-6 levels in cord blood (Y
= -59.13 + 55.67X; p = 0.019; standard error for coefficients = 17.38
and 11.93; RMSE = 7.68) ... ... 146
4-32 Relation between morphologic entropy and IL-8 levels in cord blood (Y
= -48.89 + 45.82X; p = 0.009; standard error for coefficients = 11.01
and 7.56; RMSE = 4.75) ... ... 146
4-33 Relation between morphologic entropy and NSE levels in cord blood (Y = -97.73 + 90.38X; p = 0.005; standard error for coefficients =
17.67 and 12.14; RMSE = 7.34) ... ... . 147
5-1 Screenshot of compact symbolic display of long-term ECG. ... . 153
5-2 Screenshot of simultaneous ECG information display. . ... 154
5-3 Decomposition of 0 into a, 0 and -y segments. Horizontal runs along the DTW distance matrix correspond to a-segments, vertical ones to
/-segments, and diagonal traversals to 7-segments. . ... 157
5-4 Hierarchical aggregation topology: The complete binary tree repre-sentation corresponds to a flat organization of observations that are
aggregated in a breadth-first manner in pairs. . ... 159
5-5 Example illustrating the limitations of RMSE and SNR as a measure
of error in the presence of time-skew. . ... . . 160
5-6 Synthetic ECG error: From top to bottom, the RMSE, MD, 1/SNR and DTWC of the ensemble average and prototype relative to the deter-ministic ECG signals are shown for different additive noise and warping levels (each cell corresponds to a different randomly generated set of observations). We use 1/SNR instead of SNR to display experiments
List of Tables
3.1 Baseline clinical characteristics for patients with and without available
data... ... ... 66
3.2 Correlation between different risk variables following dichotomization. 66
3.3 Association of risk variables with cardiovascular death in patients with
LVEF>40% (HR=hazard ratio, CI=confidence interval, P=P value). 67
3.4 Association of risk variables with cardiovascular death in patients with LVEF>40% after adjusting for the TIMI risk score (the TIMI risk score comprises the following predictors: age 65 years or older, at least 3 risk factors for coronary artery disease, prior coronary stenosis of 50% or more, ST-segment deviation on electrocardiogram at presen-tation, at least 2 anginal events in prior 24 hours, use of aspirin in prior 7 days, and elevated serum cardiac markers) (HR=hazard ratio,
CI=confidence interval, P=P value). . ... 68
3.5 Association of risk variables with sudden cardiac death in patients with
LVEF>40% (HR=hazard ratio, CI=confidence interval, P=P value). 68
3.6 Association of risk variables with sudden cardiac death in patients with LVEF>40% after adjusting for the TIMI risk score (the TIMI risk score comprises the following predictors: age 65 years or older, at least 3 risk factors for coronary artery disease, prior coronary stenosis of 50% or more, ST-segment deviation on electrocardiogram at pre-sentation, at least 2 anginal events in prior 24 hours, use of aspirin in prior 7 days, and elevated serum cardiac markers) (HR=hazard ratio,
3.7 Association of risk variables with myocardial infarction in patients with
LVEF>40% (HR=hazard ratio, CI=confidence interval, P=P value). 69
3.8 Association of risk variables with myocardial infarction in patients with LVEF>40% after adjusting for the TIMI risk score (the TIMI risk score comprises the following predictors: age 65 years or older, at least 3 risk factors for coronary artery disease, prior coronary stenosis of 50% or more, ST-segment deviation on electrocardiogram at presen-tation, at least 2 anginal events in prior 24 hours, use of aspirin in
prior 7 days, and elevated serum cardiac markers) (HR=hazard ratio,
CI=confidence interval, P=P value). ... 69
3.9 Characteristics of ECG variables in ranolazine and placebo group. .. 73
4.1 Beats detected for each patient in the MIT-BIT Arrhythmia database
using symbolization. To compactly display results we group the clinical
classes (Mis = mislabeled beat). ... .. 89
4.2 Summary comparison of detection through symbolization to
cardiolo-gist supplied labels. The labels used correspond to the original MIT-BIH Arrhythmia database annotations (N = normal, L = left bundle
branch block, R = right bundle branch block, A = atrial premature
beats, a = aberrated atrial premature beats, V = premature
ventricu-lar complex, P = paced beat, f = fusion of normal and paced beat, F
= fusion of ventricular and normal beat j = junctional escape beat).
The top row is indicative of how well the clustering did at identifying the presence of classes of clinical activity identified by the cardiologists for each patient. The bottom row indicates how well the clustering did
at assigning individual beats to the same classes as the cardiologists. 90
4.3 Summary comparison of detection through symbolization to
cardiolo-gist supplied labels for the MGH/MF Waveform database. The labels of the columns match those in Table 4.2 with J = junctional premature
4.4 Statistical significance of approximate patterns found on a training set of 765 post-NSTEACS patients (15 deaths over a 90 day follow-up period) when evaluated on a test population of 250 patients (10 deaths). 134 4.5 Time taken by the LSHCS and NoSeqStats pattern discovery
algo-rithms on the cardiovascular training dataset. . ... . . 134
4.6 Association of risk variables with death in univariate and multivariate
analyses (n=686). ... . ... 140
4.7 Association of risk variables with MI in univariate and multivariate
analyses (n=686) ... ... 140
4.8 Association of risk variables with death/MI in univariate and
multi-variate analyses (n=686). ... ... 142
4.9 Percentage of patients with events in five largest clusters in the high
SM risk group relative to low SM risk group. . ... . . . 143
4.10 Percentage of patients with events in aggregate of five largest clusters
in high SM risk group compared to low SM risk group. . ... . 144
4.11 HRV metrics for subjects. Mean heart rate (Mean HR) and the stan-dard deviation of the heart rate (STD HR) are also provided for each
subject. . ... ... 148
Chapter 1
Introduction
In this thesis, we present novel ways to improve medical care by using sophisticated computational methods to analyze clinical data. A rough problem statement for our work is to develop automated tools for the prediction of future health and treatment efficacy. There are two aspects to this: discovering knowledge from large multi-signal datasets collected from a population of patients, and applying this knowledge to de-veloping automated methods for improved prognosis and intervention. This research uses techniques drawn from machine learning, data mining, applied algorithms, and signal processing; as well as an understanding of the underlying biological systems.
1.1
Opportunities
Our work is motivated by the increasing amounts of continuous long-term primary data available for patients in hospital and ambulatory settings. With advances in recording and storage technology, we are now able to collect larger volumes of data than was previously possible. This increase in available data has taken place both at the level of individual patients (i.e., with more types of data now being captured over longer periods), and at the level of the population as a whole (i.e., more patients being monitored with ambulatory devices).
These large physiological datasets present an opportunity to advance medical care along different dimensions. Monitoring many different patients continuously over long
periods (i.e., from hours to weeks) increases the likelihood of discovering previously unknown phenomena, and helps provide fresh insights into disease dynamics over long time scales. We can therefore use continuous long-term data to discover new medical knowledge. In addition to this, continuous monitoring also makes it possible to observe known but rare events that would otherwise be missed if patient health was assessed in a point-in-time manner (e.g., patients who have hypertensive episodes at night are routinely missed by blood pressure measurements in the doctor's office [2]). We can therefore use continuous long-term data to apply known medical knowledge better. Both the discovery of new knowledge and the ability to apply knowledge better allow patients to be matched to therapies that are most appropriate for their risk.
1.2
Challenges
Despite the opportunities provided by large amounts of continuous long-term data, the sheer volume of information is a serious challenge. Patients in an ICU setting, for example, often have continuous streams of data arising from telemetry monitors, pulse oximeters, Swan-Ganz catheters, and arterial blood gas lines to name just a few sources. Any process that requires humans to examine more than small amounts of data is infeasible and often highly error prone. To put things in perspective, the electrocardiographic (ECG) signals from a single patient admitted to a hospital following a heart attack would fill 8,000 pages. It is therefore not surprising that errors have been associated with "information overload" and that clinically relevant events are often missed [70, 71].
Unfortunately, existing software systems are also largely inadequate for studying large physiological datasets. First, existing software systems focus largely on detec-tion and are restricted in their ability to do broad knowledge discovery and identify previously unrecognized activity. They do not exploit the opportunity provided by large physiological datasets to discover new medical knowledge. What work there has been has largely focused on the analysis of categorical data (e.g., health records) or
nucleotide sequences, and has not addressed the challenge of studying large datasets comprising continuous time-series signals.
Secondly, existing software systems are limited in their ability to apply medical knowledge. In particular, the choice of which detectors to apply to continuous data is based on assumptions about which events are most likely to occur (e.g., the use of arrhythmia monitors following a heart attack). This limits their ability to detect even known events that were not considered probable ahead of time.
Another challenge while working with continuous long-term signals is that of effi-ciency. The process of collecting data sampled at high frequencies over long periods (i.e., days to weeks) for thousands of patients leads to very large datasets. Analyzing these datasets with complex methods is computationally intractable. This creates the need for methods that are both robust and efficient.
1.3
Proposed Solutions
We propose two broad areas of complementary research for studying information in large physiological datasets. Our methods address the goals of both discovering and applying medical knowledge, and are intended to promote personalized medicine through more accurate risk stratification and the choice of interventions that are consistent with each patient's individual risk. Our methods achieve computational efficiency through use of algorithmic improvements and abstraction to reduce data.
At an abstract level, we view interesting activity in physiological signals as vari-ability at different scales.
Morphologic variability focuses on the micro-level changes in continuous signals, and quantifies subtle variability in signals over long periods. This is intended as a way to measure instability in the underlying physiological system.
Symbolic analysis, looks at the macro-level information in signals by abstracting them into symbolic sequences and studying the resulting textual representations of the time series signals for interesting higher-level constructs.
to obtain clinically significant results.
1.4
Clinical Application
While the computational methods we develop in this thesis are applicable to signals from many different physiological systems, and potentially to data from non-medical applications, we present and evaluate these tools in the context of cardiovascular disease. There are a variety of factors that led us to this decision.
Cardiovascular disease is a key clinical area. According to the statistics reported for 2005, there were 864,500 deaths in the US due to cardiovascular disease [72], corresponding to 35.5% of all deaths. For the same period, an estimated 17.5 million people died from cardiovascular disease around the world (30% of all global deaths) [3]. Nearly 151,000 individuals in the US who experienced cardiovascular mortality in 2005 were under age 65, well below the average life expectancy of 77.8 years [72]. The associated direct and indirect costs of dealing with cardiovascular disease was $475.3 billion [72].
One of the challenges of modern cardiovascular medicine is to supplement ad-vances in therapy with similar adad-vances in diagnostics. An example of the present divide between treatment and diagnostics is provided by implantable cardioverter de-fibrillators (ICDs) [73]. These devices are typically given to the patients believed to be at the greatest risk, and have great value in reducing deaths when serious arrhyth-mias occur. However, according to some estimates, 90% of the patients who received ICDs never end up using these devices [73]. This represents a major inefficiency and danger, since these devices are expensive and require a surgical procedure (with a 1% operative risk of death) for implantation. At the other end of the spectrum are the hundreds of deaths that take place each day of patients who were truly at high risk of fatal arrhythmias, but were not correctly categorized and did not receive an ICD. Our work attempts to remedy this kind of situation, by using sophisticated computational methods to analyze large amounts of cardiovascular data to identify high (or low) risk patients.
The majority of our work focuses on a specific kind of cardiovascular signal, i.e., the electrocardiogram (ECG). This follows from the availability of large datasets of ECG signals collected routinely during hospitalization and clinical trials. Access to these signals and detailed follow-up data for patients has helped us rigorously evaluate our methods. The choice of ECG signals is also motivated by the fact that these signals have been extensively studied in the past. It is thus possible to demonstrate how sophisticated computational methods can be used to yield novel information even from well-studied sources of data. Finally, ECG signals are often collected for many days by ambulatory monitors. This has allowed us to demonstrate the utility of studying data collected over long periods of time using the right tools.
1.5
Contributions
We briefly review some of the major contributions of our work. A more detailed discussion on the different contributions made by our work is deferred to subsequent parts of the thesis.
* Concept of Morphologic Variability: We propose the concept of morpho-logic variability, and introduce the idea that subtle variations in the shape of physiological signals, which are often widely considered to be noise, contain important information about the health of the underlying system.
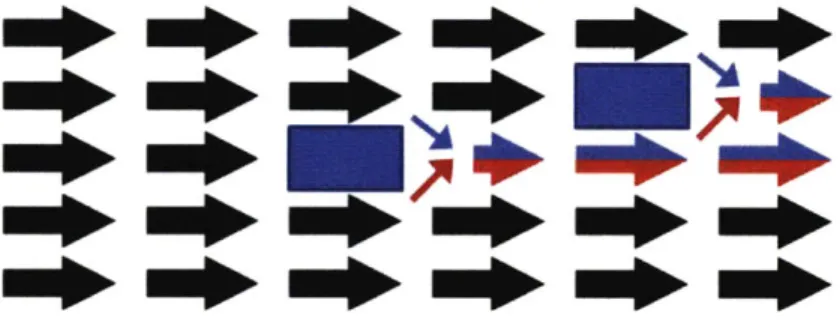
* Method to Measure Morphologic Variability: We develop a method to measure morphologic variability, which addresses the challenge of quantifying subtle pathological variability in noisy signals with time-skew. Our algorithm uses a modified dynamic time-warping approach to compare variations in mor-phology between consecutive beats, and the Lomb-Scargle periodogram to iden-tify a spectral signature for these variations that corresponds to high risk.
* Clinical Study of Morphologic Variability: We conducted a clinical study on data from over 4,500 patients, and show that morphologic variability has
considerable predictive value in the setting of cardiovascular disease. For exam-ple, patients with high morphologic variability are at a 6-7 fold increased risk of death in the three months following a heart attack. Moreover, the informa-tion in morphologic variability is independent of other generally accepted risk variables (e.g., echocardiography and other electrocardiographic metrics) and morphologic variability is a better predictor of death than almost all of these variables. In particular, it has great value in identifying patients who are missed by echocardiography, which is widely used to identify a small high risk group of patients but may miss over two-thirds of all deaths [1].
* Concept of Physiological Symbolic Analysis: We propose the concept of physiological symbolic analysis, i.e., representing and searching through con-tinuous physiological waveform signals as textual data rather than real-valued time-series. We develop a symbolic analysis framework that allows for physio-logical datasets to be studied in a manner analogously to nucleotide data. * Method to Symbolize Physiological Signals: We present an efficient
Max-Min clustering-based algorithm for symbolization, and demonstrate this trans-formation preserves useful clinical intrans-formation while making the data easier to analyze. We show how different analyses on symbolic representations can be used to detect various kinds of interesting activity, e.g., searching for approx-imate repeated sequences finds ventricular bigeminy and trigeminy; searching for statistically overrepresented patterns reveals tachyarrhythmias; and locating high entropy periods detects atrial fibrillation. We also demonstrate how these methods can be used to find kinds of complex activity that often go unnoticed in clinical practice, e.g., atrial ectopic rhythms.
* Method for Discovering Predictors of Acute Events in Symbolic Data: We present novel methods that can be used to discover predictors of acute events in an automated manner, by searching for approximate symbolic patterns that occur more often preceding events than one would expect by chance alone. We approach pattern discovery as a significance and classification problem, and use
the ideas of locality sensitive hashing (LSH), multi-level Gibbs sampling, and sequential statistics to make the search for interesting activity more efficient.
* Clinical Study of Predictor Discovery: We demonstrate the utility of our methods to discover predictors of acute events, both for detecting markers as-sociated with long-term risk and for markers asas-sociated with imminent acute events (e.g., sudden cardiac death). In a small study of patients who expe-rienced sudden cardiac death, our algorithms correctly predicted 70% of the deaths while classifying none of the normal individuals and only 8% of the patients with supraventricular arrhythmias as being at risk.
* Method for Comparative Risk Stratification with Symbolic Data: We develop an algorithm to compare the long-term symbolic dynamics of patients by measuring the probability-weighted mismatch of symbol prototypes across patients to assess similarity. We present a second, clustering-based algorithm that uses this similarity information to partition patients into groups with sim-ilar risk profiles.
* Clinical Study of Comparative Risk Stratification with Symbolic Data: We evaluated our comparative methods on cardiac data to partition patients with cardiovascular disease into groups, and found that different groups of pa-tients exhibit a varying risk of adverse outcomes. One group, with a particular set of time-series characteristics, showed a 23 fold increased risk of death in the months following a mild heart attack, while another exhibited a 5 fold in-creased risk of future heart attacks. This potentially allows more fine-grained risk assessment of patients.
* Concept of Visualizing Physiological Signals as Symbolic Sequences: We propose the concept of visualizing large amounts of continuous monitoring data as a sequence of symbols rather than raw samples, and develop tools to vi-sualize continuous long-term signals. Looking at physiological data as symbolic sequences provides many advantages over visualizing raw samples. It results
in a large decrease in the number of data points that need to be visualized, makes it easier to see when changes occur, and makes the data more readily interpretable. Our software supports visualizing continuous long-term signals as symbols, while retaining information (in the form of prototypes and even the raw data) that is available to users interested in looking at waveforms.
Concept and Method of Creating Prototypical Signals Averaged in Amplitude and Time: We develop the idea of creating prototypical rep-resentations of physiological activity. In contrast to conventional aggregation approaches, which average the amplitude of multiple observations, we propose creating a signal where the duration of each physiological waveform was also averaged in time. We also propose an algorithm to create prototypical sig-nals from noisy, time-skewed observations, by relating time-warped information across observations and combining data hierarchically while preserving length characteristics. We demonstrate how these prototypes can be used for both data visualization, and for robust decision making.
1.6
Organization of Thesis
The remainder of this thesis is organized as follows. Chapter 2 presents background on the heart and the ECG signal. Chapter 3 introduces the concept of morphologic variability and evaluates its use to identify high risk cardiovascular patients. Chapter
4 presents and evaluates symbolic analysis of large datasets of physiological signals.
Chapter 5 describes tools to compactly visualize interesting activity over long pe-riods of continuous patient monitoring. Chapter 6 concludes with a summary and discussion of future work.
Chapter 2
Background
In this chapter, we review the clinical background for our work. We start with a discussion of the normal anatomy and function of the heart in Section 2.1. We focus, in particular, on aspects of cardiac function related to electrophysiology. This is followed by a presentation of the normal electrocardiogram (ECG) signal in Section 2.2. Cardiovascular pathophysiology is then reviewed in Sections 2.3 and 2.4, which describe acute coronary syndromes (ACS) and arrhythmias respectively. Finally, we present a summary of existing methods to identify high risk patients in Section 2.5.
This material provides context for our work. The methods introduced in this thesis have largely been validated on ECG data from post-ACS patients, some of whom experience fatal arrhythmias. Readers may therefore find a discussion of the electrocardiogram, acute coronary syndromes, and arrhythmias to be helpful. Those readers already knowledgeable about these topics may want to skip to Section 2.5.3, which provides a review of existing methods to identify high risk cardiac patients. We compare our work with these methods later in this thesis.
This chapter borrows heavily from the discussion of these subjects in [68, 69].
2.1
Cardiac Function
The heart has four separate compartments or chambers. The upper chambers on either side of the heart, which are called atria, receive and collect the blood coming
to the heart. The right atrium receives blood from the inferior and superior vena cava and the left atrium is supplied by the pulmonary veins. The atria then deliver blood to the powerful lower chambers, called ventricles, which pump blood away from the heart through powerful, rhythmic contractions. Blood leaves the right ventricle through the pulmonary artery and similarly, the left ventricle is connected to the aorta. The first branches of the aorta are small arteries known as the coronary arteries. These supply blood to the heart itself.
The heart circulates blood via the coordinated action of its chambers. Each heart-beat can be divided into two main stages: systole and diastole. During systole, the atria first contract, pushing a small fraction of their volume of blood into the ven-tricles to fill them to maximum capacity. This is followed by the contraction of the ventricles, which pushes blood out of the heart and into the pulmonary artery and the aorta. Diastole takes place once systole is complete. During this period, both the atria and ventricles are relaxed, and continue to fill with blood till the next systole occurs.
At rest, the heart beats roughly about 70 times per minute, with each beat having a corresponding duration of approximately 800 ms. The heart rate and the duration of each beat vary significantly among individuals and may also have different values for the same person depending on the activity being performed. The periodic pumping action of the heart results in the unidirectional flow of blood through the human body, and is known as the cardiac cycle. This process is coordinated by the orderly propagation of electrical impulses throughout the myocardium, or heart muscle, which causes these cells to contract.
In the remainder of this section, we focus on the electrophysiology of the heart. The normal conduction system of the heart is pictured in Figure 2-1. A wave of depolarization (i..e, a temporary reversal of the cell membrane voltage) begins in the sinoatrial (SA) node, which contains pacemaker cells that spontaneously produce electrical impulses. From there, depolarization spreads throughout the atria, causing them to contract. The wave then reaches the atrioventricular (AV) node. This is the only connection between the conduction systems of the atria and the ventricles,
Figure 2-1: Main components of the cardiac conduction system. From Lilly [95].
which are elsewhere separated by insulating fibrous tissue. The AV node consists of specialized tissue that conducts slowly, so it delays electrical impulses that pass through it for a short time (about 0.1 sec). This delay is important for efficient circu-lation because it allows the atria to completely empty their blood into the ventricles before the ventricles begin to contract. Finally, the wave of depolarization spreads throughout the ventricles by way of the Bundle of His and the left and right bundle branches, causing the ventricles to contract.
The electrical activity of the heart is associated with different changes at the cellular level. The membrane of a myocardial cell contains ion channels, specialized
proteins that span the cell membrane and regulate the movement of specific ions across
the membrane [95]. Different types of ion channels are selective for different kinds of ions, allowing only ions of a specific type to pass. In addition, the conformation of ion channels changes with the membrane voltage difference to allow (or block) the diffusion of ions. Ion channels act as voltage-regulated passive gates for ions: the flow of ions through ion channels is determined by the concentration gradient and by the
electrical potential difference (voltage) across the membrane. Cell membranes also
contain active ion pumps, which consume energy in the form of adenosine triphosphate (ATP) to pump ions across a membrane against their natural gradient.
In a cardiac cell at rest, the ion channels and ion pumps together maintain a
ions out of the cell and K+ ions into the cell. If the membrane voltage goes above approximately -70 mV, an action potential begins. Some sodium ion channels open, allowing Na+ ions to enter the cell, raising the potential inside, causing more sodium ion channels to open, and so on, creating a positive feedback loop. The cell quickly (within milliseconds) becomes depolarized and reaches a peak voltage of slightly more than 0 mV. This voltage is high enough to raise the membrane voltage in a nearby area of the cell or a neighboring cell, causing the action potential to propagate.
At the peak voltage, the sodium channels close and remain inactivated until the cell has returned to resting potential (as described below). In healthy myocardial tissue, this refractory period prevents recently depolarized cells from depolarizing again, regardless of the membrane voltage. This ensures that the wave of depolariza-tion propagates forward and never backward.
The cell now begins the process of repolarization in order to prepare for the next action potential. When the membrane voltage becomes high enough, the potassium
and calcium channels open, allowing K+ and Ca+ + ions to flow out of and into the
cell, respectively. Calcium ions entering the cell during this phase activate a pathway that induces the physical contraction of cardiac muscle cells. Finally, the original concentrations of each ion, and the resting potential, are restored by ion pumps in order to prepare the cell for another action potential.
Abnormal cardiac depolarization and repolarization may lead to fatal arrhythmias, as will be discussed in Section 2.4. We believe that the techniques presented in this thesis can help detect problems with the electrical system of the heart, and quantify the extent of any present abnormalities.
2.2
Electrocardiogram
An electrocardiogram (ECG) is a recording of the electrical activity of the heart. ECG data is routinely recorded for hospitalized patients, since it is useful for both monitoring them and diagnosing conditions such as ACS or arrhythmias. ECG can be acquired inexpensively and with minimal invasiveness; a Holter monitor (a portable
ECG device worn on a patient) can record data for 24 hours or more. Therefore, ECG data is useful for analysis of rare and noisy phenomena. Depending on the setting and on the reason for the recording, varying numbers of electrodes may be used in order to capture a varying number of channels of data. Typical ECG monitors record between 1 and 12 channels.
A cardiac muscle cell at rest maintains a negative voltage with respect to the outside of the cell. While at rest, the surface of the cell is uniformly charged with a positive voltage, but during depolarization, this voltage decreases and may even become negative. Consequently, when depolarization is propagating through a cell, there exists a potential difference on the membrane between the part of the cell that has been depolarized and the part of the cell at resting potential. After the cell is completely depolarized, its membrane is uniformly charged again (although now negatively instead of positively).
These changes in potential, summed over many cells, can be measured by elec-trodes placed on the skin. For any pair of elecelec-trodes, a voltage is recorded whenever the direction of depolarization (or repolarization) is aligned with the line connecting the two electrodes. The sign of the voltage indicates the direction of depolariza-tion, and the axis of the electrode pair is termed the lead. Multiple electrodes along different axes can be used so that the average direction of depolarization, as a three-dimensional vector, can be reconstructed from the ECG tracings. However, such multi-lead data is not always available, especially in the case of ambulatory monitors that maximize battery life by reducing the number of electrodes used. Much of our work in this thesis is therefore designed for the single ECG lead case. As we show in subsequent chapters, there is sufficient information even within a single lead of ECG to risk stratify patients.
Three major segments can be identified in a normal ECG, corresponding to dif-ferent parts of the action potential. Schematics of the cardiac conduction pathway and a typical ECG recording are shown in Figure 2-2. The P wave is associated with depolarization of the atria. The QRS complex is associated with depolarization of the ventricles. The T wave is associated with repolarization of the ventricles. The QRS
AV node Bunde of SA node bunde branch (postrior CR8 branch 4 4 Left bundle A dision) B 12 3 4
Figure 2-2: Cardiac conduction pathway, with corresponding waveforms on the ECG recording. The electrical impulse begins at the SA node (1). The wave of depolariza-tion traverses the atria (2). Conducdepolariza-tion is slowed at the AV node (3). The wave of depolarization traverses the ventricles (4). From Lilly [95].
complex is larger than the P wave because the ventricles are much larger than the atria. The QRS complex coincides with repolarization of the atria, which is therefore usually not seen on the ECG. The T wave has a larger width and smaller amplitude than the QRS complex because repolarization takes longer than depolarization.
2.3
Acute Coronary Syndromes
We follow the earlier discussion of normal cardiac function and electrophysiology with brief review of cardiac pathophysiology. In particular, we focus on acute coronary syn-drome (ACS), an umbrella term covering clinical symptoms compatible with reduced blood supply to the heart (i.e., myocardial ischemia). Heart attacks and unstable angina are included in this group.
An acute coronary syndrome (ACS) is an event in which the blood supply to part of the myocardium is blocked or severely reduced. The most common symptom of ACS is unusual and unprovoked chest pain, but this may often be absent (most notably
Coronary thrombus
Small thrombus Partially occlusive Occlusive
(non-flow-limiting) thrombus thrombus (Prolonged
ischemia) ischemia)
No ECG ST segment
changes depression and/or ST elevation
ST
wave inversion (Q waves later)Healing and - Serum + Serum + Serum
plaque enlargement biomarkers biomarkers biomarkers
Unstable angina Non-ST-segment ST-segment
elevation MI elevation MI
Figure 2-3: Consequences of coronary thrombosis. From Lilly [95].
in patients with diabetes who experience "silent" heart attacks). Other symptoms include shortness of breath, profuse sweating, and nausea.
An ACS is usually caused by the rupture of an atherosclerotic plaque producing a blood clot within a coronary artery. This restricts blood flow to the heart, causing ischemia and potentially cell death in the myocardium. Various subclassifications of ACS are distinguished by the presence of myocardial necrosis (cell death) and by ECG diagnosis. An overview of these subclassifications is shown in Figure 2-3.
Unstable angina refers to an ACS event in which necrosis does not occur, while myocardial infarction (MI) refers to one in which it does. An ACS is also sub-classified based on the extent to which the coronary artery is occluded, which can often be inferred noninvasively from ECG recordings. An ECG showing elevation in the ST segment is indicative of complete occlusion of an artery and necrosis (and therefore, myocardial infarction). Such patients are given a diagnosis of ST-elevation MI (STEMI) and are typically higher risk relative to patients with non-ST-elevation
ACS.
Non-ST-elevation ACS (NSTEACS) is indicative of partial occlusion of an artery and is a less severe condition. NSTEACS may be diagnosed by the presence of certain ECG irregularities (ST depression or T wave inversion). Two subclasses of
NSTEACS, unstable angina and a non-ST-elevation MI (NSTEMI), are distinguished by whether necrosis occurs. Blood tests are used to determine levels of two serum biomarkers, cardiac-specific troponin and creatine kinase MB (CK-MB), which are chemicals released into the bloodstream when myocardial necrosis occurs.
Treatment for NSTEACS focuses on inducing the dissolution of blood clots by natural pathways (via aspirin or heparin), and on reducing ischemia by lowering the heart's oxygen demand and raising oxygen supply. Drugs that dilate blood vessels (nitrates) or lower heart rate (Q-blockers) are commonly employed. STEMI patients may benefit from the same treatments, but they also receive more aggressive throm-bolytic drugs to break down blood clots and restore normal blood flow. Percutaneous coronary intervention (PCI) and coronary artery bypass graft (CABG) may also be conducted, either immediately or after the patient's condition has stabilized.
2.4
Arrhythmias
An ACS may leave damaged or scarred heart tissue, which can interfere with the heart's electrical conduction system. This may lead to arrhythmias, i.e., abnormal heart rhythms. The heart may beat too fast or too slowly, and may be regular or irregular.
Some arrhythmias are life-threatening medical emergencies that can result in car-diac arrest and sudden death. Others cause symptoms such as palpitations, while still others may not be associated with any symptoms at all, but predispose toward po-tentially life-threatening stroke or embolus. Arrhythmias are generally classified into two groups: tachyarrhythmias (where the heart beats too quickly) and bradyarrhyth-mias (where the heart beats too slowly). These may arise from irregularities in the generation of action potentials, or in the conduction of action potentials through the myocardium.
The generation of action potentials is usually the job of the SA node. In abnormal situations, other parts of the heart may start to spontaneously depolarize (leading to tachyarrhythmias) or impulse generation may be impaired (leading to
bradyarrhyth-mias). Typically, a bradyarrhythmia stemming from impaired impulse generation is not a life-threatening situation, because the myocardium contains multiple regions of tissue that have the potential to spontaneously depolarize; these act as "backup" pacemakers if impulse generation at the SA node becomes too slow.
Major conduction pathway alterations can also lead to arrhythmias. A conduc-tion block arises when a region of unexcitable tissue stops the wave of depolarizaconduc-tion entirely, preventing part of the heart from contracting. Reentry is a phenomenon in which a wave of depolarization travels around a closed-loop conduction path, some-times around an island of unexcitable or slowly conducting tissue. The wave of depolarization becomes self-sustaining, leading to a tachyarrhythmia.
One of the most serious arrhythmias is ventricular fibrillation (VF), which is associated with chaotic and rapid twitching of the ventricles without any effective pumping of blood through the heart. This may lead to cardiac arrest (i.e., failure of the heart to circulate blood around the body effectively) and death if not promptly treated. Ventricular fibrillation occurs because of a reentrant conduction pattern in the ventricles (as a parallel, reentry in the atria may lead to atrial flutter and atrial fibrillation).
Arrhythmias may be treated by drugs that raise or lower the heart rate, or by other more invasive interventions such as ablation of reentry pathway tissue. A persistent bradyarrhythmia may be treated by the implantation of an artificial pacemaker. An artificial pacemaker applies electrical stimulation to induce depolarization at a desired rate, preempting the heart's (too slow) natural pacemaker.
A tachyarrhythmia caused by reentry may be an emergency situation since it may lead to cardiac arrest. Such a condition is treated by the application of an electrical current across the chest. This depolarizes the entire myocardium so that reentrant patterns are interrupted. The heart's natural pacemaker then resumes control of heart rhythm. This technique is called defibrillation in the case of ventricular fibril-lation. In other cases, the discharge has to be synchronized with the QRS complex in order to avoid inducing ventricular fibrillation; in these cases, this technique is called
Patients at high risk of tachyarrhythmias may receive an implantable cardioverter-defibrillator (ICD). This is a device implanted within the thoracic cavity, with leads to the ventricles, that may detect aberrant heart rhythms and apply electrical shocks to restore normal rhythm.
2.5
Post-ACS Risk Stratification
Since patients who experience ACS remain at an elevated risk of death, even after receiving treatment [27], post-ACS risk stratification is an important clinical step in determining which patients should be monitored and treated more (or less) aggres-sively. This section provides background information on post-ACS risk stratification methods. We consider the TIMI risk score (TRS), echocardiography, and long-term ECG-based techniques.
The TRS [106, 107, 108] provides a general assessment of risk based on clinical vari-ables that can easily be obtained at the time of admission. The varivari-ables considered by the TRS represent seven significant independent predictors of risk. Echocardiogra-phy is a technique for imaging the heart using ultrasound; it yields information about blood flow in the heart as well as the shape of the heart. As described in Section 2.3, ECG data may also be used to diagnose the severity of an ACS at the time of presentation and is typically used to guide immediate treatment.
Each of the techniques considered here incorporates some information about a patient and yields a number that can be used to estimate the patient's risk. For example, higher values of the TRS are associated with higher risk. We evaluate the utility of these risk stratification techniques using two metrics. The c-statistic, or area under the receiver operating characteristic (ROC) [116], identifies the degree to which progressively higher values of a continuous variable are associated with an increased risk of adverse events. The Cox proportional hazards regression model, in contrast, estimates the relative ratio of the instantaneous rate of death (i.e., the hazard ratio) between different groups defined by a discrete variable. This may be useful when treatments are chosen based on a dichotomized value of a particular variable, e.g.,
![Figure 2-1: Main components of the cardiac conduction system. From Lilly [95].](https://thumb-eu.123doks.com/thumbv2/123doknet/14437663.516332/33.918.307.611.124.358/figure-main-components-cardiac-conduction-lilly.webp)