Publisher’s version / Version de l'éditeur:
ECS Transactions, 25, 2, pp. 1341-1350, 2009
READ THESE TERMS AND CONDITIONS CAREFULLY BEFORE USING THIS WEBSITE.
https://nrc-publications.canada.ca/eng/copyright
Vous avez des questions? Nous pouvons vous aider. Pour communiquer directement avec un auteur, consultez la
première page de la revue dans laquelle son article a été publié afin de trouver ses coordonnées. Si vous n’arrivez pas à les repérer, communiquez avec nous à [email protected].
Questions? Contact the NRC Publications Archive team at
[email protected]. If you wish to email the authors directly, please see the first page of the publication for their contact information.
Archives des publications du CNRC
This publication could be one of several versions: author’s original, accepted manuscript or the publisher’s version. / La version de cette publication peut être l’une des suivantes : la version prépublication de l’auteur, la version acceptée du manuscrit ou la version de l’éditeur.
For the publisher’s version, please access the DOI link below./ Pour consulter la version de l’éditeur, utilisez le lien DOI ci-dessous.
https://doi.org/10.1149/1.3205663
Access and use of this website and the material on it are subject to the Terms and Conditions set forth at
Effective transport coefficients for porous microstructures in solid oxide fuel cells
Choi, Hae-Won; Berson, Arganthaël; Kenney, Ben; Pharoah, Jon G.; Beale, Steven; Karan, Kunal
https://publications-cnrc.canada.ca/fra/droits
L’accès à ce site Web et l’utilisation de son contenu sont assujettis aux conditions présentées dans le site LISEZ CES CONDITIONS ATTENTIVEMENT AVANT D’UTILISER CE SITE WEB.
NRC Publications Record / Notice d'Archives des publications de CNRC:
https://nrc-publications.canada.ca/eng/view/object/?id=90b3a4d5-63e4-4429-a9aa-bbe7eec2f413 https://publications-cnrc.canada.ca/fra/voir/objet/?id=90b3a4d5-63e4-4429-a9aa-bbe7eec2f413
Effective Transport Coefficients for
Porous Microstructures in Solid Oxide Fuel Cells
Hae-Won Choia, Arganthaël Bersona, Ben Kenneya, Jon G. Pharoaha, Steven Beale b, and Kunal Karana a
Queen's-RMC Fuel Cell Research Centre, 945 Princess St. Kingston, ON, K7L 5L9, Canada
b
National Research Council, Montreal Rd, Ottawa, ON, K1A 0R6, Canada
A numerical framework to compute the effective transport coefficients for porous electrode microstructures is presented. The anode and cathode electrodes of solid oxide fuel cells are discretized as porous microstructures that are formed by randomly distributed and overlapping spheres with particle size distributions that match those of actual ceramic powders. The technique involves the construction of the composite electrode microstructure based on measureable starting parameters and the subsequent numerical evaluation of the effective transport coefficients. We use both the finite volume method and the Monte-Carlo simulation to enumerate effective transport coefficients. The results of the calculations are compared with experimental data for electron conductivities for a range of solid-matrix compositions. Comparisons are also made with theoretical correlations for effective coefficients. The effect of Knudsen diffusion on effective gas diffusivity is also addressed in this paper. Numerical results are compared with a harmonic average approximation based on Bosanquet’s formula.
Introduction
Research and development of solid oxide fuel cell (SOFC) technology have been pursued in recent years due to their potential advantages over conventional electricity power generation as they promise to have high electrical efficiency, fuel flexibility, low emissions, low noise, and high reliability (21). Commercial applications of SOFCs have been demonstrated by the operation of more than 125 kW combined heat and power SOFC cogeneration system by Siemens Power Generation (22), operating on natural gas at atmospheric pressure, with electrical efficiency up to 47% at full load. An overall system energy efficiency of more than 80% can be expected, assuming steam/hot water or other cogeneration. The present focus for SOFC technology is to maintain a high power density and reduce the system cost. This requires further development of the cell technology, especially an improvement of the electrodes. To optimize the design of a given electrode, repetitive procedures for testing prototypes are necessary. To circumvent the high cost of manufacturing and testing a number of prototype cells, computer based modeling techniques, recently reviewed in (12), play an important role in improving the design and optimization for performance enhancement.
ECS Transactions, 25 (2) 1341-1350 (2009) 10.1149/1.3205663 © The Electrochemical Society
It has long been recognized that microstructural features affect the cell performance by influencing the rates of the processes in the porous electrodes. Features such as the particle size distribution, composition and porosity can influence important microstructural parameters including the total and active triple phase boundary length, the gas-solid internal surface area, the tortuosity and the pore size distribution. Until recently, modeling techniques have averaged these microstructural features and assumed that the electrodes are homogeneous, relying on correlations to describe the transport of gas and charged species through the porous electrodes. Real SOFC electrodes may have a wide distribution of pore sizes and highly tortuous networks of solid/pore phases, which are influenced by the microstructural features and may not be captured by these correlations. Experimental techniques (7,9,16,28,31) have been used for measuring effective conductivities and diffusivities. These experiments can be difficult and time consuming and are ultimately limited to a small range of microstructures.
From a mathematical modeling point of view, it is important to exploit well-constructed microstructures and their transport properties for porous anode and cathode electrodes used in SOFCs. Previous work has been focused on developing representative anode and cathode geometries through numerical construction of porous microstructures that are formed by randomly distributed and overlapping spheres. These numerical constructions can have microstructures that match closely with real electrodes (15). Triple phase boundary length, internal surface area, pore size distribution and the percolation of all relevant phases within the porous composite electrodes were computed directly from numerical electrode construction. Nevertheless, techniques for systematically evaluating the effective transport coefficients on complicated microstructures are non trivial. In this paper, we present numerical frameworks to compute the effective transport coefficients efficiently and accurately for realistic porous electrode microstructures. These properties can directly be used to obtain performance calculations for transport phenomena in porous electrodes (4,5,6,8,11,13,14).
To evaluate effective transport coefficients within porous microstructures, theoretical, experimental and numerical techniques have been investigated. Theoretical methods based on the percolation theory (20) and Bruggeman theory (1) are only applicable to limited idealized microstructures. In recent years, various numerical methods have been widely applied to evaluate effective coefficients. Repeated sampling techniques (such as the Monte-Carlo simulation) evaluate effective transport quantities on disordered random-resistor networks (23,24), random packing of spheres (2,3), clusters of hollow spheres and cylinders (29), and 3-D pixelized structures (30). On the other hand, continuum-scale methods (such as finite element method) have been applied for random-distributed pore structures (17,18). Although these models represent some features of the 3-D micro-morphologies of porous structures, they are still far from representing real 3-D porous microstructures used in SOFC electrodes.
In the present work, the proposed numerical technique differs from previous techniques in several ways. First, we numerically construct realistic 3-D porous microstructures using measurable parameters as inputs to match microstructures of real electrodes. Second, we render a surface geometry of a porous microstructure to construct a computational unstructured grid. Note that our meshing strategy can be generalized to import any type of surface CAD geometry as inputs. This technique can also incorporate with surface imaging data from the focused ion beam-scanning electron microscopy
(FIB-SEM) (27). With this computational structure, we use both the finite volume method (FVM) and Monte-Carlo (MC) simulations to calculate effective transport coefficients. The results of the calculations compared with experimental data for effective electron conductivities for a range of solid-matrix compositions. Comparisons are also made with theoretical correlations for effective transport coefficients. The effect of Knudsen diffusion on the effective gas diffusivity is also addressed in this paper. MC simulations differ from continuum-scale methods (such as FVM), in that Knudsen diffusion is implicitly accounted-for. Numerical results are compared with a harmonic average approximation based on Bosanquet’s formula (19).
Methodology
Sample Microstructure
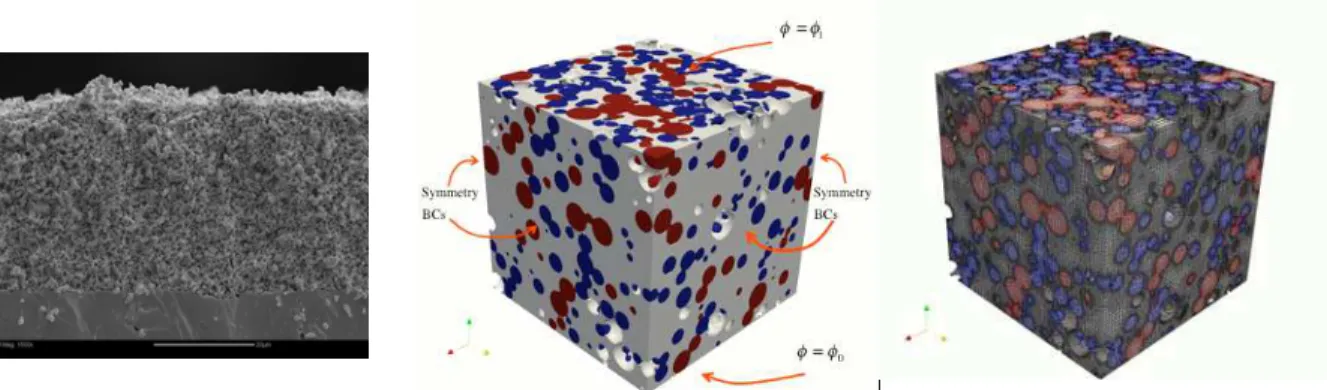
A detailed account of the algorithms used to develop the geometry can be found in (14). For transport through porous electrodes, the transport coefficient should be modified to account for volume averaging as well as the tortuous pathway of the transported species. To evaluate the effective transport properties using continuum-scale methods, a cubic geometry consisting of randomly placed spheres, as shown in Figure 1, is considered. This geometry was designed to reflect the microstructure of an air sprayed electrode fabricated in our lab. The geometry was constructed using two cases: a ‘polydisperse’ case where true particle size distributions of LSM and YSZ powders were considered and a ‘monosized’ case where the two ceramic powders had the uniform particle size. A cubic domain of 10µm was used as a sample domain for the polydisperse case with mean LSM/YSZ particle diameters of dlsm= 0.73µm and dysz = 0.51µm as well as standard deviations of σlsm=σysz = 0.3µm. The porosity values of the geometry ranged from 25% to 40% (ε= 0.25; 0.3; 0.35; 0.4). For the monosized case, three cubic domains of 5µm, 10µm, and 15µm were considered with particle diameter of dlsm=dysz = 1.0µm and porosity of 30% (ε= 0.3).
Figure 1. SEM image (left), computational domain (middle) and its unstructured mesh (right) for a porous composite electrode. LSM (electron-conducting) particle, YSZ (ion-conducting) particle, and gas pore space (gas-transporting) are displayed as ‘red’, ‘blue’, and ‘gray’, respectively. Non-percolating particles are excluded here.
Finite Volume Method (FVM)
The transport processes in this model include mass diffusion, electron conduction and ion conduction. The governing equation for these processes can be written as follows:
∇ ⋅
(
αb∇φ)
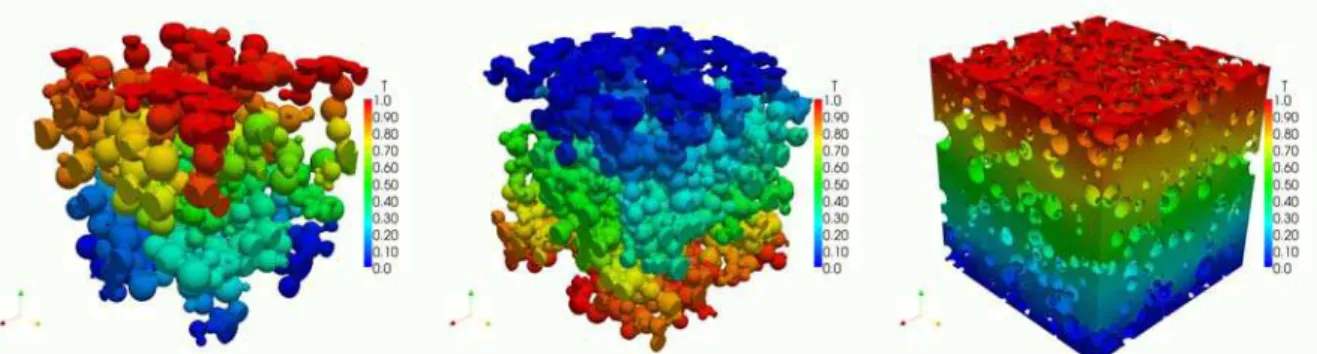
= 0, on Ω, [1] where αb is the bulk transport coefficient, φ is the relevant potential, and Ω is computational domain. We impose fixed potential boundary conditions on the top and bottom surfaces, i.e., φtop=φ1 and φbot =φ0, and use symmetry boundary conditions on solid (i.e., LSM and YSZ) and pore interfaces as well as sides of Ω such that ∂φ∂n = 0. Equation [1] is independently solved by FVM for each phase (i.e., mass, electron, or ion) on unstructured mesh (e.g., Figure. 1 (right)) using OpenFOAM. Sample electron, ion and mass potential fields for each phase computational domain are displayed in Figure. 2.Figure 2. Examples of potential field through LSM particles (left), YSZ particles (middle) and Pore space (right).
The effective transport coefficients can be derived from the calculated potential fields as shown in Figure 2. The effective transport coefficient αeff of the porous microstructure is evaluated by
αeff = q
∇φ [2]
where q denotes flux density. Note that the effective transport coefficient is defined as
Deff, κeffe , and κeffi for mass, electron and ion transport processes, respectively. Monte Carlo (MC) Simulation
Monte-Carlo (MC) simulation, which calculates diffusion coefficients based on the mean-squared displacement of a large number of molecules (or tracers), is also considered. Contrary to continuum approaches, MC simulations intrinsically take into account Knudsen diffusion. Knudsen diffusion or intermediate diffusion regimes can be expected in SOFC porous electrodes (15), where pores are small enough for gas diffusion not to be governed by random intermolecular collisions only but also by collisions between molecules and solid walls.
The principles of our MC simulation were similar to previous MC methods performed in various porous media (3,24,29). First the initial position of a molecule was set in the desired phase (pore, electron-conducting or ion-conducting phases). The molecule was
allowed to travel in a random direction in the given phase for a certain distance before it collided with another molecule. Then, a new direction was picked randomly and the molecule traveled again until a new collision occurred. The distance traveled between two intermolecular collisions is the free path. It was taken from an exponential probability distribution around a mean value, the mean free path λ, which arises from thermodynamics. For a gas at temperature T and mean pressure P , with a molecule diameter d, the mean free path is given as follows:
P d 2 RT 2Ν = π λ , [3]
where R is the gas constant, andΝ is the Avogadro number. Note that Equation [3] is valid for gas diffusion only. However, the MC solver also applies to electron and ion transport. In this case, electrons and ions were considered as a gas and we assumed electron and ion transport to occur in the bulk diffusion regime. Therefore, we arbitrarily set a mean free path for electrons and ions that was small enough to ensure these conditions. When moving molecules encountered an interface between two phases (e.g. a solid wall when considering gas molecules traveling in the pore phase), diffuse reflection was assumed to occur (25). Molecules were reflected along a random direction in the half space of the desired phase. When molecules moved out of the computational domain, we used either periodic boundary conditions, if the continuity of the phases was ensured when the molecule position was translated from one domain boundary to its opposite, or symmetry boundary conditions. These mixed boundary conditions avoided phase jumps and ensured the connectivity of the different phases when the displacement of the tracers was larger than the computational domain.
Tracers were allowed to travel during a given amount of time τ . The procedure was repeated for a large number of tracers. Effective diffusion coefficients were eventually obtained from the mean square displacement of the tracers, according to the following equation first proposed by (10):
τ ξ α 6 2 eff > < = . [4]
Finally, note that, in the following, we present the results for effective diffusivities as
bulk
eff α
α / , where αbulk =λv/3 is the bulk diffusivity, with v the thermal velocity. Also,
it was verified that the computational solutions converged for 1000 tracers and a total traveled distance of 5000 times the length of the computational domain, which are the parameters we use in the presented results.
Conductivity Measurement
The effective electron conductivities calculated numerically were compared with experimentally obtained effective electron conductivities of composite cathodes measured using the van der Pauw technique (26). Pure LSM as well as composite LSM-YSZ cathodes of various volume fractions were fabricated by spraying low viscosity ceramic ink onto a dense, 12 mm diameter, 0.5mm thick YSZ electrolyte disk. The electrode samples were then sintered at 1150oC for 2 hrs. The electrodes were estimated to be between 30-40% porous and had controllable and uniform thickness ranging from 15-25 µm.
For the DC van der Pauw conductivity measurements, the sample was placed in a furnace in air with four Pt contact points, A, B, C and D spring loaded onto the corners of the composite electrodes, forming a virtual square. The Pt contact points were attached to a Solartron 1287 potentio/galvanostat. For temperatures between 400 and 900oC, a small constant current was applied between contact points AB and a voltage was measured between CD with a resistance RAB,CD. The lead wires were then rotated so that a small
current could be applied between the points AC and a voltage could be measured between BD. The resistivity of the sample was calculated with the knowledge of the electrode thickness (obtained after the measurement for all samples by SEM) from Equation [5]:
exp −πRAB, CDL ρ ⎛ ⎝ ⎜ ⎠ ⎟ + exp⎞ −πRDC, BAL ρ ⎛ ⎝ ⎜ ⎞ ⎠ ⎟ =1 [5]
Evaluation of the Effective Electron and Ion Conductivities
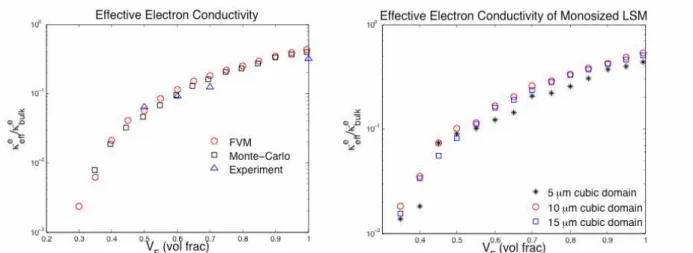
We compared our numerical results against effective electron conductivity measurements from the van der Pauw technique. Figure 3 shows the resulting effective electron conductivity as a function of volume fraction of LSM particles plotted in a semi-log scale for both polydisperse and monosized cases. It can be seen from Figure 3 (left) that the numerical results from both FVM and MC simulations display a good qualitative agreement with the DC van der Pauw conductivity measurements. Discrepancies most likely come from uncertainties in the experimental particle size distribution and porosity. These issues are currently under investigation. It was found that the change in the effective conductivity decreased as the domain size increased. For example, increasing the domain size from 5µm to 10µm changed the solution by 20% whereas increasing the domain size from 10µm to 15µm changed the solution by 3%. Hence, the domain size of 10µm was chosen to reduce computational cost and minimize numerical accuracy. Figure 4 shows that both the effective electron and ion conductivities increase with decreasing porosity.
Figure 3. Normalized effective electron conductivity as a function of LSM volume solid fraction in semi-log scale for polydisperse case (left) and for monosized case (right). Porosity of 35%was used for both cases.
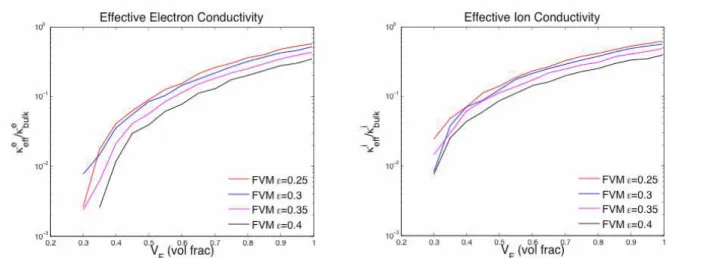
Figure 4. Normalized effective electron conductivity as function of LSM volume fraction (left) and normalized effective ion conductivity as function of YSZ volume fraction (right) with porosities ranging from 25% to 40% for the polydisperse case.
Evaluation of Effective Mass Diffusivity
Diffusion mass transport through the pore space will be considered herein. To begin, we validate our simulation results against the theoretical predictions of Bruggeman theory (1) that are available for the case of an isotropic array of spheres. The computational mesh for this simplistic geometry is presented on the left-hand side of Figure 5. It simply consists in a single spherical particle surrounded by fluid. The right-hand side of Figure 5 shows the effective mass diffusivity as a function of porosity. Both FVM and MC simulations demonstrate excellent agreement with Bruggeman theory.
Figure 5. Computational mesh for an isotropic array of solid spheres (left) and its resulting effective mass diffusivity in the fluid phase (right) using both FVM and MC simulations.
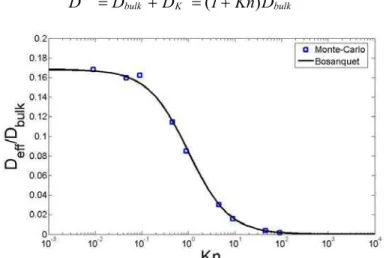
Mass diffusion in small pores is affected by the Knudsen effect, which accounts for
mean free path and pore diameter, i.e., Kn=λ/ dpore. Figure 6 shows the influence of the Knudsen number on effective mass diffusivity. Data were obtained from MC simulation in the polydisperse case at 40%porosity and 50% LSM content by varying the mean free path of gas molecules. The results show in good agreement with Bosanquet’s relation, which is often used to take into account the Knudsen effect in porous media. Bosanquet’s equation yields a corrected diffusivity coefficient D by taking into account a Knudsen diffusivity coefficient DK as follows:
1 bulk 1 K 1 bulk 1 D Kn 1 D D D− = − + − =( + ) − [6]
Figure 6. Effective mass diffusivity as a function of the Knudsen number.
Figure 7 presents the effective mass diffusivity as a function of porosity. The fluid is O2 at operating conditions relevant to a real SOFC, i.e. T=850°C and P=1atm. Under these conditions, the mean free path is λ=372nm. The Knudsen number ranges between 1.77 and 2.44, which yields average pore diameters of 150 and 210 nm respectively, in good agreement with (15). Tortuosity was estimated to be approximately 2 for 40% porosity. Due to the presence of Knudsen diffusion effects, the effective mass diffusivity by Bruggeman theory is no longer valid. However, Bosanquet’s formula given in Equation [6] can be used to correct FVM results, which leads to a fairly good agreement with MC simulations.
Figure 7. Computational mesh for the pore space (left) and its resulting effective mass diffusivity in porous media (right) using both FVM and MC simulations.
Conclusions
The proposed numerical methods for evaluating effective transport coefficients are demonstrated in terms of electron, ion and mass transport processes. With these strategies, one can find the effective transport coefficients within porosity ranged from
25% to 40% for porous electrodes used in SOFCs. Both FVM and MC techniques are very useful tools to evaluate effective electron and ion conductivities. For diffusion mass transport, MC simulation has proven to be more appropriate tool than FVM due to its straightforward application within transition and Knudsen diffusion regimes, i.e. Kn≥1. In transition and Knudsen diffusion regimes, FVM requires modification based on Bosanquet’s formula. Detailed computational and parametric studies for SOFCs will be addressed in future papers.
Acknowledgments
This research was supported through the NSERC Solid Oxide Fuel Cell Canada Strategic Research Network from the Natural Science and Engineering Research Council (NSERC). This work was made possible by the facilities of the Shared Hierarchical Academic Research Computing Network (SHARCNET: www.sharcnet.ca).
References
1. D. A. G. Bruggeman. Ann. Physik, 25, 636-664 (1935) 2. V. N. Burganos. J. Chem. Phys., 98, 2268-2278 (1993). 3. V. N. Burganos. J. Chem. Phys., 109, 6772-6779 (1998).
4. S. H. Chan, X. J. Chen and K. A. Khor. J. Electrochem. Soc., 151, A164-A172 (2004). 5. S. H. Chan and Z. T. Xia. J. Electrochem. Soc., 148, A388-A394 (2001).
6. X. J. Chen, S. H. Chan, and K. A. Khor. Electrochemica Acta, 49, 1851-1861 (2004). 7. P. Costamagna, M. Panizza, G. Cerisola, and A. Barbucci. Electrochemica Acta, 47,
1079-1089 (2002).
8. S. C. DeCaluwe, H. Zhu, R. J. Kee and G. S. Jackson. J. Electrochem. Soc., 155, B538-B546 (2008).
9. D. W. Dees, T. D. Caar, T. E. Easler, D. C. Fee and F. C. Mrazek. J. Electrochem.
Soc., 134, 2141-2146 (1987).
10. A. Einstein. Investigations on the Theory of the Brownian Movement, London, Methuen (1926).
11. D. H. Jeon, J. H. Nam, and C. J. Kim. J Power Sources, 139, 21-29 (2005).
12. S. Kakac, A. Pramunanjaroenkij, X. Y. Zhou, Int. J. Hydrogen Energy, 32, 761-786 (2007).
13. B. Kenney and K. Karan. J. Electrochem. Soc., 153, A1172-A1180 (2006). 14. B. Kenney and K. Karan, Solid State Ions, 178, 297-306 (2007)
15. B. Kenney, M. Valdmanis, C. Baker, J. G. Pharoah and K. Karan. J. Power Sources,
189, 1051-1059 (2009).
16. J.-H. Lee, H. Moon, H.-W. Lee, J. Kim, J.-D. Kim and K.-H. Yoon. Solid State Ions,
148, 15-26 (2002).
17. D. Mu, Z.-S. Liu, C. Huang, and N. Djilali. J. Porous Mater., 14, 49-54 (2007). 18. D. Mu, Z.-S. Liu, C. Huang, and N. Djilali. Int. J. Microfluid. Nanofluid., 4, 257-260
(2008).
19. W. G. Pollard and R. D. Present. Phys Rev, 73, 752-774 (1948).
20. D. Staffer. Introduction to Percolation Theory. Taylor & Francis Ltd., London (1985). 21. S. C. Singhal and K. Kendall, Editors. High Temperature Solid Oxide Fuel Cells,
Fundamentals, Design and Applications. Elsevier Ltd, UK (2003).
22. Siemens Power Generation. http, //www.powergeneration.siemens.com/home. 23. S. Sunde. J. Electrochem. Soc., 142, L50-L52 (1995).
24. S. Sunde. J. Electrochem. Soc., 143, 1123-1132 (1996).
25. M. M. Tomadakis and S. V. Sotirchos. AlChE J., 39, 397-412 (1993). 26. L. van der Pauw. Philips Research Reports, 13, 1-9 (1958).
27. J. R. Wilson, A. T. Duong, M. Gameiro, H.-Y. Chen, K. Thornton, D. R. Mummb, and S. A. Barnett. Electrochemistry Comm., 11, 1052-1056 (2009).
28. K. Yamahara, T. Z. Sholklapper, C. P. Jacobson, S. J. Visco, and L. C. D. Jonghe.
Solid State Ionics, 176, 1359-1364 (2005).
29. J. M. Zalc, S. C. Reyes, and E. Iglesia. Chem. Engrg. Sci., 58, 4605-4617 (2003). 30. J. M. Zalc, S. C. Reyes, and E. Iglesia. Chem. Engrg. Sci., 59, 2947-2960 (2004). 31. F. Zhao, T. Armstrong, A. Virkar. J. Electrochem. Soc., 150, A249-A256 (2003).