HAL Id: hal-01936526
https://hal.archives-ouvertes.fr/hal-01936526
Submitted on 27 Nov 2018
HAL is a multi-disciplinary open access archive for the deposit and dissemination of sci-entific research documents, whether they are pub-lished or not. The documents may come from teaching and research institutions in France or abroad, or from public or private research centers.
L’archive ouverte pluridisciplinaire HAL, est destinée au dépôt et à la diffusion de documents scientifiques de niveau recherche, publiés ou non, émanant des établissements d’enseignement et de recherche français ou étrangers, des laboratoires publics ou privés.
To cite this version:
Y. Ji, P. Baud, V. Vajdova, T.-F. Wong. Characterization of Pore Geometry of Indiana Limestone in Relation to Mechanical Compaction. Oil & Gas Science and Technology - Revue d’IFP Energies nou-velles, Institut Français du Pétrole, 2012, 67 (5), pp.753-775. �10.2516/ogst/2012051�. �hal-01936526�
and available online here
Cet article fait partie du dossier thématique ci-dessous
publié dans la revue OGST, Vol. 67, n° 5, pp. 731-875
et téléchargeable ici
Dossier edited by/Sous la direction de : E. Rosenberg
IFP Energies nouvelles International Conference/Rencontres Scientifiques d’IFP Energies nouvelles
Oil & Gas Science and Technology – Rev. IFP Energies nouvelles, Vol. 67 (2012), No. 5, pp. 731-875 Copyright © 2012, IFP Energies nouvelles
Pore2Field - Flows and Mechanics in Natural Porous Media
from Pore to Field Scale
Pore2Field - Physique des écoulements en milieux poreux naturels :
de l’échelle du pore à l’échelle du réservoir
731 >
Editorial737 >
Molecular Dynamics Simulation of Spontaneous Imbibition in Nanopores and Recovery of Asphaltenic Crude Oils Using Surfactants for EOR ApplicationsSimulations de dynamique moléculaire d’imbibition spontanée dans des nanopores et pour la récupération d’huiles brutes asphalténiques en utilisant des agents tensioactifs pour des applications d’EOR
M.R. Stukan, P. Ligneul and E.S. Boek
743 >
Pore-Scale Flow Simulations: Model Predictions Compared with Experiments on Bi-Dispersed Granular AssembliesSimulation d’écoulements à l’échelle porale : comparaison des prédictions du modèle et d’expériences sur mélanges de billes de verre bi-disperses
A.-T. Tong, E. Catalano and B. Chareyre
753 >
Characterization of Pore Geometry of Indiana Limestone in Relation to Mechanical CompactionCaractérisation de la géométrie des pores dans le calcaire de l’Indiana en relation avec la compaction mécanique
Y. Ji, P. Baud, V. Vajdova and T.-f. Wong
777 >
A Poromechanical Model for Coal Seams Injected with Carbon Dioxide: From an Isotherm of Adsorption to a Swelling of the ReservoirUn modèle poromécanique pour l’injection de dioxyde de carbone dans des veines de charbon : d’une isotherme d’adsorption à un gonflement du réservoir
S. Nikoosokhan, M. Vandamme and P. Dangla
787 >
Steady-State Two-Phase Flow in Porous Media: Review of Progress in the Development of the DeProF Theory Bridging Pore to Statistical Thermodynamics ScalesÉcoulement diphasique stationnaire en milieu poreux : revue des avancées sur les développements de la théorie DeProF reliant l’échelle du pore à l’échelle de la thermodynamique statistique
M.S. Valavanides
805 >
Transmissibility Corrections and Grid Control for Shale Gas Numerical Production ForecastsCorrections de transmissivités et contrôle des maillages pour les simulations numériques de production en faible perméabilité
V. Artus and D. Fructus
823 >
Integrating Data of Different Types and Different Supports into Reservoir ModelsConstruction de modèles de réservoir contraints par des données de natures différentes et caractéristiques d’échelles différentes
M. Le Ravalec, S. Da Veiga, R. Derfoul, G. Enchéry, V. Gervais and F. Roggero
841 >
Evaluation of EnKF and Variants on the PUNQ-S3 CaseÉvaluation de l’EnKF et des variantes du cas PUNQ-S3
R. Valestrand, G. Nævdal and A.S. Stordal
857 >
Application of Hierarchical Matrices to Linear Inverse Problems in GeostatisticsApplication des matrices hiérarchiques aux problèmes d’inversion linéaire en géostatistique
A.K. Saibaba, S. Ambikasaran, J. Yue Li, P.K. Kitanidis and E.F. Darve
©
Characterization of Pore Geometry of Indiana
Limestone in Relation to Mechanical Compaction
Y. Ji
1, P. Baud
2, V. Vajdova
3and T.-f. Wong
41 State Key Laboratory of Earthquake Dynamics, Institute of Geology, China Earthquake Administration, Beijing, 100029 - China 2 Institut de Physique du Globe de Strasbourg (UMR 7516 CNRS, Université de Strasbourg/EOST), 67084 Strasbourg - France
3 Currently at Talbridge Corporation, PO Box 271054, Houston, TX 77277-1054 - USA
4 Department of Geosciences, State University of New York, Stony Brook, New York, NY 11794-2100 - USA e-mail: [email protected] - [email protected] - [email protected] - [email protected]
Résumé — Caractérisation de la géométrie des pores dans le calcaire de l’Indiana (États-Unis) en relation avec la compaction mécanique — La structure des pores dans des échantillons de calcaire de
l’Indiana intact et déformé a été étudiée par microtomographie à rayons X. En se basant sur une étude détaillée de la microstructure et en utilisant la méthode de seuillage global d’Otsu, les images 3D acquises avec un voxel de 4 μm ont été segmentées en trois domaines : les grains, les macropores et une zone intermédiaire dominée par la microporosité. Les macropores ont été individualisés grâce à une analyse morphologique qui a également permis de quantifier leurs formes (sphéricité et diamètre équivalent). Nos nouvelles données 3D montrent une réduction significative du nombre de macropores dans les échantillons déformés sous chargements hydrostatique et triaxial par rapport à la roche intacte, en accord avec les études antérieures sur la microstructure du calcaire de l’Indiana. Le domaine intermédiaire (microporosité) reste interconnecté dans les échantillons déformés. Notre analyse suggère que la déformation irréversible dans le calcaire de l’Indiana se manifeste par une diminution à la fois du volume et de la surface de cette zone microporeuse.
Abstract — Characterization of Pore Geometry of Indiana (USA) Limestone in Relation to Mechanical Compaction — We studied the pore structure in intact and inelastically compacted Indiana limestone using X-ray microtomography imaging. Guided by detailed microstructural observations and using
Otsu’s global thresholding method, the 3D images acquired at voxel side length of 4 μm were segmented
into three domains: solid grains, macropores and an intermediate zone dominated by microporosity. The macropores were individually identified by morphological processing and their shape quantified by their sphericity and equivalent diameter. Our new data revealed a significant reduction of the number of macropores in hydrostatically and triaxially compressed samples with respect to the intact material, in agreement with previous microstructural analysis. The intermediate (microporosity) domains remained interconnected in compacted samples. Our data suggest that the inelastic compaction in Indiana limestone is manifested as not only a decrease in the volume fraction of the microporosity backbone but also a corresponding decrease in its thickness.
Copyright © 2012, IFP Energies nouvelles
DOI: 10.2516/ogst/2012051
Pore2Field – Flows and Mechanics in Natural Porous Media from Pore to Field Scale
Pore2Field – Physique des écoulements en milieux poreux naturels : de l'échelle du pore à l'échelle du réservoir
IFP Energies nouvelles International Conference Rencontres Scientifiques d’IFP Energies nouvelles
INTRODUCTION
The mechanical and transport behaviors of a rock are sensitively dependent on its pore geometry. Hence it is of fundamental importance in rock physics to characterize the pore space and its geometric attributes, including pore size, shape, tortuosity and connectivity. Traditionally the pore structure is charac-terized using optical and Scanning Electron Microscopes (SEM). However recent advances in 3-dimensional imaging techniques such as X-ray microtomography (microCT) and Laser Scanning Confocal Microscopy (LSCM) have pro-vided enhanced perspective on pore geometry complexity. It has contributed useful insights into the preexisting pore space and how it influences rock physical properties, as well as damage evolution and its relation to the micromechanics of failure.
Conventionally the void space of a rock is considered to be made up of two types of cavities: relatively elongated microcracks and equant pores (Brace et al., 1972; Paterson and Wong, 2005). In a compact crystalline rock, many of the preexisting cracks and pores have relatively narrow apertures down to the submicron range, which are not resolvable by X-ray microCT unless one resorts to a sample that includes so few grains that cannot provide a representative elemental volume. However, LSCM (Fredrich et al., 1995) has been used successfully to visualize these relatively fine features in 3D and, even though the technique can be used only to probe a depth that is typically less than 1 mm or so, it has proved to be viable for characterizing the connectivity and modeling permeability (Fredrich, 1999).
In a clastic rock, the void space is dominated by relatively equant pores connected by throats that are sufficiently large for direct imaging using microCT (Spanne et al., 1994; Auzerais et al., 1996) and the data (mostly for sandstones) have provided useful insights into the 3D geometric com-plexity (Coker et al., 1996; Lindquist et al., 2000) and its control over permeability (Arns et al., 2004; Fredrich et al., 2006; White et al., 2006; Zhan et al., 2010; Sun et al., 2011). In contrast, the use of X-ray microCT for 3D imaging of the pore space in carbonate rocks is not as straightforward (Okabe and Blunt, 2004; Bauer et al., 2011). Carbonate rocks are generally recognized to have pore geometry that is signif-icantly more complex than other sedimentary rocks such as siliciclastics (Choquette and Pray, 1970; Lucia, 1995). One of the reasons for the geometric complexity is that deposi-tional environment and diagenesis exert significant genetic influence over the development of texture and fabric of a car-bonate rock (Folk, 1980), which can in turn modify both the size and connectivity of the pore space in a relatively rapid and drastic manner. The pore size in a carbonate rock may span over a very broad range, with a distribution that is often bimodal, including a significant subset of microporosity with submicron features that can only be resolved under a tool such as the SEM (Pittman, 1971; Anselmetti et al., 1998).
Recent studies have demonstrated that the macropores and micropores exert distinctly different influences on the elastic (Baechle et al., 2008; Knackstedt et al., 2009) and inelastic (Zhu et al., 2010; Vajdova et al., 2010) behaviors of lime-stone and accordingly realistic modeling of the microme-chanics would require a dual porosity model. Although most of the micropores can be readily resolved under the SEM, the quantitative characterization of a statistically representative sample of these fine features can be tedious. Furthermore, the 3D characteristics can only be inferred from multiple 2D sec-tions of the sample. Guided by parallel microstructural obser-vations using optical microscopy and SEM, a first objective of this study is to investigate to what extent X-ray microCT can be used to characterize the macropores and indirectly infer the geometry and spatial distribution of the microporosity. Instead of following the conventional approach to binarize the CT image into void and solid, we segment it into three different domains: other than the solid and void (made up of macropores), there is an intermediate domain made up of voxels containing solid material embedded with micropores.
To investigate the micromechanics of inelastic and failure behaviors, it is important to characterize the evolution of damage. As reviewed by Dresen and Guéguen (2004) and Paterson and Wong (2005), most previous studies were performed by SEM since a primary mechanism is stress-induced microcracking, which is difficult to resolve with microCT. There have also been limited studies using LSCM to probe the 3D characteristics of damage evolution (Fredrich
et al., 1995; Wong et al., 2004). In carbonate rocks, the
dam-age may derive not only from cataclastic processes but also crystal plasticity processes such as twinning and dislocation slip which can be activated by stress under room temperature (Fredrich et al., 1989; Baud et al., 2000; Vajdova et al., 2010). For inelastic compaction, however, recent studies of Zhu et al. (2010) and Vajdova et al. (2010, 2012) of several porous limestones have indicated that it is dominated by the collapse of macropores, particularly in the initial yield phase. Since microCT is quite effective in identifying the macropores and characterizing their geometric characteristics, a second objective of the present study is to characterize and contrast these characteristics in undeformed and deformed samples of Indiana limestone, so as to gain insights into the damage evolution and micromechanics of inelastic compaction.
1 EXPERIMENTAL PROCEDURE
Indiana limestone has been investigated in a number of rock physics and experimental deformation studies. In particular, brittle faulting and its micromechanics were investigated by Robinson (1959), Wawersik and Fairhurst (1970), Zheng (1989) and Myer et al. (1992). Brittle-ductile transition and compactive yield behavior in Indiana limestone were studied recently by Vajdova et al. (2004). Its pore geometry was
investigated by Churcher et al. (1991). Recently Vajdova et
al. (2012) conducted a relatively detailed characterization of
the pore geometry of an undeformed sample as well as dam-age in deformed samples using optical and SEM, which pro-vides useful guidance on the segmentation of our microCT image.
1.1 Sample Preparation and Mechanical Deformation
Cylindrical samples of the limestone were cored perpendicular to the sedimentary bedding. Indiana limestone cores have been ground to diameter of 18.4 mm and length of 38.1 mm. For mechanical testing, a sample was first dried in vacuum at 80ºC for 48 hours and then jacketed in a thin copper foil and polyolefine (heat-shrinkable) tubings to separate the rock from the confining medium (kerosene). Electric resistance strain gages (TML type PFL10-11) were attached in orthogonal directions to the copper jacket to measure axial and transverse strains.
Details of the experimental methodology used in Stony Brook laboratory were described in details by Vajdova et al. (2004, 2012). The jacketed samples were deformed in the conventional triaxial configuration at room temperature. A sample (IH) was hydrostatically compressed to a maximum pressure of 175 MPa. Two other samples (IC1 and IC2) were triaxially compressed at a confining pressure of 20 MPa to axial strains of 0.5% and 1.5%, respectively. The axial dis-placement was servo-controlled at a fixed rate (correspond-ing to a nominal strain rate of 1.3 × 10⁻⁵s-1). The volumetric
strain was calculated using the relation εv= ε⏐⏐+ 2ε⊥, where
ε⏐⏐and ε⊥are the axial and transverse strains measured by the
gages, respectively. The samples stressed to different stages of deformation were then unloaded. The samples and their deformation histories are summarized in Table 1.
Upon retrieval from the apparatus, the samples were encapsulated with epoxy and two thin-sections were then cut along the central vertical plane of each sample. One thin-sec-tion was used primarily for optical microscopy and the other was coated with gold for SEM observations. For microCT imaging, a cylindrical subvolume (of diameter 4 mm and length 7 mm) was also extracted from one half of the sample
by coring perpendicular to the cut surface (Fig. 1). For reference, thin sections and subvolume for microCT imaging were also obtained from an undeformed sample (I0-CT) of Indiana limestone.
1.2 X-Ray Microcomputed Tomography and Microstructural Analysis
X-ray microCT imaging was performed at the High-Resolution CT Facility at the University of Texas at Austin (UTCT), following procedures detailed by Ketcham and Carlson (2001). The system employs a 200 kV microfocal X-ray source capable of a < 10 μm focal spot size. Scanning specifications were varied to achieve the best imaging for each sample. X-rays were set to 60 kV and 10 W without any filter and a 4X objective was employed. Acquisition times ranged from 50 to 60 s per view and from 476 to 481 views were gathered over an angular range from 190° to 192°. Reconstructed slice images were of size about 1 000 × 1 000 voxels. Each sample spanned 934 image slices and the voxel side length was 4 μm (corresponding to a voxel size of 64 μm3).
Microstructure of the intact and deformed samples was also studied under optical microscope and SEM on thin-sections. For SEM observations, the gold-coated thin-sections were studied using a LEO 1550 microscope with a voltage up to 10 KV. All SEM micrographs presented here were acquired in the backscattered electron mode. Optical microscopy was performed using a Nikon polarizing microscope. We also used an Epson Perfection™ V700 photo scanner to charac-terize the macropore size statistics. The thin sections were scanned at a resolution of 1 800 dpi or higher. Our experience is that the scanner can be used to resolve the macroporosity as effectively as an optical microscope (Zhu et al., 2010; Vajdova et al., 2010), with the advantage that it can cover the whole area of the thin section, thus circumventing the need to assemble a mosaic of numerous optical micrographs. The macropores were identified using a brightness thresholding approach (Russ, 1990) and the binarized image was then ana-lyzed using ImageJ, a public domain image processing pro-gram developed at the National Institutes of Health. The area of each individual pore was measured and the equivalent diameter was evaluated.
TABLE 1
Porosity and deformation history of the four studied samples of Indiana limestone
Macroporosity Microporosity Solid Initial
Test type
Macro pore Intermediate zone Solid grain porosity
I0-CT 4.96% 10.79% 36.40% 47.84% 18.10% Intact
IH 4.32% 7.91% 37.44% 50.30% 14.60% Hydrostatic
IC1 4.35% 10.01% 33.44% 52.17% 17.60% Triaxial (Pc= 20 MPa)
2 GEOMETRY OF PREEXISTING PORE SPACE
Indiana limestone used in this study is a gray, fossiliferous limestone that is quarried in the Bedford-Bloomington area in Indiana. It was formed during Mississippian period and belongs to the Salem limestone formation (Patton and Carr, 1982). Its average modal composition is: calcite 97.1%, mag-nesite 1.2%, silica 0.8%, alumina 0.7%, iron oxide 0.1% and undetermined material 0.1% (Indiana Limestone Handbook, ILI, 2007). The allochems (that include fossils, ooids and some peloids) constitute ~ 65% of the bulk rock volume. Many of the ooids contain fossils and fossil fragments which are coated with concentric layers of calcite.
In terms of rock fabric, Indiana limestone can be classified as a calcite-cemented grainstone. Due to the material hetero-geneity associated with three very different solid constituents (allochems, micrite, sparite), the grain sizes in our Indiana limestone samples range from < 5 μm for the pore-lining micritic material to > 300 μm for the allochems. The porosity of Indiana limestone is quite variable (ILI, 2007) and a range between 12% and 20% have been reported in the literature. We calculated the total porosity from the density of a vacuum dried sample, assuming a solid composition of 100% calcite with density of 2 710 kg/m3. The initial porosities so
deter-mined for our Indiana limestone samples range from 16.5% to 17.6% (Tab. 1).
Laboratory sample
of Indiana limestone Intact half
(1)
Epoxy
impregnated half Thin section
(2)
38.1 mm
18.4 mm Impregnated half
Sample for μCT analysis
7 mm
4 mm (3)
Figure 1
Sample preparation for μCT and microstructural analysis: 1) intact and deformed samples of 38.1 mm length and 18.4 diameter were cut in two halfs. One half was impregnated with high viscosity epoxy and 2) a petrographic thin section was prepared; 3) a small sample of 7 mm length and 4 mm diameter for μCT imaging was cored in the impregnated half of the sample.
2.1 Microstructural Observations
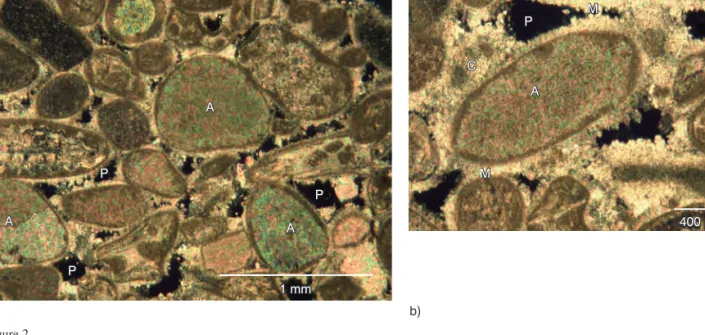
Figure 2 illustrates the microstructure of intact Indiana limestone (I0-CT) observed under an optical microscope. The allochems are commonly coated with micrite cement around their rims and the interparticle porosity is made up of relatively large pores (areas with lightest color). Some of these pores are partially filled with sparry cement. In addition to macroporosity, micropores occur especially within allochems. High microporosity is also concentrated along boundaries of allochems. Extensive SEM observations of the micropores were presented by Vajdova et al. (2012).
We also scanned the thin-section (covering an area of ~ 38× 18 mm2) at a resolution of 1 800 dpi and after the
scanned image was binarized, it was analyzed to determine the area of each individual pore, from which the equivalent diameter was evaluated. Given the thickness of the thin sec-tion and limited resolusec-tion of the scanned image, following Anselmetti et al. (1998), we arbitrarily used a lower limit of 33 μm on pore size, so that a macropore is defined to be a feature with equivalent diameter of 33 μm or larger. From geometric probability theory, the 2D measurement of areal porosity (sum of the pore areas normalized by the total area) can be used to estimate the macroporosity of the sample if it is isotropic (Underwood, 1970). For an undeformed sample (sample I0-TS in Vajdova et al., 2012), the macroporosity was so determined to be about one-third of the total porosity of 16.5%, with the implication that the microporosity repre-sents a very significant fraction. Detailed description of the microstructural data from 2D measurements was presented by Vajdova et al. (2012).
2.2 Segmentation of MicroCT Image into Three Domains
Certain first-order geometric characteristics of the pore space can be inferred from the global histogram of the X-ray atten-uation coefficient. Figure 3a shows the microCT data for a Fontainebleau sandstone with porosity of 15%, comparable to that of our Indiana limestone sample I0-CT. The 8-bit data were acquired by Lindquist et al. (2000) from a cylindrical sample of diameter 4.53 mm and length 2.91 mm, with a voxel dimension of 5.7 μm. The X-ray attenuation coeffi-cients were digitized and mapped onto a gray level in the range [0, 255] and the relative frequency corresponds to the number of voxels normalized by the total number of voxels in the sample (or equivalently, the voxel volume normalized by the total sample volume). One can readily recognize in the histogram two distinct modes, with relatively symmetric distributions on either sides of the peaks. The two modes are separated by a broad range of gray level, with a well-defined intermodal valley in between. Using any one of the standard protocols in image analysis, one can select an appropriate threshold that falls on the intermodal valley, which would then provide a criterion for binarizing the CT-image into void and solid domains, that corresponds to voxels with gray levels below or above this threshold.
For comparison, we show in Figure 3b the global histogram for our 16-bit CT image of Indiana limestone sample I0-CT. Although two peaks can be recognized, unlike the sandstone histogram (Fig. 3a) the distributions on either sides of the peaks are not symmetric. Instead of a well-defined inter-modal valley, there is a long tail to the left of the second peak
1 mm 1 mm A A A P C M M P P a) b) P A C 400 400 μm m 1 mm A A A P C M M P P P A C 400 μm Figure 2
a) Optical micrograph of an intact sample of Indiana limestone. Pore (P), allochems (A) and sparry cement (C) are marked in the image. b) Higher magnification micrograph showing micrite (M) around the allochems.
that persists to relatively low gray levels to the right of the first peak. This suggests that there is an intermediate domain with gray levels between those for the void and solid domains, with the implication that voxels in this domain are embedded with micropores that are smaller than the dimension of 4 μm. It is likely that delineation of this intermediate domain would provide useful information on the spatial distribution of microporosity in the limestone.
Before one can segment the CT image into three distinct domains, it is necessary to first select two thresholds that lie between the two modes in the global histogram. In this study, we determined the thresholds using Otsu’s (1979) method that maximizes the between-domain variance. If the two global thresholds so selected are denoted by I*
void and Isolid*
(with I*
solid > Ivoid* ), then the following criterion on the gray
level I of a voxel can be used to identify to which of the three domains it belongs: Void: I ≤ I* void (1a) Solid: I ≥ I* solid (1b) Intermediate: I* void< I < Isolid* (1c)
As illustrated in Figure 4a, the global histogram for I0-CT has two modes corresponding to gray levels of Ipvoid= 16 125
and Isolidp = 27 848 and the two thresholds determined using
Otsu’s method in the intermodal region were I*
void = 19 472
and I*
solid= 27 287.
Since Indiana limestone is basically monominerallic (with a modal composition of 97% calcite) and the CT attenuation coefficient is primarily dependent on the density, the gray
level of a voxel is expected to be linearly related to its local porosity ϕ. Accordingly we adopted the following relation for inferring the local porosity from the CT measurement:
(2)
The local porosity so inferred is plotted in Figure 4b as a function of the voxel volume normalized to the sample volume. The distribution follows an approximately bilinear trend, with significant proportion of the voxels inferred to have local porosities < 20%. In Equation (2), we selected Ipvoidand
Isolidp as the limits and this choice would have been
unambigu-ous if the two peaks corresponding to void and solid are given by Dirac delta functions. However, the histogram for the CT data invariably deviates from such an idealized distri-bution and hence there are other choices one can make and alternative expressions which one can propose for inferring the porosity and it is a moot question which will give the best approximation. It should be noted that if we perform an inte-gration over an appropriate range of grey level, our approach is consistent with that of Bauer et al. (2011) who did not explicitly consider the local porosity distribution, but instead identified I in Equation (2) with the mean grey level of the image and used the expression for inferring the global porosity. According to our segmentation analysis, the microCT image can be separated into three distinct domains (Fig. 4a): voids with dimensions larger than the voxel resolution (corresponding to the macropores) that occupy 4.96% of the bulk sample volume, solid grains that occupy 47.84% of the bulk volume and an intermediate zone (made up of voxels
ϕ = − − I I I I solid p solid p void p 50 100 150 200 250 300 0 V
oxel volume fraction (%)
2.5 0 0.5 1.0 1.5 2.0 a) Gray level Fontainebleau φ = 15% 3.0 3.5 2.5 2.0 1.5 1.0 V
oxel volume fraction (%)
0.030 0 0.005 0.010 0.015 0.020 0.025 b) Gray level x 104 Figure 3
Distribution of X-ray attenuation (relative frequency) for a) an intact sample of Fontainebleau sandstone (Lindquist et al., 2000) and b) our 16-bit CT image of intact Indiana limestone (sample I0-CT).
embedded with micropores) that occupies 47.16% of the bulk volume. From Equation (2), we would infer that the inter-mediate zone includes numerous voids that occupy 10.79% of the bulk volume. In other words, from the CT image the limestone sample is inferred to have a total porosity of 15.75%, that is partitioned between a macroporosity of 4.96% and microporosity of 10.79%. It should be noted that these values are in good agreement with other independent measurements (Tab. 1). From density measurement of the dry sample, the total porosity of I0-CT was determined to be 18.1%. From 2D measurements on scanned image of the thin-section (of another sample I0-TS of total porosity 16.5%), the macroporosity was inferred to be 5.2% (Zhu et
al., 2010; Vajdova et al., 2012). The difference between the
two would give a microporosity of 11.3% for I0-TS.
It should be emphasized that, for this stage of our analysis, the segmentation into three phases was conducted on the microCT image of Indiana limestone that had not been sub-jected to any filtering. However, we have unpublished CT data for Majella limestone that has a histogram with an “elbow” in the intermediate zone which is not as well defined and for this limestone with a porosity of 31%, we found it necessary to apply appropriate filtering to accentuate the con-trast among the solid, void and intermediate zone before we could segment the image into three phases. Indeed, Bauer et
al. (2011) concluded that such pre-segmentation filtering was
absolutely necessary in their recent study of Estaillades and Lavoux limestones (with porosities of 24.7% and 28.7%, respectively). This study was kindly pointed out to us by one of the reviewers, since we were not aware of it during our
own investigation. Most probably in Estaillades, Lavoux and Majella limestone which are significantly more porous than Indiana limestone, the intermediate zone covers a larger volume fraction and the transition is more gradual, which would necessitate the use of filtering to enhance the contrast before one can perform the segmentation.
Understandably our preference is to minimize any unnec-essary filtering unless it is absolutely essential and the quality of our data is such that we do not see any justification or advantage for filtering the data during this first stage of segmentation. Nevertheless, in a later stage during our mor-phological analysis when we attempted to isolate the macrop-ores and analyze the connectivity of the intermediate zone, we did find it necessary to first apply a median filter to the CT-image. Accordingly it is useful to perform an analysis of how our segmentation results and porosity estimates are sensitive to filtering. This analysis is detailed in Appendix.
In Figure A1 in Appendix, we present the histograms for the data in Figure 4a after they have been subjected to median filters applied to subvolumes of 53and 114neighbor
voxels, respectively. It can be seen that since the histograms are qualitatively similar, not surprisingly the thresholds deter-mined for the unfiltered (Fig. 4a) and two filtered (Fig. A1) images almost coincided with one another. However, there is an overall trend for the right peak (corresponding to solid) to attain higher value with increased filtering. As a result, solid volume fraction is predicted to be higher in a segmented image after filtering, whereas total porosity is lower. For example, for the filtered image in Figure A1a subjected to a 53
median filter (analogous to that applied by Bauer et al. (2011)
3.0 3.5 2.5 2.0 1.5 1.0 V
oxel volume fraction (%)
0.030 0 0.005 0.010 0.015 0.020 0.025 a) Gray level x 104 Macroporosity 4.96% Microporosity 10.79% 2.6 2.7 2.5 2.4 2.3 2.2 2.1 20 10 30 40 50 60 2.0 V
oxel volume fraction (%)
0.030 0 0.025 0.020 0.015 0.010 0.005 b) Gray level Local porosity φ (%) x 104 Solid: 36.37 + 47.88 = 84.25% Figure 4
a) Global histogram of intact Indiana limestone. Using Otsu’s (1979) method for optimum global thresholding, the images were segmented with multiple thresholds into three separate domains: solid grains, macroporosity and an intermediate zone dominated by microporosity. b) Voxel volume normalized to the sample volume as a function of the gray level and of the corresponding inferred local porosity in the intermediate zone.
to Estaillades and Lavoux limestones) the solid volume and total porosity have values of 54.15% and 14.08%, about 6% higher and 2% lower than the corresponding values in the unfiltered image (Fig. A1).
A 3D visualization of the gray level distribution is presented in Figure 5a. Whereas many of the macropores were observed to be isolated features (Fig. 5b), most of the solid and intermediate domains seem to be interconnected. In Figure 6,
2 600 2 000 2 000 2 500 2 500 1 500 2 000 2 000 2 500 2 500 1 500 1 500 1 500 2 600 2 400 2 400 2 200 2 200 2 000 2 000 1 800 1 800 1 600 1 600 1 400 1 400 a) μ m μ m b) x 104 2.6 2.5 2.4 2.3 2.2 2.1 2.0 μm μm μm μm 1 500 1 000 1 000 500 0 0 10 20 30 40 X (μm) 50 60 70 0 200 400 600 Local porosity (%) 800 1 000 1 200 1 400 500 1 500 Z ( μ m) Figure 5
3D reconstruction of the intact sample of Indiana limestone I0-CT showing a) the three identified domains and b) the macroporosity.
Figure 6
Five slices from a sub-volume of the intact sample of Indiana limestone (sample I0-CT) showing the partitioning between solid grains, macroporosity and the intermediate zone dominated by microporosity.
we present five slices of a subvolume, which show many features qualitatively similar to the optical micrographs in Figure 2. Many of the solid grains and macropores seem to be surrounded by layers of the intermediate domain. It should be noted that since these images have not been filtered, there are many isolated, relatively small blobs (especially in the intermediate domain) which may correspond to random noise.
2.3 Geometric Characterization of the Macropores and Microporosity Domain
To characterize geometric attributes of the pore space from the X-ray tomography images, it is necessary to perform morphological processing on the microCT image. As a first step, we applied a median filter, which is considered to be an effective method to remove random noise from an image (Russ, 1990). The basic idea of median filtering is to analyze the gray level distribution in a neighborhood that surrounds a voxel and then replace the gray level of the voxel by the median value of the distribution. In this study the median fil-ter was applied to a neighborhood corresponding to a cubical array of 11× 11 × 11 voxels. Such a procedure can potentially reduce the random noise while preserving the edges. The sur-face roughness is reduced while the volume of an isolated blob would remain basically unchanged. However, it may also shrink or even remove some of the relatively small blobs. The impact of the size of the median filter on the results is discussed in Appendix.
We next used the two global thresholds (obtained using Otsu’s method as described above) to segment the filtered image into three distinct domains. These thresholds were determined for the unfiltered image but as discussed above, they almost coincide with thresholds obtained for the filtered images). Using morphological concepts of connectivity on the segmented image, we identified individual clusters of interconnected voxels that correspond to blobs of solid, macroporosity or microporosity. The last step was to map out the surfaces of these blobs using a “marching cubes” algo-rithm (Lorensen and Cline, 1987). The algoalgo-rithm considers an imaginary binary cube created from eight adjacent vertices. Each of these vertices is assigned a binary value of one or zero according to the gray level and domain type. It can be shown that there are fourteen possible configurations for polygonal isosurfaces that pass through the imaginary cube (including the configuration with no surface). For a given combinaison of eight vertex values, a unique polygonal isosurface can be determined and if this process is repeated for all the voxels, the union of these polygons that have been mapped out for all the marching cubes would correspond to the totality of surfaces that enclose the domain.
According to our analysis, a significant proportion of the macroporosity is associated with isolated voids. We present here six macropores mapped out using the marching cubes
algorithm. Figure 7a,b shows two relatively small pores with shapes that are approximately spherical and ellipsoidal, respectively. Figure 7c shows two quasi-ellipsoidal blobs connected by a channel with a diameter on the order of 10 μm. The polygons covering the surfaces are also shown in these figures. Figure 7d-f shows pores with increasing geometric complexity, with multiple blobs connected to one another by elongated channels. The surfaces of each of these three complex pores are covered by a relatively dense mesh of polygons, which is not shown in the figure because individual polygons are not readily resolvable.
For an isolated macropore with volume V and surface area
S, we used two parameters to characterize its geometry:
(3a)
(3b)
The equivalent diameter D is the diameter of a sphere with volume V identical to that of the macropore. The sphericity ψ (Wadell, 1935) is the ratio of the surface area of a sphere (with the same volume as the macropore) to the surface area
S of the macropore. It is a measure of roundness, such that
ψ = 1 for a sphere and a ψ value significantly less than unity is associated with a highly nonspherical geometry or rela-tively rough surface. This is illustrated by the six macropores in Figure 7 with sphericity ranging from 0.21 to 0.93.
From our morphological analysis, 872 isolated macropores that contribute to a porosity of 3.35% were identified and their equivalent diameter distribution is shown in Figure 8a. Most of these isolated pores have equivalent diameters less than 200 μm and there seems to be an overall trend for a more significant proportion of the larger pores to deviate from a spherical geometry. For comparison, we show in Figure 8b the data of Vajdova et al. (2012), which were obtained on 2D scanned image of the thin-section of I0-TS. They did not characterize the pore shape and the equivalent diameter was calculated for a circle with area identical to the projected area of the pore observed on the 2D section. Both sets of data fall on similar ranges of equivalent diameter and they follow qualitatively similar trends with number of pores decreasing with increasing diameters. Using stereological concepts (Underwood, 1970) and assuming isotropy, the 2D and 3D measurements (of number per unit area nA and per
unit volume nV) of a system of spherical objects are related
by:
(4)
where D–denotes the mean diameter of the spherical objects. Although many of the macropores deviate from spherical
n n D V A = ψ = 6V = 1 3 6 2 3 DS V S π/ / ( ) D=⎛ V ⎝ ⎜ ⎞ ⎠ ⎟ 6 1 3 π /
55 50 45 40 35 30 25 20 15 10 10 10 a) b) 10 10 20 20 20 20 30 30 30 30 50 50 50 60 40 40 40 40 55 60 50 45 40 35 30 25 20 15 10 μm μm μm μm ψ = 0.93; D = 46 μm ψ = 0.68; D = 33 μm μ m μ m 10 c) d) 20 20 30 50 40 40 60 80 120 400 400 350 300 300 300 250 150 200 200 200 100 100 100 50 100 80 60 40 20 μm μm μm μm ψ = 0.50; D = 40 μm ψ = 0.44; D = 203 μm μ m μ m μm μm μm e) f) 300 200 400 600 800 1 000 1 200 1 200 1 000 800 600 400 400 200 600 800 1 000 200 200 400 600 800 1 0001 200 100 200 200 400 600 800 ψ = 0.21; D = 548 μm ψ = 0.32; D = 306 μm μ m μ m Figure 7
Macropores in an intact sample of Indiana limestone mapped out using the marching cubes algorithm. The sphericity ψ and the equivalent diameter D are given for each macropore. The polygons covering the surfaces are also shown in the figures. a) Small approximately spherical macropore; b) Small approximately ellipsoidal macropore; c-f) Larger blobs with increasing geometric complexity.
geometry, the 2D and 3D measurements of pore size statistics are in approximate agreement with the stereological relation (4). For example, if we consider equivalent diameters in the range of 50-100 μm, the number of macropores per unit area is nA~ 2.5 mm-2(Fig. 8b) and using a mean diameter
of D–= 75 μm, we would expect nV~ 33 mm-3. In comparison,
a value of nV= 11 mm-3was obtained from our microCT data
analysis (Fig. 8a).
For the intermediate domain, our morphological analysis could identify very few isolated clusters of microporosity that altogether occupy < 1% of the voxel volume in this domain. In other words, the microporosity domain in the limestone sample is basically made up of one interconnected backbone. We will denote the voxel volume occupied by this micro-porosity backbone normalized by the bulk sample volume by vbb and the ratio between the backbone volume and
surface area by ρ. In sample I0-CT, these two geometric parameters for its microporosity backbone are: vbb= 41.09%
and ρ = 26.3 μm.
3 DAMAGE INDUCED BY INELASTIC COMPACTION 3.1 Mechanical Data
In presenting the mechanical data, we have adopted the convention that compressive stresses and compactive strains (i.e. shortening and porosity decrease) are positive. The maximum and minimum principal stresses will be
denoted by σ1and σ3, respectively. In Figure 9a, b, we present the stress-strain curves for the three deformed samples investigated in this study.
Sample IH was hydrostatically compacted to a maximum confining pressure of 175 MPa (Fig. 9a). It has a total porosity of 14.6%, lower than those of the other three samples investi-gated in this study. As noted by Vajdova et al. (2004), the hydrostat has an inflection point at P* ~ 60 MPa, which marks the onset of inelastic compaction and pore collapse (Vajdova et al., 2012). Hence the mechanical data suggest that the sample would have accumulated as much as 2% of permanent volumetric strain.
Samples IC1 and IC2 were triaxially compressed at confining pressure of 20 MPa. While the initial porosities of these two samples were comparable (17.6% and 17.3%), they were somewhat lower than the total porosity of I0-CT (18.1%). Guided by the data of Vajdova et al. (2004) on the critical stress C* for the onset of shear-enhanced, sample IC1 was deformed to just beyond C* before it was unloaded. In con-trast, sample IC2 was deformed well beyond C* and there-fore expected to have sustained significant shear-enhanced compaction and pore collapse.
3.2 Microstructural Observations
The inelastic damage induced by hydrostatic and triaxial compression has been characterized from optical microscopy and SEM observations. Damage in the inelastically compacted samples is primarily associated with collapse of macropores.
400 500 300 200 100 0 nv (mm -3) 15 0 5 10 a) Sphericity > 0.78 0.59 < Sphericity ≤ 0.78 0 < Sphericity ≤ 0.59 D (μm) 872 blobs; macroporosity: 3.35% 350-650 300-350 250-300 200-250 150-200 100-150 50-100 33-50 nA (mm -2) 3.0 0 2.5 2.0 1.5 1.0 0.5 b) Equivalent diameter (μm) Figure 8
a) Distribution of equivalent diameter of the macropores identified by morphological analysis in intact Indiana limestone. The number of pores per unit volume nVis plotted versus the equivalent diameter D. The macropores were divided into three groups according to their
sphericity: sphericity > 0.78 (blue), 0.59 < sphericity ≤ 0.78 (green), 0 < sphericity ≤ 0.59 (brown); b) Size distribution of pores resolved from a scanned image at a resolution of 2 400 dpi (Vajdova et al., 2012). The number of pores per unit area nAis plotted versus equivalent
In the sample IH which was hydrostatically compressed to an additional 100 MPa beyond the critical pressure P* (Fig. 9a), macropores at different stages of collapse were observed
(Fig. 10a). Intragranular cracking at an early stage can be
observed in allochems, such as the one marked “A” in Figure 10b with numerous microcracks near the segment of the allochem boundary along which the micritic cement had delaminated. In this hydrostatically compacted sample, cata-clastic pore collapse seems to involve largely the cement, with most of the allochems remaining relatively intact. Figure 10c illustrates the later stage of collapse of a macropore within cement surrounded by five allochems. Intense microcracking had developed in the cement surrounding the macropore but the damage mode and intensity were heterogeneously distrib-uted around the pore, possibly due to the mechanical contrast between the micrite and sparry cement. Numerous cracks had emanated from the micropores and coalesced. Large and small spalled fragments have imploded into the cavity. Unlike a micritic limestone such as Tavel limestone which has many quasi-spherical macropores (Vajdova et al., 2010), the geome-try of a macropore in an allochemical limestone can be quite irregular, adding to the heterogeneity of the spatial distribu-tion of cataclastic damage in the periphery of a collapsed pore
(Fig. 10b,c).
In sample IC1 triaxially compressed at 20 MPa confining pressure to 0.5% of axial strain, no significant damage was visible, most probably because this sample was not deformed to a high enough amount of plastic strain. In the sample IC2 triaxially compressed at the same pressure but to a higher amount of strain, the development of shear-enhanced
compaction was manifested by pervasive collapse of macropores (Fig. 11a). Cataclastic pore collapse is mostly confined to within the cement and the allochems are rela-tively intact in this sample (Fig. 11b). Vajdova et al. (2012) showed that cracking within the allochems is typically occur-ring after accumulation of a significantly larger amount of plastic strain. The collapse of macropores in sample IC2 is accompanied by cataclastic damage in their peripheries analogous to those observed in the hydrostatically compacted sample IH (Fig. 11c).
3.3 MicroCT Imaging of Pore Collapse
The global histograms of the three deformed samples (Fig. 12) are qualitatively similar to the undeformed sample (Fig. 3b). Again even though two peaks can be recognized, unlike the sandstone histogram (Fig. 3a) the distributions on either sides of the peaks are not symmetric and there is a long tail to the left of the second peak that persists to relatively low gray levels to the right of the first peak. Accordingly, we follow the same protocol as before to segment each of the CT image into three distinct domains, by determining two thresholds
Ivoid* and Isolid* using Otsu’s (1979) method. Again, it should
be emphasized that, for this stage of our analysis, the quality of the data is such that segmentation into three phases was conducted on the microCT images of the deformed samples which had not been subjected to any filtering.
With reference to the histogram in Figure 12a, sample IH has two modes corresponding to gray levels of Ivoidp = 12 831
and Isolidp = 28 422 and the two thresholds determined using
3.0 2.5 2.0 1.5 1.0 0.5 0 Pc (MPa) 200 0 150 100 50 a) Volumetric strain (%) 1.6 1.4 1.2 1.0 0.8 0.6 0.4 0.2 Dif
ferential stress (MPa)
80 0 40 30 20 10 50 60 70 b) Axial strain (%) IC1 IC2 Pc = 20 MPa Figure 9
a) Confining pressure versus volumetric strain for Indiana limestone sample IH deformed hydrostatically beyond P*; b) Principal stress difference σ1– σ3versus axial strain for the triaxially compressed samples of Indiana limestone samples IC1 and IC2 deformed at 20 MPa of confining pressure beyond C*.
A 200 μm a) b) c) 100 μm Figure 10
Backcattered SEM images of sample IH deformed hydrostatically beyond P*. a) Pervasive collapse of macropores; b) Intragranular cracking at an early stage can be observed in allochems, such as the one marked “A”; c) Collapsed macropore within a cemented region that is surrounded by five allochems.
A 200 μm 20 μm a) b) c) Figure 11
Backcattered SEM images of sample IC2 triaxially deformed at 20 MPa of confining pressure. Direction of σ1is vertical. a) Pervasive collapse of macropores; b) Early stage of the collapse of a relatively small macropore; c) High magnification view of a collapsed macropore with cataclastic damage in its peripheries.
Otsu’s method in the intermodal region were Ivoid* = 17 771
and Isolid* = 27 826. Similarly sample IC1 (Fig. 12b) has two
modes at gray levels of Ivoidp = 13 297 and I p
solid= 28 440 and
the two thresholds determined using Otsu’s method were
Ivoid* = 18 126 and I
*
solid= 27 520. Sample IC2 (Fig. 12c) has
two modes Ipvoid= 13 034 and I p
solid= 29 045 and the two
thresholds were Ivoid* = 17 762 and I
*
solid= 28 294. According
to our segmentation analysis, the microCT image of each deformed sample can be separated into three distinct domains and the partitioning of voxel volume and porosity among the three domains is summarized in Table 1.
1.0 1.5 2.0 3.5
x 104
2.5 3.0
0.5
V
oxel volume fraction (%)
0.025 0 0.020 0.015 0.010 0.005 a) Gray level 3.5 x 10⁴ 3.0 2.5 2.0 1.5 1.0 0.5 0 V
oxel volume fraction (%)
0.025 0 0.020 0.015 0.010 0.005 c) Gray level 1.0 1.5 2.0 3.5 x 10⁴ 2.5 3.0 0.5 V
oxel volume fraction (%)
0.025 0 0.020 IH IC2 IC1 0.015 0.010 0.005 b) Gray level Figure 12
Distribution of X-ray attenuation (relative frequency) for samples of Indiana limestone: a) IH deformed hydrostatically beyond P*, IC1 b) and IC2 c) triaxially deformed at 20 MPa of confining pressure beyond C*.
V
oxel volume fraction (%)
a) Local porosity 0 0.005 0.010 0.015 0.020 0.025 0.030 0 0.1 0.2 0.3 0.4 0.5 0.6 0.7 0.8 I0-CT IH IC1 IC2 ρ ( μ m) b) vbb (%) 0 5 10 15 20 25 30 0 10 20 30 40 50 I0-CT IH IC1 IC2 Figure 13
a) Distribution of local porosity inferred from the μCT data in an undeformed and three deformed samples of Indiana limestone. Relative frequency is plotted as a function of the local porosity; b) Geometry of the backbone in the intermediate zone for the same samples. The ratio of backbone volume to its surface area ρ is plotted as a function of the backbone volume fraction vbb.
1 500 1 000 1 000 500 0 0 X (μm) 0 200 400 600 a) 800 1 000 1 200 1 400 500 1 500 Z ( μ m) 1 500 1 000 1 000 500 0 0 X (μm) 0 200 400 600 800 1 000 1 200 1 400 500 1 500 Z ( μ m) b) IH IC1 1 500 1 000 1 000 500 0 0 X (μm) 0 200 400 600 800 1 000 1 200 1 400 500 1 500 Z ( μ m) 10 20 30 40 50 60 70 Local porosity (%) c) IC2 Figure 14
Five slices from a sub-volume of samples of Indiana limestone a) IH deformed hydrostatically beyond P*, and IC1 b) and IC2 c) triaxially deformed beyond C* at 20 MPa of confining pressure. The partitioning between solid grains, macroporosity and the intermediate zone dominated by microporosity is shown.
Using Equation (2), the local porosity in the intermediate zone was calculated and plotted in Figure 13a. The inferred porosity distributions for the three deformed samples almost coincide with one another. For comparison, we also include the distribution for I0-CT, which seems slightly higher. This discrepancy between the undeformed and deformed samples is possibly related to the backbone geometry of the micro-porosity domain in these samples.
For each of the three deformed samples, after appropriate filtering as discussed above, our morphological analysis could identify only very few isolated clusters of microporosity that altogether occupy 1% or less of the voxel volume in its intermediate domain, which indicates that the domain is dominated by one interconnected backbone that percolates the sample. The voxel volume fractions vbbof IH, IC1 and
IC2 are respectively 34.07%, 35.44% and 31.20%, which are significantly lower than the value of 41.09% for the unde-formed sample (Fig. 13b). This decrease in the volume fraction of the microporosity domain is possibly related to inelastic compaction sustained in the samples.
Furthermore, the volume-to-area ratio ρ in the deformed samples IH, IC1 and IC2 has values of 21.2 μm, 21.9 μm and 21.6 μm, respectively (Fig. 13b). These are also significantly lower than the value of 26.3 μm in the undeformed sample I0-CT. If the microporosity backbone can be approximated as a thin-walled shell that percolates the sample, then the mean thickness of the shell is given by 2ρ. Our data therefore suggest that the inelastic compaction in Indiana limestone is manifested by not only a decrease in the volume fraction of the microporosity backbone, but also a corresponding decrease in its thickness from ~52 μm to ~42 μm.
In Figure 14, we present slices of segmented subvolumes of the three deformed samples. The spatial distribution of the three domains seems qualitatively similar to that in the unde-formed sample (Fig. 6). However, the macropores appear to be somewhat smaller and to an extent this is supported by the macropore size distributions of the deformed samples. Among the three, IH (Fig. 9a) and IC2 (Fig. 9b) were not unloaded until well after inelastic yielding and therefore expected to have significant damage and pore collapse, which should be reflected by corresponding decreases in the number of macropores observed in the microCT images
(Fig. 15a, c). In contrast, IC1 was unloaded soon after the
onset of shear-enhanced compaction and expected to have sustained relatively little damage and accordingly one would expect its pore size distribution (Fig. 15a) to be comparable to that in the undeformed sample I0-CT. Yet a comparison of Figure 8a with Figure 15a indicates a fundamental difference in the pore size distributions of I0-CT and IC1, which we interpret to be likely due to variability between samples and not mechanical deformation. We identified significantly more macropores in IC1 (1 146 versus 872 in I0-CT), many of which have relatively high sphericity and small equivalent diameter. If we defined a complex macropore as one with
400 500 300 200 100 0 nv (mm -3) 15 0 5 10 a) Sphericity > 0.78 0.59 < Sphericity ≤ 0.78 0 < Sphericity ≤ 0.59 D (μm) 359 blobs, macroporosity: 3.74% 400 500 300 200 100 0 nv (mm -3) 15 0 5 10 b) Sphericity > 0.78 0.59 < Sphericity ≤ 0.78 0 < Sphericity ≤ 0.59 D (μm) 1146 blobs, macroporosity: 2.71% 400 500 300 200 100 0 nv (mm -3) 15 0 5 10 c) Sphericity > 0.78 0.59 < Sphericity ≤ 0.78 0 < Sphericity ≤ 0.59 D (μm) 787 blobs macroporosity: 3.5% Figure 15
Distribution of equivalent diameter of the macropores identified by morphological analysis in the deformed samples of Indiana limestone IH a); IC1 b) and IC2 c). The number of pores per unit volume nVis plotted versus equivalent diameter D. The macropores
were divided into three groups according to their sphericity: sphericity > 0.78 (blue), 0.59 < sphericity ≤ 0.78 (green), 0 < sphericity ≤ 0.59 (brown).
Using the marching cubes algorithm, the surfaces associated with the three domains were mapped out. Our morphological analysis of the microCT images shows that both the solid and intermediate domains are basically interconnected. In partic-ular, the intermediate domain has a percolative backbone that occupies > 99% of the voxel volume, with a characteristic thickness (inferred from twice the volume-to-area ratio) on the order of 53 μm. As for the void domain, a significant propor-tion of its void space can be described as isolated macropores
(Fig. 7). While the pore size statistics show qualitatively similar
trend as the 2D data (Fig. 8), our new data underscore some of the 3D complexities of the macropores. We observed a number of complex macropores that extend over a length of > 1 mm (Fig. 7c).
Our observations point to two important questions related to the mechanical and transport properties of porous carbon-ate rock. First, what are the elastic and inelastic responses of these macropores to an applied stress field? Typically the cavities in a rock are modeled as one of two end-members: equant pores or elongated cracks. It seems that a complex pore in Indiana limestone is more akin to a cluster of equant pores connected by cracks and a deeper understanding of its deformation behavior would require systematic numerical simulation on the realistic geometry acquired from microCT. Second, how are the macropores and micropores connected among themselves to provide a percolative conduit for fluid transport? Since our observations indicate that the macro-pores are not interconnected, they by themselves cannot provide a percolative path for a fluid, which must therefore traverse parts of the interconnected microporosity domain to flow through. Mercury injection data on Indiana limestone (Churcher et al., 1991) indicate that the micropores are con-nected by throats with constricted apertures that are submi-cron. To quantitatively simulate the transport processes, more elaborate and systematic studies of these issues are warranted beyond the morphological analysis we pursued here. Our focus here is inelastic compaction and damage development and therefore, these issues are beyond the scope of this study. Nevertheless, there are recent investigations notably by Okabe and Blunt (2004), Al Kharusi and Blunt (2007) and Bauer et al. (2011) which have advanced the understanding on this front.
This study represents one of the first attempts to characterize the damage accumulated in an inelastically compacted carbonate rock using microCT imaging. Previously microstructural observations on thin-sections have shown that cataclastic collapse of the macropores is the dominant micromechanical process (Zhu et al., 2010; Vajdova et al., 2010, 2012). For three hydrostatically and triaxially compacted Indiana lime-stone samples, we have demonstrated that the CT image can also be segmented into three distinct domains.
Additional insights were gained from our 3D data. In all three compacted samples, the microporosity domains remain sphericity ψ < 0.3, similar to the example in Figure 7f , then
our analysis shows that IC1 has only two such pores that con-tribute to 0.15% porosity. In contrast, I0-CT has six relatively large complex pores that take up as much as 1.66% porosity.
Even if we take into account sample variability, since the numbers of macropores identified in IH (359) and IC2 (787) are lower than either I0-CT or IC1, we consider it likely that these decreases are related to inelastic damage. More pro-nounced decreases were inferred in pores with equivalent diameters of 100 μm or less (Fig. 15a,c), which are probably related to the collapse of this subset of macropores of rela-tively high sphericity, as documented in SEM observations
(Fig. 10).
However, the scenario for the complex macropores may be quite complicated. Our analysis shows that sample IH has three relatively large pores (with ψ < 0.3) that take up as much as 2.63% porosity and IC2 also has three large complex pores that contribute 0.96% porosity. It is possible that these features are related to mechanical damage but sample variability cannot be ruled out either. This issue cannot be resolved in the absence of a more comprehensive investigation into samples deformed to different stages of deformation.
CONCLUSIONS
Given the geometric complexity of its pore space, standard techniques for binarization of microCT data of a porous sili-ciclastic rock are not directly applicable to a carbonate rock. Hence most investigations of its pore structure have been done on 2D thin-sections, synthesizing observations on dif-ferent scales using the optical microscope and SEM. Additional information on geometry of the pores and throats may also be gained from mercury injection (Churcher et al., 1991) and NMR imaging (Gleeson and Woessner, 1991; Kleinberg, 1999). In this study, we developed a methodology that can extract 3D information from microCT data on the partitioning of porosity and pore size statistics in Indiana limestone.
The microCT image of Indiana limestone can be partitioned into three distinct domains by identifying two thresholds using Otsu’s (1979) method. There is an intermediate domain with attenuation coefficients that fall between those for the solid and void domains. Guided by microstructural observations and using a dual porosity framework, this intermediate domain was interpreted to be made up of voxels of solid embedded with micropores below the microCT resolution (Fig. 6). Using a linear interpolation scheme, the local porosity in this domain can be inferred and in agreement with previous microstructural observations on carbonate rocks (Baechle et al., 2008; Zhu et
al., 2010). The cumulative microporosity in this intermediate
domain was estimated to be more than half of the total porosity in Indiana limestone (Tab. 1).
interconnected. Our data suggest that the inelastic com-paction in Indiana limestone is manifested by not only a decrease in the volume fraction of the microporosity back-bone but also a corresponding decrease in its thickness by ~10 μm (Fig. 13b). Even if we take into account sample vari-ability and uncertainty related to the morphological analysis, the data suggest an overall decrease in the number of macro-pores in the compacted samples that are related to inelastic damage. To define a more definitive trend, a systematic investigation of samples deformed to different stages of dam-age is warranted. Although, we have focused on Indiana limestone in this study, it is likely that the methodology developed here can be applied to other porous limestones, which we intend to pursue in future work.
In the future, such analysis could potentially be pushed further using local microtomography, where only a certain part of a sample is imaged before and after deformation. However due to the intrinsic difficulty in performing loading/ unloading cycles on a sample without damaging it, we believe that such technique would only be useful to better understand mechanical compaction if a sample would be imaged in situ. To our knowledge, no existing in situ imaging system can yet reach the stress levels at which rocks such as Indiana limestone typically deform inelastically.
ACKNOWLEDGMENTS
The X-ray scanning was conducted by Jessie Maisano at the high resolution X-ray Facility of the University of Texas at Austin. We thank two anonymous reviewers for critical reviews on this manuscript. The research visit of Y. Ji to Stony Brook was partially supported by the China Scholarship Council. This research was partially supported by the Office of Basic Energy Sciences, Department of Energy under grant DE-SC0004118, by the National Science Foundation under grant EAR-1044967 and by the French Centre de la Recherche Scientifique (CNRS). The authors would also like to thank the CAPES-COFECUB program for stimulating fruitful discussions on compaction in carbonates.
REFERENCES
Al Kharusi A.S., Blunt M.J. (2007) Network extraction from sand-stone and carbonate pore space images, J. Petrol. Sci. Eng. 45, 41-46. Anselmetti F.S., Luthi S., Eberli G.P. (1998) Quantitative character-ization of carbonate pore systems by digital image analysis, AAPG Bull. 82, 1815-1836.
Arns C.H., Knackstedt M.A., Val Pinczewski W., Martys N.S. (2004) Virtual permeametry on microtomographic images, J. Petrol. Sci. Eng. 45, 41-46.
Auzerais F.M., Dunsmuir J., Ferreol B.B., Martys N., Olson J., Ramakrishnan T.S., Rothman D.H., Schwartz L.M. (1996) Transport in sandstone: A study based on three dimensional micro-tomography, Geophys. Res. Lett. 23, 705-708.
Baechle G.T., Colpaert A., Eberli G.P., Weger R.J. (2008) Effects of microporosity on sonic velocity in carbonate rocks, Lead. Edge 27, 8, 1012-1018.
Baud P., Schubnel A., Wong T.-F. (2000) Dilatancy, compaction and failure mode in Solnhofen limestone, J. Geophys. Res. 195, 19289-19303.
Bauer D., Youssef S., Han M., Bekri S., Rosenberg E., Fleury M., Vizika O. (2011) From microcomputed tomography images to resis-tivity index calculations of heterogeneous carbonates using a dual-porosity pore-network approach: Influence of percolation on the electrical transport properties, Phys. Rev. E 84, 011133.
Brace W.F., Silver E., Hadley K., Goetze C. (1972) Cracks and pores – a closer look, Science 178, 163-165.
Choquette P.W., Pray L.C. (1970) Geologic nomenclature and clas-sification of porosity in sedimentary carbonates, AAPG Bull. 54, 207-250.
Churcher P.L., French P.R., Shaw J.C., Schramm L.L. (1991) Rock properties of Berea sandstone, Baker dolomite and Indiana lime-stone, SPE International Symposium on Oilfield Chemistry, Anaheim, CA, 20-22 February, SPE 21044.
Coker D.A., Torquato S., Dunsmuir J.H. (1996) Morphology and physical properties of Fontainebleau sandstone via tomographic analysis, J. Geophys. Res. 101, 17497-17506.
Dresen G., Guéguen Y. (2004) Damage and rock physical properties, in Mechanics of Fluid-Saturated Rocks, Guéguen Y., Boutéca M. (eds), Elsevier, Amsterdam, pp. 169-217.
Folk R.L. (1980) Petrology of Sedimentary Rocks, Hemphill, Austin, 184 p.
Fredrich J.T. (1999) 3D imaging of porous media using laser scan-ning confocal microscopy with application to microscale transport processes, Phys. Chem. Earth A 24, 551-561.
Fredrich J.T., Evans B., Wong T.-F. (1989) Micromechanics of the brittle to plastic transition in Carrara marble, J. Geophys. Res. 94, 4129-4145.
Fredrich J.T., Menendez B., Wong T.-F. (1995) Imaging the pore structure of geomaterials, Science 268, 276-279.
Fredrich J.T., Di Giovanni A.A., Noble D.R. (2006) Predicting macroscopic transport properties using microscale image data, J. Geophys. Res. 111, B03201.
Gleeson J.W., Woessner D.E. (1991) Three-dimensional and flow-weighted NMR imaging of pore connectivity in a limestone, Magn. Reson. Imag. 9, 5, 879-884.
ILI (2007) Indiana Limestone Handbook, Indiana Limestone Institute of America, Inc., Bedford, IN, 22nd edition, 154 p. Ketcham R.A., Carlson W.D. (2001) Acquisition, optimization and interpretation of X-ray computed tomographic imagery: Applications to the geosciences, Comput. Geosci. 27, 381-400.
Kleinberg R.L. (1999) Nuclear magnetic resonance, in Experimental Methods in the Physical Sciences, Wong P.-Z. (ed.), Academic Press, San Diego, Vol. 35, pp. 337-385.
Knackstedt M.A., Latham S., Madadi M., Sheppard A., Varslot T. (2009) Digital rock physics: 3D imaging of core material and corre-lations to acoustic and flow properties, Lead. Edge 28, 1, 28-33. Lindquist W.B., Venkatarangan A., Dunsmuir J., Wong T.-F. (2000) Pore and throat size distributions measured from synchrotron X-ray tomographic images of Fontainebleau sandstones, J. Geophys. Res. 105, 21509-21527.
Lorensen W.E., Cline H.E. (1987) Marching cubes: A high resolution 3D surface construction algorithm, Comput. Graphics 21, 163-169. Lucia F.J. (1995) Rock-fabric/petrophysical classification of carbonate pore space for reservoir characterization, AAPG Bull. 79, 1275-1300.
Copyright © 2012 IFP Energies nouvelles
Permission to make digital or hard copies of part or all of this work for personal or classroom use is granted without fee provided that copies are not made or distributed for profit or commercial advantage and that copies bear this notice and the full citation on the first page. Copyrights for components of this work owned by others than IFP Energies nouvelles must be honored. Abstracting with credit is permitted. To copy otherwise, to republish, to post on servers, or to redistribute to lists, requires prior specific permission and/or a fee: Request permission from Information Mission, IFP Energies nouvelles, fax. +33 1 47 52 70 96, or [email protected].
Myer L.R., Kemeny J., Cook N.G.W., Ewy R., Suarez R., Zheng Z. (1992) Extensile cracking in porous rock under differential com-pressive stress, Appl. Mech. Rev. 45, 263-280.
Okabe H., Blunt M.J. (2004) Prediction of permeability for porous media reconstructed using multiple-point statistics, Phys. Rev. E. 70, 066135.
Otsu N. (1979) A threshold selection method from gray-level histograms, IEEE Trans. Syst. Man. Cybern. 9, 62-66.
Paterson M.S., Wong T.-F. (2005) Experimental Rock Deformation – The Brittle Field, Spinger-Verlag, New York, 2nd ed., 348 p. Patton J.B., Carr D.D. (1982) The Salem Limestone in the Indiana Building-Stone District, Department of Natural Resources, Geological Survey Occasional Papers 38, Bloomington, IN, 31 p. Pittman E.D. (1971) Microporosity in carbonate rocks, AAPG Bull. 55, 1873-1878.
Robinson R.H. (1959) The effect of pore and confining pressure on the failure process in sedimentary rocks, Colorado School of Mines Quart. 54, 177-199.
Russ J.C. (1990) Computer-Assisted Microscopy, The Measurement and Analysis of Images, Plenum, NY, 453 p.
Spanne P., Thovert J.F., Jacquin C.J., Lindquist W.B., Jones K.W., Adler P.M. (1994) Synchrotron computer microtomography of porous media: Topology and transports, Phys. Rev. Lett. 73, 2001-2004.
Sun W.C., Andrade J.E., Rudnicki J.W., Eichhubl P. (2011) Connecting microstructural attributes and permeability from 3D tomographic images of in situ shear-enhanced compaction bands using multiscale computations, Geophys. Res. Lett. 38, L10302. Underwood E.E. (1970) Quantitative Stereology, Addison Wesley, Reading, 274 p.
Vajdova V., Baud P., Wong T.-F. (2004) Compaction, dilatancy and failure in porous carbonate rocks, J. Geophys. Res. 109, B05204. Vajdova V., Zhu W., Chen T.-M.N., Wong T.-F. (2010) Micro-mechanics of brittle faulting and cataclastic flow in Tavel limestone, J. Struct. Geol. 32, 1158-1169.
Vajdova, V., P. Baud, L. Wu, T.-F. Wong (2012), Micromechanics of inelastic compaction in two allochemical limestones, J. Struct. Geol. 43, 100-117.
Wadell H. (1935) Volume, shape and roundness of quartz particles, J. Geol. 43, 250-280.
Wawersik W.R., Fairhurst C. (1970) A study of brittle rock fracture in laboratory compression experiments, Int. J. Rock Mech. Min. Sci. 7, 561-575.
White J.A., Borja R.I., Fredrich J.T. (2006) Calculating the effective permeability of sandstone with multiscale lattice Boltzmann/finite element simulations, Acta Geotech. 1, 195-209.
Wong T.-F., David C., Menéndez B. (2004) Mechanical compaction, in Mechanics of Fluid-Saturated Rocks, Guéguen Y., Boutéca M. (eds), Elsevier Academic Press, Amsterdam, pp. 55-114.
Zhan X., Schwartz L.M., Toksoz M.N., Smith W.C., Morgan F.D. (2010) Pore-scale modeling of electrical and fluid transport in Berea sandstone, Geophysics 75, F135-F142.
Zheng Z. (1989) Compressive stress-induced microcracks in rocks and application to seismic anisotropy and borehole stability, PhD Thesis, UC Berkeley, 227 p.
Zhu W., Baud P., Wong T.-F. (2010) Micromechanics of cataclastic pore collapse in limestone, J. Geophys. Res. 115, B04405.
Final manuscript received in January 2012 Published online in November 2012