UNIVERSITÉ
DU
QUÉBEC
À
MONTRÉAL
THE INCREASE IN
REAL WAGE VOLATILITY AND
STRUCTURAL CHANGES
IN
THE U.S. LABOR MARKET
THESIS
PRESENTED
AS PARTIAL REQUIREMENT
OF DOCTOR OF PHILOSOPHY IN
ECONOMICS
BY
JULIEN CHAMPAGNE
Avertissement
La diffusion de cette thèse se fait dans le respect des droits de son auteur, qui a signé le formulaire Autorisation de reproduire et de diffuser un travail de recherche de cycles supérieurs (SDU-522 - Rév.01-2006). Cette autorisation stipule que «conformément à l'article 11 du Règlement no 8 des études de cycles supérieurs, [l'auteur] concède à l'Université du Québec à Montréal une licence non exclusive d'utilisation et de publication de la totalité ou d'une partie importante de [son] travail de recherche pour des fins pédagogiques et non commerciales. Plus précisément, [l'auteur] autorise l'Université du Québec à Montréal à reproduire, diffuser, prêter, distribuer ou vendre des copies de [son] travail de recherche à des fins non commerciales sur quelque support que ce soit, y compris l'Internet. Cette licence et cette autorisation n'entraînent pas une renonciation de [la] part [de l'auteur] à [ses] droits moraux ni à [ses] droits de propriété intellectuelle. Sauf entente contraire, [l'auteur] conserve la liberté de diffuser et de commercialiser ou non ce travail dont [il] possède un exemplaire.»
UNIVERSITÉ DU QUÉBEC À
MONTRÉAL
L'AUGMENTATION DE VOLATILITÉ DES SALAIRES RÉELS
ET CHANGEMENTS STRUCTURELS DANS LE
:
MARCHÉ DU
TRAVAIL AUX ÉTATS-UNIS
THÈSE
PRÉSENTÉE
COMME EXIGENCE PARTIELLE
DU DOCTORAT EN ÉCONOMIQUE
PAR
JULIEN CHAMPAGNE
Je reconnais avec gratitude la direction, l'aide et le support apportés par mon directeur de recherche, André Kurmann, sans qui la complétion de cette thèse n'aurait pas été possible. Notre collaboration sur deux articles de cette thèse s'est avérée pour moi être une très grande expérience d'apprentissage. Cette thèse a aussi bénéficié des commentaires judicieux de plusieurs professeurs au Départ e-ment des sciences économiques de l'UQAM, notamment ceux de Steve Ambler et d'Alain Delacroix; des éditeurs au Journal of Monetary Economies, ainsi qu'un arbitre anonyme.
J'aimerais remercier le personnel administratif du Département: Martine, Jacinthe, Julie, Francine, et Lorraine pour leur constante aide et patience et pour m'avoir rendu la vie plus facile autant comme étudiant que comme enseignant; mes an-ciens collègues, particulièrement Eric Dufresne et Jennifer Cigana pour leur grande amitié, curiosité, humour, et support moral; ainsi que Jérémy Chaudourne qui a toujours réponse à mes questions mathématiques et informatiques. Je ne pourrais aussi passer par-dessus les innombrables conversations avec Jean Soucy pendant les quatre années et demie durant lesquelles j'ai eu la chance de le côtoyer. Son décès en avril 2011 nous aura tous laissés orphelins de son entrain et de sa joie de vivre.
Je ne pourrai remercier assez souvent ma famille, surtout mes parents, pour leurs encouragements à poursuivre mes études et leur support autant moral que fi-nancier. Ils ont eu une profonde influence sur la réalisation de cette thèse et je leur en serai toujours reconnaissant.
Finalement, je suis infiniment redevable envers ma conjointe, Marie, avec qui je partage ma vie depuis maintenant cinq années. Elle a fait preuve de patience, d'amour, de compréhension, et m'a éclairé lors des moments les plus sombres et difficiles.
CONTENTS
LIST OF FIGURES vm LIST OF TABLES x RÉSUMÉ . . Xll ABSTRACT xv INTRODUCTION 1 CHAPTER ITHE GREAT INCREASE IN RELATIVE WACE VOLATILITY IN THE
UNITED STATES 4
1.1 Introduction . . . . . . . . . . . . . 4
1.2 Hourly wages during the Great Moderation . 8
1.2.1 Data .. . .. 1.2.2 Main results .
1.2.3 Evidence from alternative hourly wage measures . 1.2.4 Other changes in labor market dynamics
1.3 A doser look at disaggregated data . . . . . . .
1.3.1 Wage volatility across different decompositions . 1.3.2 Volatility accounting . . .
1.4 vVage volatility in general equilibrium . 1.4.1 Model .. . 1.4.2 Calibration 1.4.3 Simulations 8 9 11 17 19 19 23
26
29 33 38 1.5 Conclusion . . . . . 42 CHAPTER IIRECONCILING THE DIVERGENCE IN AGGREGATE U.S. WACE SE-RIES . . . . . . . . . . . . . . . . . . . . . . . . . . . . . 44
2.1 2.2
2.3
Introduction . . . .. . • • 0 • Divergent average wages: data and facts 2.2.1 Data ..
2.2.2 Trends .
2.2.3 Business cycle volatilities . 2.2.4 Correlations . .
Potential explanations 2.3.1 Earnings versus hours
2.3.2 Differences in earnings concepts
2.3.3 Differences in population coverage . 2.3.4 Measurement issues .
2.4 Conclusion . . . . CHAPTER III
THE CARROT AND THE STICK: THE BUSINESS CYCLE IMPLI CA-44 48 48 51 52 54 55 56 63 72 79
80
TIONS OF Il CENTIVE PAY IN THE LABOR SEARCH MODEL . 83
3.1 Introduction . . . . 83
3.2 Empirical evidence 87
3.3 A DSGE model with incentive pay and matching frictions 3.3.1 Labor market
3.3.2 Households 3.3.3 Firms . . . 3.3.4 Bargaining
3.3.5 Aggregation and madel dynamics 3.4 Calibration and steady states
3.5 Simulations . . . . . . . . . . 3.5.1 Impulse response functions .
90
92 93 95 97102
104108
109
Vl
3.5.2 Second moments . . . . . . . . . . . . . . . . . . . . 110 3.5.3 The Shimer puzzle and an alternative calibration strategy 114
3.5.4 Quantitative exercise 116
3.6 Conclusion. 118
CONCLUSION . 121
APPENDIX A
SUPPLEMENTAL MATERIAL FOR 11THE GREAT INCREASE IN REL-ATIVE WAGE VOLATILITY IN THE UI ITED STATES11 124
A.1 Data Description . . . . 124
A.1.1 Macro Variables. 124
A.1.2 Labor Productivity and Costs (LPC) 125
A.1.3 The Current Population Survey (CPS) 127
A.1.4 Current Employment Statistics 131
A.2 Computation of Standard Errors . . . 132
A.3 Aggregate Moments - Robustness checks 134
A.3.1 Alternative priee deflator . . . . 134
A.3.2 Alternative hourly wage series . 135
A.3.3 Total Compensation vs. Wage and Salaries . 138 A.3.4 Hours: LPC vs. CES . . . . . . 140
A.4 Wage volatility across decompositions . 141
A.4.1 Detailed results . . . . . . . . . 141
A.4.2 Occupation / Gender decomposition 143
A.5 Volatility accounting: Details 144
A.6 DSGE Model: Details 150
A.6.1 Model . . . . . 150
A.6.2 Sorne linearizations 156
A.8 Robustness to other shocks . . . . . . . . . . . . . . . . . . 167 APPENDIX B
SUPPLEMENTAL MATERIAL FOR "RECONCILING THE DIVERGENCE
IN AGGREGATE U.S. WAGE SERIES" 170
B.1 Data Description . . . . 170
B.1.1 Macro Variables . 170
B.1.2 Labor Productivity and Costs (LPC) 171
B.1.3 The Current Population Survey (CPS) 173
B.l.4 Current Employment Statistics . . . . 179 B.1.5 National Income and Product Accounts (NIPAs) 180 B.2 Topcode adjustments: Income data from Piketty-Saez . .
.
182 B.2.1 Using P-S data to estimate means above the topcode in the CPS183 B.3 Computation of Standard Errors . . . . . . . . . . 187 APPE DIX CSUPPLEMENTAL MATERIAL FOR "BUSINESS CYCLE IMPLICATIONS OF INCENTIVE PAY IN THE LABOR SEARCH MODEL". 188
C.1 Data .. . . 188
C.2 Surplus from employment 191
C.2.1 Efficiency-wage sector 191
C.2.2 Performance-pay wage sector 194
C.3 System of equations 195
LIST OF FIGURES
Figure Page
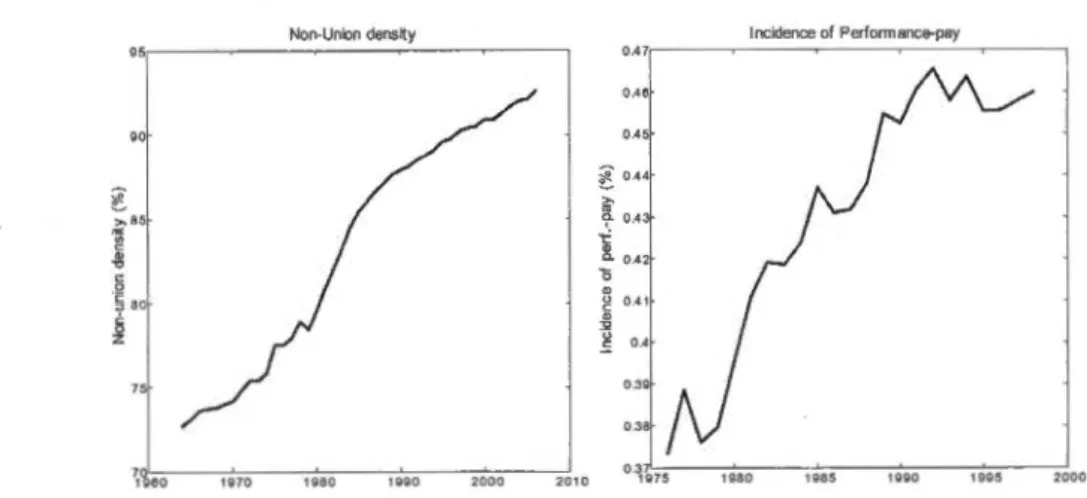
1.1 Standard deviations of output and real hourly wages and relative standard deviation . . . . . . . . . . . . . . . . . . 11 1.2 Evolution of non-union density (left panel) from nonfarm business
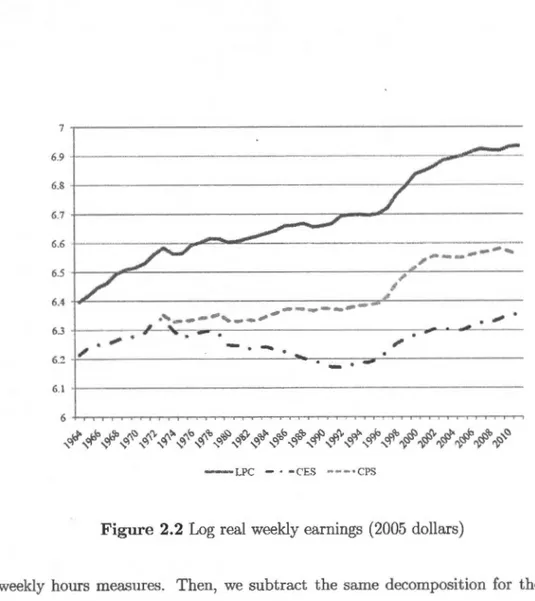
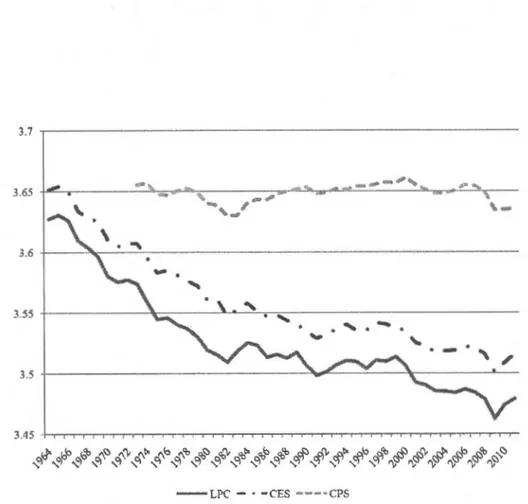
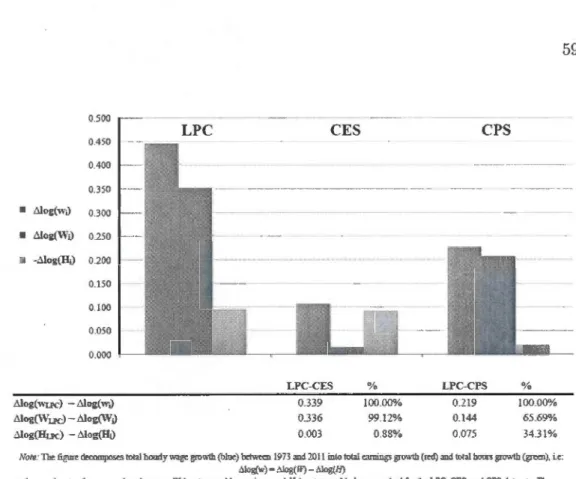
workers and incidence of performance-pay (right panel) in the U.S. 27 2.1 Real hourly wages (2005 dollars) . . . . 52 2.2 Log real weekly earnings (2005 dollars) 57 2.3 Log weekly hours . . . . . . . . . 58 2.4 Accounting for the divergence in average hourly wage growth . 59 2.5 Accounting for the divergence in business cycle volatility of average
hourly wages . . . . . . . . . . . . . . . . . 62 2.6 Comparison of aggregate weekly earnings measures 65 2.7 Log average real earnings for different income groups 70 2.8 Log average real income corrected for high-income individuals 71 2.9 Log real average earnings for different population coverage in the
CES . . . . . . . . . . . . . . . . . . . . . . . . . . . . . . . 73 2.10 Replicating log average real earnings from the CES with CPS data 75 2.11 Replicating log average real hourly wages from the CES with CPS
data . . . . . . . . . . . . . . . . . . . . 77 3.1 Evolution of incidence of performance-pay in the U.S. for the
pri-vate nonfarm economy . . . . . . . . . . . . . . . . . . . . . . . 88 3.2 Impulse response functions (IRFs) following a technology shock 110 A.1 Real average hourly compensation and wages and salaries, in logs
Ao2 LPC and CES total nonfarm business hours in logs (left) and HP-fil tered ( right) 0 0 0 0 0 0 0 0 0 0 0 0 0 0 0 0 0 0 0 0 0 0 0 0 0 0 0 0 0 141 Ao3 Labor market responses to a positive technology shock (left) and a
preference shock (right) 0 0 0 0 0 0 0 0 0 0 0 0 0 0 0 0 0 0 0 0 0 0 0 0 167 Ao4 La bor market responses to a technology shock (left) and a
LIST OF TABLES
Table Page
1.1 Changes in volatility 10
1.2 Changes in volatility 14
1.3 Changes in labor market dynamics 18
1.4 Changes in average hourly wage volatility . 20 1.5 Changes in average hourly wage volatility . 22 1.6 Relative volatility accounting across different decompositions 26
1. 7 Mo del calibration . 34
1.8 Model simulations . 38
2.1 Changes in business cycle volatilties . 54
2.2 Changes in business cycle correlations . 55
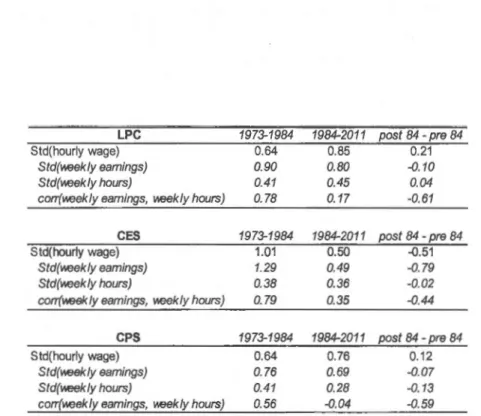
2.3 Changes in standard deviations and correlations of weekly earnings
and weekly hours . . . . . . . . . . . . . . 61 2.4 Comparison of aggregate weekly earnings measures 66
2.5 Effect of high-income individuals on average earnings volatilities 72 2.6 Replicating average real earnings volatility from the CES with CPS
data . . . . . . . . . . . . . . . . . . . . . . . . . . . 76 2.7 Replicating average real hourly wage volatility from the CES with
CPS data . . . . . . . . . . 78
3.1 Changes in business cycle volatilities
3.2 Calibrated parameter and steady state values 3.3 Model simulations . . . . . . . . . . . . . .
89
105 111
3.4 Alternative calibration strategy 115
3.5 Model simulations . . . . . . . . 116
3.6 Model simulations - Quantitative exercise . 117
A.1 Changes in volatility 135
A.2 Changes in volatility 136
A.3 Replicating average real hourly wage volatility from the CES with CPS data . . . . . . . . . . . . . . . . . . . . . . . . . . 137
A.4 Changes in volatility : Total Compensation vs. Wages and Salaries 140
A.5 Evolution of EducationjGender Wage Components 142
A.6 Evolution of Education/ Age Wage Components . . 143
A.7 Evolution of Education/Compensation Status Wage Components 144
A.8 Evolution of Education / Industry(10) vVage Components . 145 A.9 Evolution of Occupation/Gender Wage Components . 146 A.10 Model simulations: Alternative shocks . . . . . . . . 169
RÉSU1VIÉ
Cette thèse comprend trois articles qui portent sur les changements dans le marché de travail aux États-Unis, et de leurs effets sur le comportement dynamique des salaires réels moyens en particulier et le cycle économique en général. Le pr
e-mier article documente de façon détaillée l'augmentation de volatilité relative des salaires réels aux États-Unis qui a eu lieu durant la Grande Modération et propose
une explication théorique pour ce phénomène. Le deuxième article se penche sur
la divergence marquante au niveau de la tendance et du cycle des deux mesures
agrégées les plus populaires de salaire moyen aux États-Unis, et offre des
expli-cations pour ces divergences. Finalement, le troisième chapitre tente d'établir un
lien théorique entre deux phénomènes qui sont survenus dans le marché du tr
a-vail lors des trente dernières années, soit l'augmentation de volatilité relative des
salaires réels (documentée dans le premier article) et l'augmentation de l'incidence
de la rémunération liée à la performance dans l'économie américaine.
Le premier article documente qu'au cours des 25 dernières années, la volatilité du salaire réel horaire moyen a augmenté substantiellement par rapport à la celle du PIB réel aux États-Unis. Utilisant des micro-données provenant du Current Population Survey (CPS) nous montrons que cette augmentation est principa
le-ment due aux augmentations de volatilités relatives des salaires horaires moyens
de différents groupes de travailleurs dans la force de travail et non pas à cause
de biais de composition dans celle-ci. Des simulations provenant d'un modèle d'équilibre général dynamique stochastique (DSGE) illustrent qu'il est très peu probable que l'augmentation observée de la volatilité relative des salaires moyens
provienne de changements à l'extérieur du marché de travail (e.g. de chocs ex -ogènes moins fréquents ou d'une politique monétaire plus agressive). Par contre, une plus grande flexibilité dans la détermination des salaires, due à la baisse du
niveau de syndicalisation et à l'augmentation de l'incidence de la rémunération liée à la performance tels qu'observées dans les données du marché de travail américain, est capable d'expliquer une portion substantielle de l'augmentation
de volatilité relative des salaires moyens. Cette plus grande flexibilité dans la détermination des salaires implique aussi une diminution de la volatilité du cycle économique, suggérant ainsi une nouvelle explication à la Grande Modération.
Le deuxième article documente la divergence graduelle, autant en taux de crois-sance qu'en volatilité cyclique, des deux mesures de salaires moyens les plus util -isées pour l'économie américaine: les revenus horaires moyens provenant du Labor
Productivity and Cast (LPC) program and les revenus horaires moyens du Current Employment Statistics (CES). Pendant que le salaire horaire LPC augmentait de
70% durant les quatre dernières décennies et devint beaucoup plus volatile au début des années 1980, le salaire horaire CES crü de seulement 20% durant la
même période et a vu sa volatilité réduire après le début des années 1980. Nous avons déterminé que la divergence entre les deux mesures de salaire est due à une évolution très différente des revenus moyens par travailleur, et non à cause des
heures travaillées (ces dernières évoluent de façon similaires). Nous utilisons e n-suite des données sur les salaires provenant du CuTrent Population Survey (CPS),
des National Income and Product Accounts (NIPAs), et de Piketty et Saez (2003) pour tenter de réconcilier la divergence entre les revenus moyens par travailleur. Notre analyse indique que des différences dans la définition des revenus et clans les
populations échantillonnées peuvent expliquer une grande partie de la divergence. Notre analyse montre aussi que les différences entre les revenus provenant du CPS
et du LPC peuvent être attribuées presqu'entièrement par les revenus des indi
-vidus très fortunés ainsi qu'aux suppléments aux salaires tels que les contributions
des employeurs aux pensions de retraite, qui sont inclus dans LPC mais pas dans
CPS. Ce résultat est intéressant en soi étant donné l'utilisation très répandue dans
les études utilisant les données en coupes transversales du CPS.
Le troisième article considère un modèle de type du "cycle réel" (RBC) avec des
frictions sur le marché du travail où sont introduites deux types de rémunération · liée à l'effort. L'idée derrière ceci suit de près les travaux de la littérature
mi-croéconomique sur le performance-pay ( e.g. Lazear, 1986). Dans le modèle, la
négociation se fait avant d'observer les chocs à la période t pour les deux types de
rémunération, mais l'objet de la négociation est très différente sous chaque type.
La première forme de rémunération est une sorte de salaire d'efficience suivant l'intuition derrière le modèle de shiTking de Shapiro et Stiglitz (1984), tandis que
la seconde est apellée performance-pay car la négociation se fait autour d'une fo r-mule salariale qui lie le salaire à la production du travailleur. L'élément-clé ici est
que le travailleur peut ajuster son effort (et donc sa performance) à chaque période étant donné l'état de l'économie. J'utilise le modèle pour simuler un changement dans l'incidence de la paie-à-la-performance tel qu'observé dans le marché du
travail américain et j'évalue si ce type de changement structurel peut expliquer si -multanément les deux phénomènes documentés ci-haut: la Grande Modération et l'augmentation de volatilité relative des salaires réels moyens. Alors que le mod-èle implique un salaire moyen plus volatile lorsque l'incidence de la rémunération à la performance est plus élevée, il implique aussi une plus grande volatilité de
l'output et une plus grande corrélation entre le salaire réel moyen et l'output, deux résultats contrefactuels à l'expérience vécue par l'économie américaine durant la Grande Modération. Ces résultats posent un grand défi à l'idée qu'une plus grande flexibilité des salaires due à une plus grande incidence de la paie-à-la-performance
XlV
peut répliquer les statistiques du cycle économique observées avant et pendant la Grande Modération.
Mot-clés: cycle économique, salaires, volatilité des salaires, Grande Modération, rémunération liée à la performance, marché du travail, modèle d'appariement.
This thesis consists of three chapt ers related to structural changes in the U.S. labor market and their effects on the business cycle behavior of average real wages in particular and macroeconomie variables in general. The first chapter documents
in details the increase in real wage volatility during the Great Moderation period and puts forward a theory to explain this new stylized fact. The second chapter
looks into the divergence both in terms of trend and business cycle of two of the most popular and readily available average hourly wage series in the U.S., and offers explanations to explain the divergent behavior of the two series. Finally, the third chapter builds on the first and tries to develop a theory linking the increase in wage volatility to the increase incidence of performance-pay schemes in the U.S. economy.
The first chapter documents that over the past 25 years, real average hourly wages in the United States have become substantially more volatile relative to output. Microdata from the Current Population Survey (CPS) is used to show that this increase in relative volatility is predominantly due to increases in the relative volatility of hourly wages across different groups of workers. Compos
i-tional changes of the workforce, by contrast, account for only a small fraction of the increase in relative wage volatility. Simulations with a Dynamic Stochastic General Equilibrium (DSGE) model illustrate that the observed increase in rel a-tive wage volatility is unlikely to come from changes outside of the labor market ( e.g. smaller exogenous shocks or more aggressive monetary po licy). By co n-trast, greater flexibility in wage setting due to deunionization and a shift towards performance-pay contracts as experienced by the U.S. labor market is capable of accounting for a substantial fraction of the observed increase in relative wage volatility. Greater wage flexibility also decreases the magnitude of business cycle fluctuations, suggesting an interesting new explanation for the Great Moderation. The second chapter documents the graduai divergence in trend growth and busi-ness cycle volatility of two popular aggregate ho url y wage series for the U .S. econ-omy: average hourly compensation from the Labor Productivity and Cost (LPC) program and average hourly earnings from the Current Employment Statistics (CES). While the LPC wage increased by about 70% over the past four decades and became markedly more volatile starting in the 1980s, the CES wage grew by only about 20% over the same period and experienced a large drop in volatility
XVI
post-1980. We establish that the divergence between the two aggregate hourly wage series is due to the different evolution of average labor earnings. Average hours worked, by contrast, evolve very similarly. We then use labor earnings data from the Current Population Survey (CPS), the National Incarne and Product Accounts (NIPAs), and Piketty and Saez (2003) in an attempt to reconcile the divergence between LPC and CES labor earnings. Our analysis indicates that dif-ferences in earnings concept and population coverage can account for a large part of the divergence. Our analysis also shows that earnings differences between the CPS and the LPC can be attributed almost entirely to earnings of high-income individuals and supplements such as employer contributions to pension and health plans, which are included in the LPC but not in the CPS. This result is interesting in its own right given the widespread use of micro earnings data from the CPS in cross-sectional studies.
The third and last chapter considers a real business cycle model with labor search frictions where two types of incentive pay are explicitly introduced following the insights from the micro liter at ure on performance-pay ( e.g. Lazear, 1986). While in both schemes workers and firms negotiate ahead of time-t information, the a b-ject of the negotiation is different. The first scheme is called an 'efficiency-wage' as it follows closely the intuition of the shirking model by Shapiro and Stiglitz (1984), while the second is called a 'performance-pay' wage as the negotiation occurs over a wage schedule that links the worker's wage to his output. The key feature here is that the worker can then adjust his effort (i.e. performance) level in any period. I simulate a shift towards performance-pay contracts as experi-enced by the U.S. labor market to assess if it can account simultaneously for two documented business cycle phenomena: the increase in relative wage volatility and the Great Moderation. While the model yields higher wage volatility when performance-pay is more pervasive in the economy, it produces higher volatility of output and higher procyclicality of wages, two results counterfactual to what the U.S. economy has experienced during the Great Moderation. These results pose a challenge to the idea that higher wage flexibility through an increase in performance-pay schemes can account for business cycle statistics observed over the last thirty years.
Keywords: business cycle, wages, wage volatility, Great Moderation, performance pay, labor market, search and matching.
This thesis actually started sorne years ago when I was an M.A. student at UQAM, when we found one single, puzzling observation: during the Great Moderation, a period of unprecedented macroeconomie stability in the U.S. and in many indus-trialized countries, the business cycle volatility of real hourly wages in the U.S. has increased significantly such that the relative volatility of real hourly wages to output became 2.5 to 3.5 times larger than before the Great Moderation period. The three chapters all tackle this observation in one way or another, trying to seek what we can understand on the labor market from wage dynamics and vice versa.
The first chapter, coauthored with Andre Kurmann, aims directly at this observa-tion and documents that over the past 25 years, real average hourly wages in the United States have become substantially more volatile relative to output. Micro-data from the Current Population Survey (CPS) is used to show that this increase in relative volatility is predominantly due to increases in the relative volatility of hourly wages across different groups of workers. Compositional changes of the workforce, by contrast, account for only a small fraction of the increase in rela-tive wage volatility. Simulations with a Dynamic Stochastic General Equilibrium (DSGE) model illustrate that the observed increase in relative wage volatility is unlikely to come from changes outside of the labor market ( e.g. smaller exoge-nous shocks or more aggressive monetary policy). By contrast, greater fiexibility in wage setting due to deunionization and a shift towards performance-pay contracts as experienced by the U.S. labor market is capable of accounting for a substantial
- - -
---2
fraction of the observed increase in relative wage volatility. Greater wage fiexi-bility also decreases the magnitude of business cycle fluctuations, suggesting an interesting new explanation for the Great Moderation.
The second chapter (also coauthored with Andre Kurmann) builds on the first chapter as it documents the gradual divergence in trend growth and business cycle volatility of two popular aggregate hourly wage series for the U.S. econ-omy: average hourly compensation from the Labor Productivity and Cost (LPC) program and average hourly earnings from the Current Employment Statistics (CES). While the LPC wage increased by about 70% over the past four decades and became markedly more volatile starting in the 1980s, the CES wage grew by only about 20% over the same period and experienced a large drop in volatility post-1980. We establish that the divergence between the two aggregate hourly wage series is due to the different evolution of average labor earnings. Average hours worked, by contrast, evolve very similarly. We then use labor earnings data from the Current Population Survey (CPS), the National Income and Product Accounts (NIPAs), and Piketty and Saez (2003) in an attempt to reconcile the divergence between LPC and CES labor earnings. Our analysis indicates that dif-ferences in earnings concept and population coverage can account for a large part of the divergence. Our analysis also shows that earnings differences between the CPS and the LPC can be attributed almost entirely to earnings of high-income individuals and supplements such as employer contributions to pension and health plans, which are included in the LPC but not in the CPS. This result is interesting in its own right given the widespread use of micro earnings data from the CPS in cross-sectional studies.
Finally, the third chapt er aims at first defining a more "serious" theory of performance-pay in general equilibrium and then takes this theory to the data. It considers a real business cycle model with labor search frictions where two types of incentive
pay are explicitly introduced following the insights from the micro literature on performance-pay (e.g. Lazear, 1986). While in both schemes workers and firms negotiate ahead of time-t information, the object of the negotiation is different. The first scheme is called an 'efficiency-wage' as it follows closely the intuition of the shirking model by Shapiro and Stiglitz (1984), while the second is called a 'performance-pay' wage as the negotiation occurs over a wage schedule that links the worker's wage to his output. The key feature here is that the worker can then adjust his effort (i.e. performance) level in any period. I simulate a shift towards performance-pay contracts as experienced by the U.S. labor market to asses if it can account simultaneously for two documented business cycle phenomenons: the increase in relative wage volatility and the Great Moderation. While the model yields higher wage volatility when performance-pay is more pervasive in the eco n-omy, it produces higher volatility of output and higher procyclicality ofwages, two results counterfactual to what the U.S. economy has experienced during the Great Moderation. These results pose a challenge to the idea that higher wage fiexibility through an increase in performance-pa y schemes can account for business cycle statistics observed over the last thirty years.
CHAPTER
I
THE
GREAT
INCREASE IN
RELATIVE WAGE VOLATILITY
IN THE
UNITED STATES
1.1
Introduction
The 25 years prior to the most recent recession were a time of unprecedented macroeconomie stability for the United States. During that period, referred to by many as the 'Great Moderation', the business cycle volatility of output declined by more than 50% and the volatility of many other macroeconomie aggregates fell by similar proportions.1
This paper documents that the Great Moderation does not apply to one of the most prominent labor market aggregates: real average hourly wages (or 'hourly wages' for short). Specifically, we document that from 1953-1983 to 1984-2006, the business cycle volatility of hourly wages increased by 15% to 60%, depending on the dataset and filtering method used. As a result, the business cycle volatility of hourly wages relative to the volatility of aggregate output became 2.5 to 3.5 times larger over the two sample periods.
The increase in volatility of hourly wages raises several related questions. First,
does this increase apply similarly for different groups of workers? Second, how much of the increase in volatility is due to compositional changes; i.e. a shift of the workforce towards jobs with more volatile wages? Third, to what extent is
the increase in volatility related to structural changes in the U.S. labor market? Fourth, how do these labor market changes contribute to our understanding of
the Great Moderation?
To answer the first and second question, microdata from the Current Population Survey (CPS) is used to construct hourly wage series for different groups of work
-ers. This data reveals that the increase in absolute volatility of hourly wages is
larger for male, skilled and salaried workers. Also, there are sizable differences
across industries, with absolute volatilities of hourly wages decreasing in sorne
industries. However, these decreases are generally modest and thus, the volati l-ity of hourly wages relative to the volatility of output increases substantially for
all worker groups considered. We call this phenomenon the 'Great Increase in Relative Wage Volatility'.
Based on the CPS data, a volatility accounting method is developed to quantify how much of the increase in the relative volatility of average hourly wages is due to compositional changes of the workforce towards jobs with more volatile wages and howmuch is due to increases in the relative volatility of hourly wages across the different worker groups. The main result coming out of this exercise is that the latter accounts for 69% or more of the increase in the relative volatility of
average hourly wages. Compositional changes, by contrast, account for at most 12%. This suggests that the increase in relative wage volatility is due to structural changes in the economie environment that affect wage dynamics of different groups
of workers in similar ways although to varying degrees.
6
General Equilibrium (DSGE) model to quantify the effects of two particular struc -tural changes in the U.S. labor market: deunionization and increased incidence of performance-pay. The focus on these two changes is motivated by a combina -tian of empirical observations. First, over the past decades, the U.S. experienced a
marked decline in private-sector unionization (e.g. Farber and Western, 2001) and
a shift towards performance-pay contracts (e.g. Lemieux et al., 2009a). Second,
the comparison of different datasets reveals that the increase in wage volatility
is largest for workers who are on average more likely to have experienced de u-nionization and a shift towards performance-pay. Third, Lemieux et al. (2009b)
show that wages are most responsive to locallabor market shocks for non-union workers with performance-pay contracts and least responsive for union workers without performance-pay. Exactly the opposite is the case for hours worked.
To-gether, these observations suggest that deunionization and increased incidence of performance-pay result in greater wage flexibility, making wages more and hours
(and output) less responsive to business cycle shocks.
Simulations with the DSGE model illustrate that while reasonable changes in the
(absolu te and relative) importance of exogenous shock pro cesses can have a siz
-able effect on the absolute volatility and cyclicality of wages, their effect on the relative volatility of wages is small. By contrast, a decrease the proportion of unionized workers and an increase the incidence of performance-pay contracts as observed in U.S. data leads to greater wage flexibility in equilibrium, accounting
for a substantial fraction of the observed increase in relative wage volatility while
simultaneously decreasing the magnitude of business cycle fluctuations. This sug-gests that deunionization and a shift towards performance-pay contracts are at least partially responsible for the observed changes in wage volatility and the Great Moderation.2
The paper contributes to a recent literature on changes in U.S. labor market dynamics. Most notably, Gali and Gambetti (2009) and Stiroh (2009) document that the Great Moderation period is characterized by an increase in the relative volatility of hours worked and a fall in the correlation of labor productivity with output and hours. Gali and Van Rens (2010) argue that a decrease in labor hoarding due to decreased hiring costs accounts for both of these changes in labor market dynamics.3 Gali and Van Rens (2010) also note the increase in relative wage volatility and show that under certain assumptions about wage setting, a decrease in hiring costs increases wage flexibility.4 Alternatively, Nucci and Riggi (2011) argue that an increase in the sensitivity of the effort component of wages to current economie conditions, interpreted as a shift towards performance-pay, is capable of accounting for the empirical evidence in Gali and Gambetti (2009). Compared to these studies, the present paper focuses more squarely on wage volatility. In particular, the paper first documents that the increase in relative wage volatility is not due to compositional changes but generalized across the workforce. This result is important because it directs the search for possible explanations towards structural changes that have a similar impact on all workers. Furthermore, the proposed DSGE model explicitly distinguishes between union and non-union workers that either receive performance-pay or not. While the model does not propose a new theory of the equilibrium existence of unions and
shocks such as the ones experienced during the recent financial crisis. The simulation results suggest, however, that the effects of these large shocks would have been even more severe if wage setting had been as rigid as in the early 1980s.
3In relatee! work, Barnichon (2010) documents that the correlation of labor productivity with unemployment has switched from mildly negative to significantly positive. He proposes a combination of changes in the relative importance of business cycle shocks and lower labor search frictions as an explanation.
4To our knowledge, the increase in relative wage volatility was first observee! in
8
performance-pay contracts, it can be calibrated with actual data on unionization
and performance-pa y to provide a quantitative assessment of the effects of these
two structural changes for U.S. labor market dynamics.5
The rest of the paper proceeds as follows. Section 2 documents the increase in
volatility of different aggregate hourly wage measures. Section 3 presents changes
in relative wage volatility across different worker decompositions and implements the volatility accounting exercise. Section 4 describes the DSGE model and s im-ulates the effects of deunionization and increased incidence of performance-pay.
Section 5 concludes.
1.2
Hourl
y
w
ages
durin
g
th
e
Gr
ea
t M
o
d
e
r
at
i
o
n
This section documents the increase in volatility of average real hourly wages in
the United States. First, the construction of the preferred measure of hourly wages
is described and the main results are presented. Then, robustness with respect to alternative measures of hourly wages is discussed. For the sake of brevity, the description of the data is kept to a minimum, with an extensive on-line appendix providing more detailed information.
1.2.1
D
a
t
a
The most comprehensive measure of average hourly wages in the non-farm business
sector cornes from the Bureau of Labor Statistics' (BLS) Labor Productivity and
5 A number of other recent papers conjecture that different structural changes in the U.S. labor market have led to greater wage fiexibility. Prominent examples are Blanchard and Gali (2007); Davis and Kahn (2008); and Lemieux et al. (2009a,b). Davis and Kahn (2008) conclude that greater wage fiexibility "· .. off ers a unified exp la nation for the rise in wage and earnings inequality, fiat or rising volatility in household consumption, a decline in the job-loss rate, and declines in firm-level and aggregate volatility measures." However, none of these papers proposes a mode! that would permit an explicit quantitative assessment.
Costs (LPC) program.6 The measure is computed as total compensation divided by a corresponding series of total hours worked and is available quarterly starting in 1948. Total compensation is comprised of wage and salary disbursements (i n-cluding executive compensation, commissions, tips and bonuses) plus supplements such as vacation pay or employer contributions to pension and health plans. The wage and salary portion of total compensation is based on the Quarterly Census of Employment and Wages (QCEW), a mandatory employer-based program for all employees covered by unemployment insurance (UI) that spans about 98%
of U.S. establishments and jobs. The supplements portion, in turn, is compiled from different sources by the Bureau of Economie Analysis (BEA). To obtain real hourly wages, the LPC measure is defiated by the Personal Consumption Expen -diture (PCE) index from the National Income and Products Accounts (NIPA). All results are robust to the use of other defiators. The resulting series is com -pared to the non-farm business real chain-weighted GDP per capita, which is also computed from the NIPA tables. All series are logged and filtered to extract the
business cycle component. Three filtering methods are considered: (i) quarterly first-difference filtering; (ii) Hodrick-Prescott (HP) filtering; and (iii) Bandpass Filtering (BP) as proposed by Christiano and Fitzgerald (2003).
1.2.2
Main resul ts
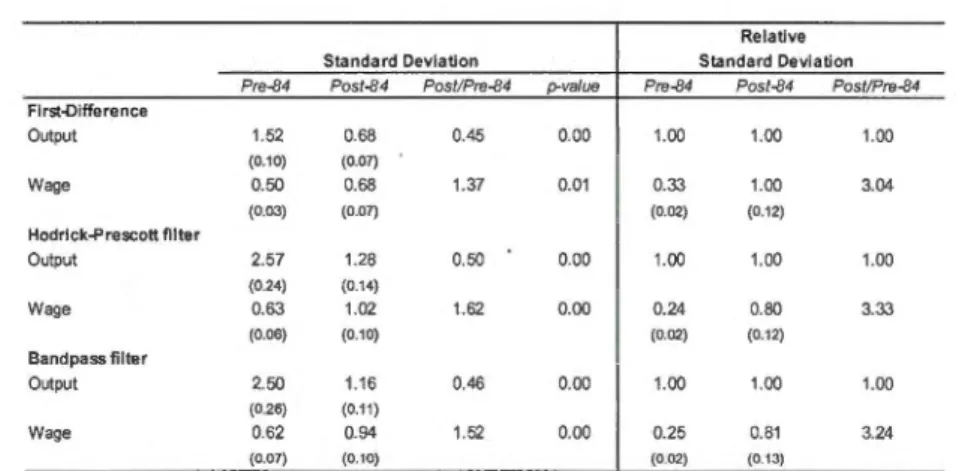
Table 1.1 shows the standard deviation of output and real hourly wages for the periods 1953:2-1983:4 and 1984:1-2006:4, with standard errors for each estimate provided in brackets. 7 The sample split is motivated by the Great Moderation
1iterature that estima tes a break in output volatility in 1984 ( e.g. McConnell and Perez-Quiros, 2000). While output volatility decreases by about 50% over the
6The analysis is confined to the non-farm business sector because it is unclear how to interpret public-sector wages in a market-based economy such as the one presented in Section
Relative
Standard Deviation Standard Deviation
Pre-84 Post-84 Post/Pre-84 ,:rvalue Pre-84 Post-84 Post/Pre-84
Flrst-Difference Output 1.52 0.68 0.45 0.00 1.00 1.00 1.00 (0.10) (0.07) Wage 0.50 0.68 1.37 0.01 0.33 1.00 3.04 (0.03) (0.07) (0.02) (0.12) Hodrick-Prescott filter Output 2.57 1.28 0.50 0.00 1.00 1.00 1.00 (0.24) (0.14) Wage 0.63 1.02 1.62 0.00 0.24 0.80 3.33 (0.06) (0.10) (0.02) (0.12) Bandpass fil ter Output 2.50 1.16 0.46 0.00 1.00 1.00 1.00 (0.26) (0.11) Wage 0.62 0.94 1.52 0.00 0.25 0.81 3.24 (0.07) (0.10) (0.02) (0.13)
Nole. Standard dev.atJOns (left panel} and standard dev.attons relatrve lo standard deviatiOn of output (nght panel) are reported for different f11tenng
methods. AU wage series are PCE-deflated. 'FbsUpre-84' colunn reports post-84 divided by pre-84 measure of volatil~y. Total sarrple ex tends from
1953:2 to 2006:4 w ~h split in 1984:1 using quarterty data for the non-farm business sector. P.. values are reportee! for a test of equality of variances
across the two subsatTples. Standard errors are COfll)Uted via the delta method from G~based estimates and appear in parenlheses below estirmtes.
Table 1.1 Changes in volatility
10
two periods (i.e. the Great Moderation), the volatility of hourly wages increases by 40% to 60% depending on the filtering method. According to the p-value of Levene's (1960) test of equal variance, this increase is highly significant. As the last column of Table 1 shows, the volatility of hourly wages relative to the volatility of output therefore increases more than three-fold over the two periods.
Figure 1.1 illustrates this result by plotting the volatility of output and hourly wages over 8-year rolling windows.As the first panel shows, the volatility of output falls precipitously in the 1980s whereas the volatility of hourly wages increases during the 1980s and 1990s. As shown in the second panel, the relative volatility of hourly wages thus increases dramatically from the mid-1980s to the mid-1990s. Thereafter, the relative volatility of hourly wages returns to an intermediate level
4. Results would be very similar for economy-wide hourly wages, however.
7The sample starts in 1953:2 to avoid the extreme swings in inflation during the Korean
War. Starting the sample in 1948 does not change any of the results. Standard errors are computed via the delta method from GVIM-based estimates. See the appendix for details.
Ou_,utand realwage volatility
~ 2 .. ··· ... .
~
l " ' " " ' " " ' ' " -... MOO< . .~:;~ll(to:f.~
...;;.:~Ei.~:~.\'i.;;ii\'-"'"'~:
....~
.... ., ...~~
\~;.:~:~;.~::
:;
~~::~.
·
.... ,.·::·;~~~
0~---~---~---~---~---~----~
1950 1960 1070 1980 1900 2000 2010
Reel wage re la ive to outputvolatillty
2 ~1.5 "' '
l
.
..
0f
-··
:
... -
··· ···~
1
~ Hl 50 1900 1970 1980 1990 2000 2010Top panel: std(y) and std(w); Lower panel: std(w)/std(y). Eight-year rolling
windows; quarterly, HP-filtered data.
Figure 1.1 Standard deviations of output and real hourly wages and relative
standard deviation
that remains, however, more than twice as high as the level before the mid-1980s.
The two graphs make clear that the increase in relative volatility of hourly wages is to a large part driven by the decline in output volatility.
1.2.3
Evid
e
nce from
a
lt
e
rn
a
tiv
e
h
o
url
y
w
age
m
eas
ur
es
The hourly wage from the LPC is based on a very broad measure of compensa-tion that includes employer contributions to pension and health plans and gains from exercising certain stock options. Both of these components have grown im-portantly over the past decades, raising the question of whether they drive the documented increase in wage volatility. The question is particularly relevant for stock options because they are likely to be exercised in upturns when their value is higher than their fair-market value at the time they were granted (i.e. the
1
2
time when they should have been recorded as compensation).8 A related but at the same time more general concern is that since the QCEW includes wages and salaries of the quasi-totality of employees, the increase in wage volatility may be due to the emergence of a small fraction of individuals with very large and variable earnings who account for an increasing share of totallabor income.9
To address the concern about contributions to pensions and health plans, we con-sider labor earnings data from the NIPA tables that only contains the 'wages and salary' portion from the QCEW. As results reported in the Appendix show, the
increase in hourly wage volatility computed from this wages and salary portion is even slightly larger than the one from the LPC that includes supplements. To address the concern about stock options and more generally the role of high-earning individuals, we construct an alternative hourly wage measure from the Current Population Survey (CPS). The CPS is the BLS' monthly household sur-vey and collects, among other information, data on labor earnings and hours worked. Labor earnings in the CPS has two advantages for our purpose. First, tips, commissions and bonuses are counted only if earned and paid in each period. The CPS therefore provides a more conservative source of earnings that ignores
irregular compensation, including deferred stock option disbursements. Second, the publicly available earnings data from the CPS is topcoded. Swings in earnings for individuals above the topcode therefore leave the average hourly wage unaf-fected.10 A disadvantage of the CPS is that hourly wages can be computed only
8Mehran and Tracy (2001) argue that the growth of stock options in the 1990s and their
inclusion in compensation at the time of exercise has biased the evolution of compensation up-wards. The au thors also conjecture that increased use of stock options may render compensation more variable.
9See Piketty and Saez (2003) on the important increase in labor income share of high
-earning individuals.
1°For hourly-paid workers, the CPS topcodes earnings at $99.99 per hour, a threshold rarely crossed. For salaried workers, the CPS topcodes weekly earnings at $999 until 1989;
from 1973 onwards with the introduction of the CPS May supplements, and this only at an annual frequency. Starting in 1979 then, hourly wage information is
available monthly from the Outgoing Rotation Groups (ORG) filesY Following Lemieux (2006) and others, an annual series of the average hourly wage
corn-bining the May supplements for 1973-1978 with annual averages of the monthly
ORG files for 1979-2006 is constructed. In order to obtain a non-farm business equivalent, all unemployed; self-employed; individuals under 16 years old; govern
-ment, agricultural and private household workers; and armed force personnel are
removed.12
The top panel of Table 1.2 presents the results for hourly wages from the CPS along with the annualized series for output and hourly wages from the LPC.13
$1923 between 1989 and 1997; and $2884 from 1998 onwards. For certain years, this puts
a substantial share of workers above the topcode. To reduce the risk of spurious volatility
induced by topcode adjustments, topcoded earnings are multiplied by a factor of 1.3. While
this correction is standard in the labor literature, we also experiment with alternative topcode adjustments and find al! results to be robust. See the appendix for details on these and other robustness checks int.ended to minimize spurious volatility in the post-1984 period.
11 An interviewed individual appears in the CPS for two periods of four consecutive
months, separated by eight months during which the individual is left out of the survey. Before
1979, the earnings questions were asked only once a year (the May supplements). Thereafter,
the earnings questions are asked each month to the individuals who are at the end of a four-month rotation (the ORGs). The March supplements of the CPS provides an alternative source of information about (annual) labor earnings. This data would have the advantage that it is available from 1963 onward. However, the March supplements only started to collect informa
-tion on total hours worked in 1976, which makes it impossible to compute hourly wages before that year. Furthermore, Lemieux (2006) argues that the annual earnings data of the March
supplements are subject to measurement errors not present for the weekly earnings data of the
CPS May /ORG files. See Lemieux' (2006) paper for a detailed discussion.
12For 1973-78, the sample from the May supplements averages 30406 observations per year. From 1979 onwards, the combination of 12 monthly ORG files averages 139230 observations
per year. Measurement error should therefore not be an issue. If at al!, measurement error is smaller in the,post-84 sample, which would lead to an understatement of the increase in wage volatility.
13 Ail series in Table 1.2 are HP filtered, with the constant set to 6.25 for annual data as recommended by Ravn and Uhlig (2002). Results are robust to alternative filters.
14
Both absolute and relative volatilities of the LPC measure mcrease m similar
Relative
Standard Deviation Standard Deviation
Pre-84 Post-84 Pos//Pre-84 p-value Pre-84 Post-84 Post/Pre-84
An nuai Ou put 2.90 1.15 0.40 0.00 1.00 1.00 1.00 (0.19) (0.13) LPC wage 0.60 0.93 1.55 0.14 0.21 0.80 3.89, (0.08) (009) (0.04) (0.13) CPS wage 0.63 0.72 1.14 0.57 0.22 0.62 2.86 (0.06) (0.12) (0.03) (0.15) Quarterly Output 2.73 1.28 0.47 0.00 1.00 1.00 1.00 (0.31) (0.14) LPC wage 0.65 1.02 1.58 0.00 0.24 0.80 3.38 (0.08) (0.10) (0.03) (0.12) CES wage (AHE) 1.11 0.45 0.41 0.00 0.41 0.36 0.87 (0.19) (0.05) (0.07) (0.07)
Note: Standard deviations (left panel) and standard dev1atbns relative ta standard deviatiOn of output (nght panel) are reported for 1-P-filtered data. Allw ages are FCE-deflated. 'R>sVpre-84' colurm reports post-84 divided by pre-84 measure of volaü1ity. Total sarrple ex tends from 1964
to 2006 for quarterty data and 1973 ta 2006 for annual data, both for the non-farm business sector. P-values are reported for a test of equality of variances across the two subsafll)les. Standard errors are corrputed via the delta method from Gf..!t.A.based estimates and appear in parentheses below estimates.
Table 1.2 Changes in volatility
proportions as in Table 1.1. Interestingly, for the pre-84 period, the absolute
volatility of the CPS measure is almost identical to the volatility of the LPC measure. For the post-84 period, the volatility of the CPS wage also increases but the increase is smaller and insignificant. This comparison suggests that higher wage volatility at the top end of the income distribution - possibly due to the
increased importance of irregular compensation, including deferred stock options disbursements - drives part of the increase in absolute volatility of the LPC wage. At the same time, the volatility of the CPS wage relative to the volatility of
output still displays an almost three-fold rise, confirming the main finding from above: while the volatility of output has decreased substantially during the Great Moderation, the volatility of the aggregate hourly wage has remained constant or even increased.
from the BLS' Current Establishment Survey (CES), which is available monthly and starts in 1964. The lower panel of Table 1.2 presents the results for AHE averaged to quarterly frequency along with the corresponding series for output and LPC hourly wages. The absolute and relative volatility of the LPC wage increase in similar proportions as before. By contrast, the absolute volatility of AHE is higher in the pre-84 period and then declines significantly in the post-84 period, so much that its volatility relative to the volatility of output becomes in fact smaller. This stark difference in hourly wage dynamics is not limited to the business cycle. As Abraham et al. (1998) document in earlier work, AHE also diverges greatly from other hourly wage measures in terms of its trend. For example, whereas the LPC hourly wage increases by about 7% between 1973 and 1993, AHE falls by about 10% over the same period. Given the frequent use of AHE in both academie research and the business press, it is important to investigate this striking difference and explain why the LPC and CPS measures
of hourly wages should be preferred.
Conceptually, differences between AHE and the LPC measure of hourly wages can come from either total compensation, total hours or both. Since total hours in the LPC are constructed primarily from CES hours (which underlies AHE), the business cycle components of total hours in the LPC and the CES are al-most identical (see appendix). Hence, the divergent business cycle dynamics of AHE and the LPC wage must be due to differences in total compensation. As described above, the LPC wage is mostly based on the QCEW, which is
manda-tory and covers 98% of all private-sector jobs. By contrast, AHE is constructed
from compensation of production and nonsupervisory workers as reported on a voluntary basis by establishments in the CES sample. AHE therefore covers only a subset of the workforce that, according to Abraham et al. (1998), represents
16
for a very strong argument in favor of the LPC.
Determining the exact reasons for the divergence of AHE is complicated by many
data issues and is therefore pursued in a separate paper (Champagne and
Kur-mann, 2012). In what follows, the main findings of this investigation are briefl.y summarized. First, to assess the role played by the lack of representativeness of AHE, Champagne and Kurmann (2012) follow Abraham et al. (1998) and use the occupational information provided in the CPS to recreate an hourly wage series for production and non-supervisory workers from the May/ORG dataset.l4
Abra-ham et al. (1998) show that this simulated AHE series accounts for about 60% of
the above mentioned decline in actual AHE between 1973 and 1993. Champagne
and Kurmann (2012) find that the same simulated AHE series almost exactly replicates the higher volatility of actual AHE in the pre-84 period and generates about 35% of the decline in volatility reported in Table 1.2. Renee, the lack of representativeness of AHE seems to play a substantial role for its divergence from other wage measures, not only in terms of trend but also in terms of volatility.
The second issue with AHE examined in Champagne and Kurmann (2013) con-cerns sampling problems. In particular, the CES sample underwent a substantial expansion from about 160,000 to 400,000 establishments between 1980 and 2006.
A large part of this expansion occurred for young and small establishments in se
r-vice industries, which were severely underrepresented in the 1970s and early 1980s
(see Plewes, 1982).15 The resulting improvement in the sample properties of the CES is likely to have led to spurious changes in AHE, both because measurement
HThe definition of compensation in the CES and the CPS is very similar. One difference is that CPS compensation includes tips. However, as Abraham et al. (1998) report, tips account for a mere 0.3% of total compensation in 1993.
15Employment numbers in the CES are benchmarked to the UI records, which are the
source of the QCEW. Earnings and hours are, however, not benchmarked and therefore do not undergo a regular bias correction.
errors for wages in service industries decreased substantially and because small and young firms in service industries hire on average less skilled workers for which
hourly wages have become less volatile (see Section 3). Together with the lack of representativeness of AHE, these sampling problems lead us to conclude that the LPC and CPS measures of hourly wages should be unambiguously preferred over AHE.16
1.2.4
Other
changes
in labor market
dynamics
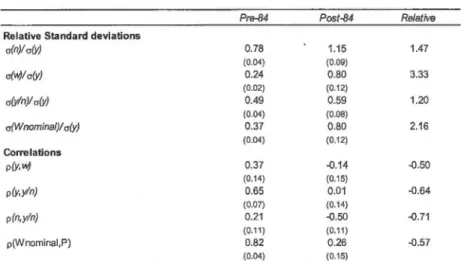
Table 1.3 reports changes in business cycle dynamics of other prominent labor market aggregates. The first four rows show relative volatilities for the pre-84 and
post-84 period. The relative volatility of both aggregate hours and labor pro-ductivity ( computed as output divided by total hours) in creas es, a result first uncovered by Gali and Gambetti (2009). Compared to the more than three-fold increase in the relative volatility of real hourly wages, these changes are, however,
modest. The relative volatility of nominal hourly wages also increases s
ubstan-tially but not by as much as the relative volatility of real hourly wages.
The last four rows of Table 1.3 report changes in different correlation coefficients. The correlation of labor productivity with both output and hours declines s
ub-stantially during the Great Moderation, a phenomenon documented by Gali and
Gambetti (2009) and Stiroh (2009). A similar decline in cyclicality also applies to real hourly wages. Finally, the correlation of nominal hourly wages with priees turns from strongly positive to almost zero. To our knowledge, this result is new
and provides an interesting perspective on the increase in volatility of real hourly wages. Since real hourly wages equal nominal hourly wages divided by the priee
16Moreover, as shown in the appendix, the increase in relative wage volatility is confirmed by two othcr hourly wage measures, one from the NBER manufacturing productivity database;
Pre-84 Post-84 Relative Relative Standard deviations
cr(n)lcr(Y) 0.78 1.15 1.47 (0.04) (0.09) cr(v.:)lcr(Y) 0.24 0.80 3.33 (0.02) (0.12) cr(yln)l cr(Y) 0.49 0.59 1.20 (0.04) (0.08) cr(Wnomina/)1 cr(Y) 0.37 0.80 2.16 (0.04) (0.12) Correlations p(y,w) 0.37 -0.14 -0.50 (0.14) (0.15) p(y,yln) 0.65 0.01 -0.64 (0.07) (0.14) p(n,y!n) 0.21 -0.50 -0.71 (0.11) (0.11) p(Wnominai,P) 0.82 0.26 -0.57 (0.04) (0.15)
Note: The four first rows report the standard deviations relative to standard deviation of output respectively for hours per
capita, real average hourly w age, output per hour, and norrinal average hourly w age. The next tvv o row s report the
correlations betw een output and respectively the real average hourty w age and output per hour. The last two rows report the correlation betw een hours and output per hour, and betw een the norrinal average hourly w age and the priee lev el. Ali series are HP..filtered, and real w ages are FC:E-deflated. 'Relative' colurm reports post-84 divided by pre-84 relative standard
deviations or the difference between post-84 and pre-84 for correlations. Total sarrple extends from 1953:2 to 2006:4 using quarterly data for the non-farm business sec tor. P-values are reported for a test of equality of variances ac ross the two
subsarrples. Standard errors are co/Tl)uted via the delta method from GI\ITv1-based estimates and appear in parentheses below estimates.
Table 1.3 Changes in labor market dynamics
18
level, changes in the volatility of real hourly wages can be decomposed into changes
in the volatility of nominal hourly wages; changes in the volatility of the priee level; and changes in (the negative of) the correlation between the two variables.17 The (absolute) volatility of nominal hourly wages has remained roughly constant and the volatility of the priee level has fallen substantially. Renee, the increase in the (absolu te) volatility of real hourly wages is to a large part accounted for by the drop in correlation between nominal hourly wages and the priee level.
17The variance of the business cycle component of log real hourly wages is approximately var(w):::::; var(wnom)
+
var(p) -2corr(w"0m,p) x J var(wnom)var(p)1.
3
A dos
e
r l
oo
k
at d
i
s
agg
r
e
g
a
t
e
d d
a
ta
The documented increase in the relative volatility of hourly wages raises two im-portant questions. First, did this increase occur across different groups of workers? Second, what is the role played by changes in workforce composition? The answers to these questions provide valuable elues in the search for possible explanations.
If, for example, the relative volatility of hourly wages increases in similar pro-portions for many groups of workers, then this directs us towards changes in the economie environment that affect different labor markets alike. If, to the contrary, the relative volatility of hourly wages remains approximately constant for most groups of workers, then the focus turns to other explanations such as the role played by changes in workforce composition towards jobs with historically more volatile wages.
1.
3.1
W
age
vo
l
a
t
ili
ty
ac
r
o
s
s
d
i
ff
e
r
e
nt d
ec
omp
os
iti
o
n
s
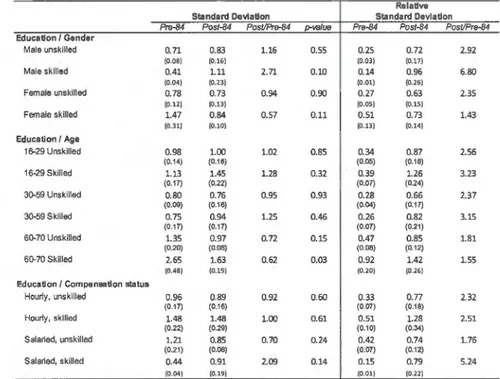
Information in the CPS May/ORG dataset can be used to decompose the work-force into groups with different characteristics. Following Krusell et al. (2000), we choose education as one of the characteristics, with a 'skilled worker' being someone with a college degree (bachelor) or more, and an 'unskilled worker' being someone with less than a college degree. On top of education, we distinguish in rotating order by gender, age, compensation status (hourly paid or salaried), and industry affiliation. This yields four different decompositions: (i) gender
j educa
-tion; (ii) age j education; (iii) compensation status / education; and (iv) industry affiliation
j
education.18 For each decomposition, we compute the average hourlywage; filter the series to extract the business cycle component; and compute the
18The appendix reports an additional decomposition with respect to gender and