adrenergic neuroblastoma core regulatory circuitry
The MIT Faculty has made this article openly available.
Please share
how this access benefits you. Your story matters.
Citation
Wang, Lu et al. "ASCL1 is a MYCN- and LMO1-dependent member
of the adrenergic neuroblastoma core regulatory circuitry." Nature
communications 10 (2019): 1039 © 2019 The Author(s)
As Published
10.1038/s41467-019-13515-5
Publisher
Springer Science and Business Media LLC
Version
Final published version
Citable link
https://hdl.handle.net/1721.1/124654
Terms of Use
Creative Commons Attribution 4.0 International license
ASCL1 is a MYCN- and LMO1-dependent member
of the adrenergic neuroblastoma core regulatory
circuitry
Lu Wang
1,2, Tze King Tan
1, Adam D. Durbin
3,4,5, Mark W. Zimmerman
3, Brian J. Abraham
6,7,
Shi Hao Tan
1, Phuong Cao Thi Ngoc
1, Nina Weichert-Leahey
3,4, Koshi Akahane
3,8, Lee N. Lawton
6,
Jo Lynne Rokita
9,10, John M. Maris
9,11, Richard A. Young
6,12, A. Thomas Look
3,4* & Takaomi Sanda
1,2*
A heritable polymorphism within regulatory sequences of theLMO1 gene is associated with
its elevated expression and increased susceptibility to develop neuroblastoma, but the oncogenic pathways downstream of the LMO1 transcriptional co-regulatory protein are unknown. Our ChIP-seq and RNA-seq analyses reveal that a key gene directly regulated by
LMO1 and MYCN is ASCL1, which encodes a basic helix-loop-helix transcription factor.
Regulatory elements controlling ASCL1 expression are bound by LMO1, MYCN and the
transcription factors GATA3, HAND2, PHOX2B, TBX2 and ISL1—all members of the
adre-nergic (ADRN) neuroblastoma core regulatory circuitry (CRC). ASCL1 is required for
neu-roblastoma cell growth and arrest of differentiation. ASCL1 and LMO1 directly regulate the
expression of CRC genes, indicating thatASCL1 is a member and LMO1 is a coregulator of the
ADRN neuroblastoma CRC.
https://doi.org/10.1038/s41467-019-13515-5 OPEN
1Cancer Science Institute of Singapore, National University of Singapore, Singapore 117599, Singapore.2Department of Medicine, Yong Loo Lin School of
Medicine, National University of Singapore, Singapore 117599, Singapore.3Department of Pediatric Oncology, Dana-Farber Cancer Institute, Harvard Medical School, Boston, MA 02216, USA.4Division of Pediatric Hematology/Oncology, Boston Children’s Hospital, Boston, MA 02215, USA.5The Broad Institute of MIT and Harvard, Cambridge, MA 02142, USA.6Whitehead Institute for Biomedical Research, Cambridge, MA 02142, USA.7Department of Computational Biology, St. Jude Children’s Research Hospital, Memphis, TN 38102, USA.8Department of Pediatrics, School of Medicine, University of Yamanashi, Chuo
4093898, Japan.9Oncology Division, Children’s Hospital of Philadelphia, Philadelphia, PA 19104, USA.10Department of Bioinformatics and Health
Informatics, Children’s Hospital of Philadelphia, Philadelphia, PA 19104, USA.11Department of Pediatrics, University of Pennsylvania, Philadelphia, PA 19104,
USA.12Biology Department, MIT, Cambridge, MA 02142, USA. *email:thomas_look@dfci.harvard.edu;takaomi_sanda@nus.edu.sg
123456789
N
euroblastoma is an embryonal tumor of the peripheral sympathetic nervous system, accounting for 7.5% of allcancer diagnoses in children1–3. The majority of children
with neuroblastoma have highly invasive tumors, which are often metastatic at diagnosis. The outcome for high-risk neuroblastoma
cases is very poor, with long-term survival less than 50%3,4.
Neuroblastoma can be classified into two subtypes based on gene expression and enhancer profiles, one with a committed adre-nergic (ADRN) signature and the other with mesenchymal,
migratory neural crest properties (MES)5. Genome-wide studies
revealed several recurrent molecular abnormalities in primary neuroblastoma cases, including genetic amplification of MYCN
and mutations of ALK, ATRX, and PTPN116. MYCN
amplifica-tion has been used as a risk factor that is associated with a poor
prognosis3,4,7. In addition, our recent studies have implicated
LMO1 as a major predisposition gene that functions as an
oncogene in neuroblastoma8–10.
LMO proteins (LMO1–4) are LIM-domain-containing
tran-scriptional co-regulatory factors that lack DNA-binding
domains11–13. LMO proteins function as adapters to form
com-plexes between DNA-binding proteins such as the class I basic helix-loop-helix (bHLH) proteins, class II bHLH proteins, LDB1
and GATA proteins12,14. LMO2 is an oncogene that is
over-expressed in T-cell acute lymphoblastic leukemia (T-ALL) due to chromosomal translocation into the vicinity of the T-cell receptor
locus12,14. Point mutations in the noncoding elements that
gen-erate an enhancer driving overexpression of LMO2 have also been
reported15. LMO1, another member of the LMO family, is also
frequently overexpressed in T-ALL due to chromosomal
trans-location or mutations in the enhancer12,14. LMO3 is
over-expressed in some T-ALL cases due to enhancer hijacking
mediated by chromosomal translocation16. LMO1, LMO2, and
LMO3 are considered to be functionally redundant oncogenes in
T-ALL17.
In childhood neuroblastoma, our previous genome-wide association study (GWAS) has shown that polymorphisms at the LMO1 gene locus are strongly associated with susceptibility to
tumor formation8. Germline single nucleotide polymorphism
(SNP) risk alleles are associated with increased LMO1 expression in neuroblastoma cell lines and primary tumors. Genetic knockdown of LMO1 inhibits the growth of neuroblastoma cells, whereas overexpression of LMO1 enhances proliferation in cells
with low LMO1 expression8. The risk allele of SNP rs2168101
G>T, which is the most highly associated variant, creates a GATA
motif, and GATA3 binds at this locus9. This GATA3 binding is
essential for the creation of a super-enhancer that drives high levels of LMO1 expression and increases the proliferative fraction
of sympathetic neuroblasts9. Subsequent studies showed that
LMO1 overexpression significantly accelerates the latency, pene-trance, and metastatic potential of MYCN-induced
neuro-blastomas in a zebrafish transgenic model10. These findings
implicate LMO1 as an oncogene that collaborates with MYCN in neuroblastoma pathogenesis, causing arrest of neuroblast differ-entiation into chromaffin cells or sympathetic ganglia within the adrenal medulla, and also driving rapid neuroblast
prolifera-tion10. However, molecular mechanisms by which LMO1 alters
transcription to drive cellular proliferation and differentiation block remain to be identified.
Recent work has suggested that a small set of transcription factors cooperate to dominate regulation of the expression pro-gram of a given cell identity through binding the majority of
expressed genes/enhancers18. These factors form the core
reg-ulatory circuitry (CRC), which consists an interconnected auto-regulatory loop whereby their expression is driven by themselves
and other members of the CRC5,19–21. CRC members can be
identified as those that are associated with top ranked regulatory
elements by active histone marks such as Histone H3 lysine-27
acetylation (H3K27ac) signals18. As one offirst examples, we have
demonstrated that TAL1, GATA3, RUNX1, and MYB form the
CRC in T-ALL cells22,23. In the ADRN subtype neuroblastoma,
PHOX2B, HAND2, TBX2, ISL1, and GATA3 have been
impli-cated as CRC members5,19–21. Meanwhile, MYCN serves as an
additional amplifier of the CRC24. However, the involvement of
LMO1 in the neuroblastoma CRC has not been elucidated yet. Here, we identify the transcriptional signature driven by LMO1 in combination with MYCN in neuroblastoma cells. LMO1 reg-ulates genes in a tissue-specific manner and co-binds to the enhancers of genes regulated by the CRC transcription factors that underlie cell state in ADRN neuroblastoma. Intriguingly, LMO1 and the CRC members bind to enhancer elements and directly upregulate the ASCL1 gene, resulting in promotion of cell growth and repression of neuronal differentiation.
Results
LMO1 regulates gene expression in a tumor-specific manner.
To begin to understand the role of LMO1-mediated
transcrip-tional regulation, wefirst designed short-hairpin RNAs (shRNAs)
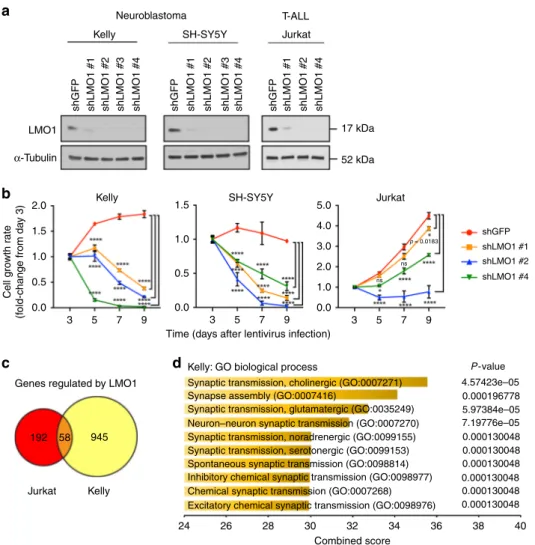
to specifically knock down the expression of LMO1 (Fig.1a and
Supplementary Fig. 1a). We chose two representative neuro-blastoma cell lines (Kelly and SH-SY5Y), both of which express
high levels of LMO1 protein and harbor permissive SNP alleles8,9.
To compare gene expression profiles of LMO1-associated malignancies, we included the T-ALL cell line Jurkat, in which LMO1 is overexpressed due to a somatically acquired point mutation in the enhancer and participates with TAL1 to promote
an oncogenic transcriptional regulatory program22. In this
set-ting, knockdown of LMO1 significantly reduced cell growth in all
three cell lines examined (Fig. 1b), supporting earlierfindings8.
LMO1 expression level was positively associated with the cellular growth rate, in which LMO1 shRNA #2 showed the greatest
reduction of LMO1 expression levels (Fig.1a) and the strongest
inhibition of cell growth (Fig.1b). The growth of neuroblastoma
cell lines was more strongly inhibited by LMO1 knockdown than that of T-ALL cells, indicating that neuroblastoma cells are highly dependent on LMO1 expression for cell growth and survival.
To analyze LMO1-regulated genes and pathways, we then performed RNA-sequencing (RNA-seq) analysis after knockdown
of LMO1 in Kelly and Jurkat cells using the shLMO1 #2. Wefirst
selected genes that were significantly downregulated or upregu-lated after LMO1 knockdown compared with control samples (Supplementary Data 1). This analysis demonstrated that differentially expressed genes had limited overlap between Kelly
and Jurkat cells (Fig. 1c). This is not surprising because LMO1
does not bind directly to promoter-enhancer DNAs but rather
serves as a transcriptional adapter13,25–28. Thus, target loci of
LMO1 depend on its binding to transcription factor partners that are expressed in a tissue-specific manner. Indeed, gene ontology (GO) analysis revealed that genes downregulated by LMO1 knockdown in Kelly cells were enriched in the GO biological
processes associated with synaptic transmission (Fig. 1d), while
none of these biological processes were enriched in the analysis of Jurkat cells (Supplementary Fig. 1b). In contrast, different GO biological processes such as positive regulation of cell prolifera-tion were enriched in genes differentially expressed in Jurkat cells (Supplementary Fig. 1b). These results indicate that LMO1 regulates different sets of genes in neuroblastoma and T-ALL cells.
LMO1 co-occupies targets with the members of the ADRN CRC. Since LMO1 is known to bind to transcription factors as an adapter to elicit oncogenic effects, we next examined the
genome-wide occupancy of LMO1 by chromatin immunoprecipitation sequencing (ChIP-seq) analysis in Kelly and Jurkat cells. Since a relatively high level of background signal was observed with the LMO1 antibody, we combined the results from two independent ChIP-seq experiments (Supplementary Fig. 2a). Analysis of the top DNA-binding motifs enriched at the apex of the LMO1-binding peaks indicated that these regions typically contained GATA binding motifs (Supplementary Fig. 2b). Using a co-immunoprecipitation approach, we demonstrated that FLAG-tagged LMO1 could interact with both GATA3 and LDB1 pro-teins when overexpressed in 293T cells (Supplementary Fig. 2c). Consistently, FLAG-tagged LMO1 could interact with endogen-ous GATA3 and LDB1 proteins when overexpressed in Kelly neuroblastoma cells (Supplementary Fig. 2d). This is analogous to the mechanism in T-ALL, in which LMO1 or LMO2 binds to
GATA3 and LDB125. Because GATA3 is a known member of the
CRC that underlies cell state in both T-ALL and neuroblastoma,
and is required for cell growth in both tumor types19,22, we next
analyzed the co-occupancy of LMO1 with GATA3 by ChIP-seq.
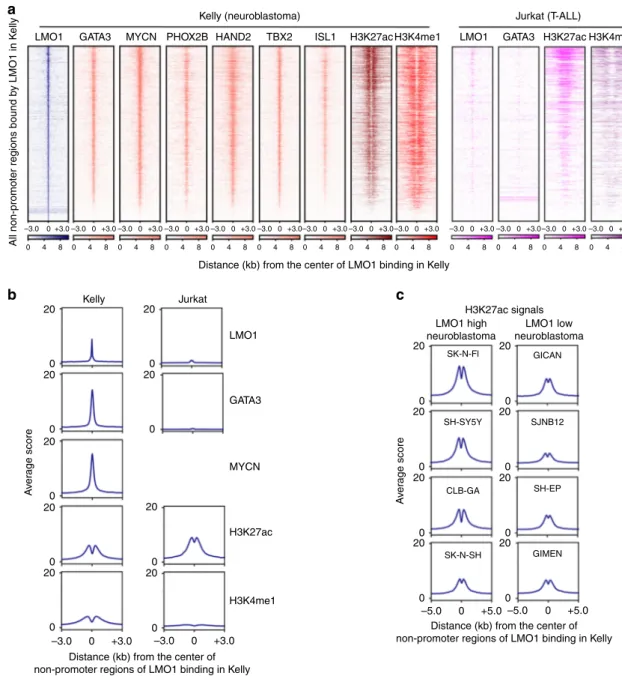
Wefirst selected all nonpromoter regions bound by LMO1 in
Kelly cells and then analyzed the occupancy of GATA3 at the same regions. We also compared the result with DNA occupancy of MYCN, which is a collaborating oncogenic transcription factor
of LMO110,19. Strikingly, we observed a remarkable concordance
of DNA occupancy by LMO1, GATA3, and MYCN proteins in
Kelly cells (Fig. 2a, left; Fig. 2b, left). In addition, LMO1
occupancy was associated with enrichment of transcription factors that have previously been shown as members of the ADRN neuroblastoma CRC, including PHOX2B, HAND2, TBX2,
and ISL15,19–21(Fig. 2a, left). This result suggested that LMO1
collaborates with these factors to co-occupy the regulatory region of the same target genes. However, there was very little overlap in
5.0 4.0 3.0 Jurkat Jurkat shGFP shLMO1 #1 shLMO1 #2 shLMO1 #4
shGFP shLMO1 #1 shLMO1 #2 shLMO1 #4 shGFP shLMO1 #1 shLMO1 #2 shLMO1 #3 shLMO1 #4
shGFP shLMO1 #1 shLMO1 #2 shLMO1 #3 shLMO1 #4
52 kDa α-Tubulin LMO1 17 kDa T-ALL SH-SY5Y Kelly Kelly 24 26 28 30 32 Combined score 34 36 38 40 4.57423e–05 Synaptic transmission, cholinergic (GO:0007271)
Synapse assembly (GO:0007416)
Synaptic transmission, glutamatergic (GO:0035249) Neuron–neuron synaptic transmission (GO:0007270) Synaptic transmission, noradrenergic (GO:0099155) Synaptic transmission, serotonergic (GO:0099153) Spontaneous synaptic transmission (GO:0098814) Inhibitory chemical synaptic transmission (GO:0098977) Chemical synaptic transmission (GO:0007268) Excitatory chemical synaptic transmission (GO:0098976)
P -value 0.000196778 5.97384e–05 7.19776e–05 0.000130048 0.000130048 0.000130048 0.000130048 0.000130048 0.000130048 Kelly a Cell g ro wth r a te (f old-change from da y 3) p = 0.0183 ns ns 3 5 7 9 3 5 7
Time (days after lentivirus infection) 9
3 5 7 9
Genes regulated by LMO1
Kelly: GO biological process
945 58 192 2.0 1.0 0.0 2.0 1.5 1.0 0.5 0.0 1.0 1.5 0.5 0.0 Jurkat SH-SY5Y Neuroblastoma b c d
Fig. 1 LMO1 regulates gene expressions in a tumor-specific manner. a Four independent shRNAs targeting LMO1 (shLMO1 #1, 2, 3, and 4) as well as a control shRNA targetingGFP (shGFP) were transduced by lentivirus infection in two neuroblastoma cell lines (Kelly and SH-SY5Y) and one T-ALL cell line (Jurkat). Whole cell protein extract was harvested after 3 days of virus infection and were subjected to western blot analysis using antibodies specific for LMO1 orα-tubulin (internal control). b Cell viability was measured after 3, 5, 7, and 9 days of lentiviral transduction of shRNA. The growth rate (fold-change) over 9 days compared with day 3 was indicated (n = 3 per group). Data are represented as means ± standard deviation (SD) for technical triplicates. Thep values by two-way ANOVA (repeated measurements) followed by Tukey's multiple comparisons post hoc test are indicated. ****p value < 0.0001. ns not significant. c The shRNA targeting LMO1 or control (shGFP) was transduced into Kelly and Jurkat cells by lentiviral infection. Experiments were done in biological duplicates. Total RNAs were harvested after 3 days of infection and were subjected to RNA-seq analysis to compare gene expression profiles between two controls and two LMO1 knockdown (KD) samples. Genes differentially expressed were selected based on the following criteria: adjustedp value < 0.05, log2 fold-change <−0.5 or >0.5, and TPM > 3. A Venn diagram represents the number of genes which were significantly downregulated byLMO1 knockdown in each cell line. d Gene ontology analysis was performed using the gene list selected above. Top ten terms are shown with combined score. Thep values by the Fisher exact test are indicated.
these LMO1-bound regions between Kelly neuroblastoma and
Jurkat T-ALL cells (Fig.2a, right; Fig.2b, right; and
Supplemen-tary Fig. 2e), indicating that LMO1 and GATA3 bind different lineage-specific enhancers.
We next analyzed the chromatin status at LMO1 target loci in neuroblastoma cells and found that LMO1-enriched regions were frequently associated with active histone marks (H3K27ac and
H3K4me1) in Kelly cells (Fig.2a, b). We also compared H3K27ac
signals at regions bound by LMO1 in Kelly cells across a panel of neuroblastoma cell lines without MYCN amplification that
expressed different levels of LMO1 (Fig. 2c and Supplementary
Fig. 2f). This analysis revealed that cell lines that expressed high levels of LMO1 exhibited higher levels of H3K27ac signal at LMO1-bound regions, suggesting that these cell lines have a more similar cell identity to Kelly cells, as compared with the cell lines
which express low levels of LMO1. These results indicated that LMO1 associates with distinct genomic regions in neuroblastoma and T-ALL cells, which primarily coincide with chromatin marks of activated gene expression.
ASCL1 is a downstream target gene regulated by LMO1 and MYCN. We next sought to identify the individual target genes directly regulated by LMO1 in neuroblastoma cells. By integrating the results of ChIP-seq and RNA-seq analyses in Kelly cells, we predicted genes that were likely direct targets of LMO1 in which they show significant downregulation by RNA-seq after knock-down of LMO1 and were also associated with binding sites for LMO1 and GATA3 proteins with an active histone mark (H3K27ac) by ChIP-seq (Supplementary Data 2). To confirm
20 0 20 0 A v er age score A v er age score
All non-promoter regions bound b
y LMO1 in K e lly 20 0 20 0 20 0 20 0 20 0 20 0 20 0 20 0 20 –3.0 0 4 8 0 4 8 0 4 8 0 4 8 0 4 8 0 4 8 0 4 8 0 4 8 0 4 8 0 4 8 0 4 8 0 4 8 0 4 8 0 +3.0 –3.0 0 +3.0 –3.0 0 +3.0 –3.0 0 +3.0 –3.0 0 +3.0 –3.0 0 +3.0–3.0 0 +3.0 –3.0 0 +3.0–3.0 0 +3.0 –3.0 0 +3.0 –3.0 0 +3.0–3.0 0 +3.0 –3.0 0 +3.0 Jurkat LMO1 a
GATA3 MYCN LMO1 GATA3 H3K27ac
Jurkat (T-ALL)
PHOX2B HAND2 TBX2
Kelly (neuroblastoma)
ISL1 H3K27ac H3K4me1 H3K4me1
Distance (kb) from the center of LMO1 binding in Kelly
LMO1 GATA3 MYCN H3K27ac H3K4me1 Kelly 0 20 0 20 0 –5.0 0 +5.0 –3.0 0 +3.0 –3.0 0 +3.0 –5.0 Distance (kb) from the center of non-promoter regions of LMO1 binding in Kelly Distance (kb) from the center of
non-promoter regions of LMO1 binding in Kelly
+5.0 0 20 GICAN SJNB12 SH-EP GIMEN SK-N-SH SK-N-Fl SH-SY5Y CLB-GA LMO1 high neuroblastoma H3K27ac signals LMO1 low neuroblastoma 0 20 0 20 0 20 0 b c
Fig. 2 LMO1 co-occupies targets with the members of the ADRN CRC. a The LMO1-bound nonpromoter loci werefirst identified in Kelly cells. Density plots show the distribution of LMO1, GATA3, MYCN, PHOX2B, HAND2, TBX2 and ISL1, H3K27ac and H3K4me1 signals at the LMO1-bound regions (±3 kb from binding sites) in Kelly and LMO1, GATA3, H3K27ac and H3K4me1 signals at the same regions in Jurkat cells. The color scale shows the intensity of the distribution signal.b Metagene plots show distribution of LMO1, GATA3, MYCN, H3K27ac, and H3K4me1 signals at the LMO1-bound regions (±3 kb from binding sites) in Kelly and Jurkat cells.c Metagene plots show distribution of H3K27ac signals at the LMO1-bound regions (±5 kb from binding sites) in various neuroblastoma cell lines. Cell lines were classified based on the expression level of LMO1 mRNA.
whether the expression of LMO1-bound genes was regulated by LMO1 in other cell line, we also performed gene expression profiling in SH-SY5Y cells by microarray after knockdown of LMO1 using shLMO1#2. The gene set enrichment analysis (GSEA) demonstrated that many predicted LMO1 targets that were downregulated or upregulated by LMO1 knockdown in Kelly cells were also downregulated or upregulated by LMO1 knockdown in SH-SY5Y cells (Supplementary Fig. 3a, b). This result showed a high level of correlation in gene expression changes between two cell lines.
Next, to identify genes most strongly dependent on MYCN for their expression among all direct targets of LMO1, we performed RNA-seq after MYCN knockdown (Supplementary Fig. 3c, d) and predicted genes that were directly regulated by MYCN in Kelly cells using the same criteria as for LMO1 predicted targets
(Supplementary Data 2). By combining thesefilters, we derived a
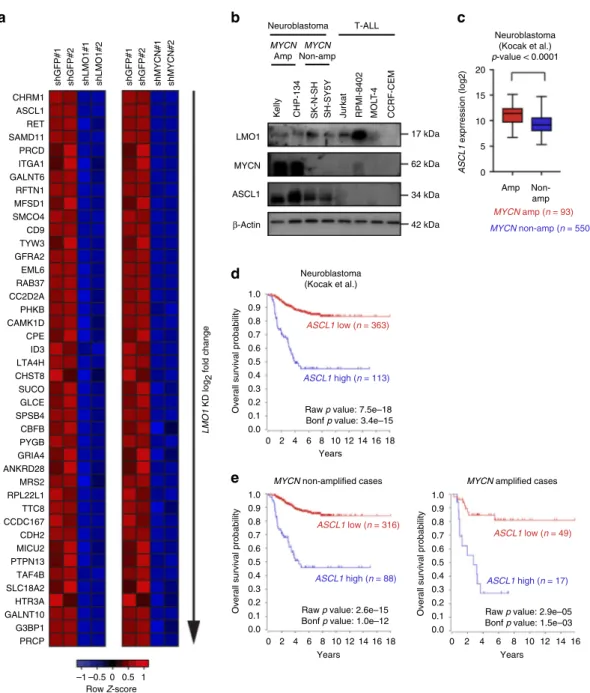
short list of genes (n= 42), which are displayed rank-ordered by
fold-change after LMO1 knockdown as an expression heatmap in
Fig. 3a. Interestingly, the transcription factor gene with the
highest fold-change in response to both MYCN and LMO1
depletion was ASCL1 (Fig. 3a). ASCL1 encodes a bHLH
transcription factor that has previously been implicated in
neuronal cell development and neuroblastoma pathogenesis28,29.
ASCL1 expression is more highly expressed in neuroblastoma and small cell lung cancer cell lines than other cancer types in the CCLE database (Supplementary Fig. 3e). In our recent CRISPR/ Cas9 screen, the ASCL1 gene also showed selective dependency in
neuroblastoma cell lines19. This gene was also significantly
downregulated by LMO1 knockdown in SH-SY5Y cells
(Supple-mentary Fig. 3f). In support of thesefindings, neuroblastoma cell
lines displayed high level expression of ASCL1 together with LMO1 by western blot analysis; however, ASCL1 was not
expressed by any T-ALL cell lines examined (Fig. 3b). It is
noteworthy that ASCL1 protein expression was higher in the MYCN-amplified neuroblastoma cell lines, Kelly and CHP-134, than in the nonamplified cell lines, SK-N-SH and its subclone
SH-SY5Y (Fig. 3b), which overexpress MYC (c-MYC)30.
Con-sistently, analysis of primary neuroblastoma samples demon-strated that MYCN-amplified cases showed a higher level of
ASCL1 expression than nonamplified cases (Fig.3c). These results
indicated that ASCL1 is a high-confidence target gene down-stream of LMO1 and MYCN in neuroblastoma cells.
High ASCL1 expression is associated with inferior survival.
Notably, analysis using the R2 database indicated that high ASCL1 expression was significantly associated with inferior survival of
neuroblastoma patients in a cohort reported by Kocak et. al.31
(Fig.3d). Two other cohorts reported by Versteeg et al.32and the
Neuroblastoma Research Consortium (NRC) also showed the same trend (Supplementary Fig. 3g, h), although these datasets did not show high statistical significance due to the small size of samples in cases with high ASCL1 expression. Importantly, high ASCL1 expression was significantly associated with inferior
sur-vival even in the absence of MYCN amplification (Fig.3e). These
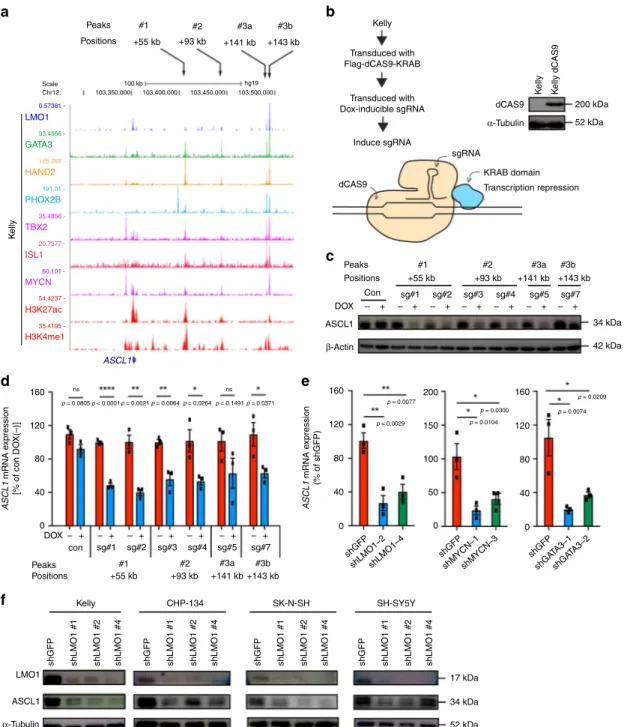
data implicate ASCL1 as a prognostic factor in neuroblastoma. LMO1, GATA3, and MYCN occupy the regulatory element of ASCL1. To verify that ASCL1 is directly regulated by LMO1, we analyzed the genomic loci bound by LMO1 in neuroblastoma cells. By ChIP-seq analysis, we observed four peaks of LMO1 (+55, +93, +141, and +143 kb) located 3′ to the ASCL1 gene and associated with H3K27ac and H3K4me1 signals in Kelly cells
(Fig.4a, bottom). Similar H3K27ac profiles were observed at the
same loci in multiple ADRN subtype neuroblastoma cell lines with high level of LMO1 expression but not in the MES subtype
neuroblastoma cell lines with low level of LMO1 expression or in the T-ALL Jurkat cell line (Supplementary Fig. 4a). Notably, only
the +141 and +143 kb elements (peak 3a and 3b) were
excep-tionally enriched in binding of bound by LMO1, GATA3, and
MYCN proteins (Fig. 4a, middle). The same loci were also
co-occupied by several other transcription factor proteins (HAND2, PHOX2B, TBX2, and ISL1) that represent CRC members of the
ADRN neuroblastoma5,19–21. We have confirmed the enrichment
of GATA3 protein at the same element by ChIP-PCR in Kelly and SH-SY5Y cells (Supplementary Fig. 4b).
To further clarify whether these regions serve as distal enhancers regulating ASCL1 expression, we engineered Kelly cells stably expressing the catalytically-dead Cas9 (dCas9) protein
fused to a transcriptional repressor peptide (KRAB) (Fig.4b). We
then transduced this clone with doxycycline (DOX)-inducible single guide RNAs (sgRNAs) targeting each of these peaks. This system permits guidance to blockage of specific genomic regions by dCas9 protein coupled with repression of transcription in
surrounding regions by the KRAB repressor activity. We first
confirmed that dCas9 protein bound to specific sites, directed by sgRNAs, by ChIP-qPCR (Supplementary Fig. 4c). In this setting, the blockage of each enhancer region resulted in the reduction of
ASCL1 expression at the protein (Fig. 4c) and mRNA levels
(Fig. 4d), indicating that each of these four enhancer regions
contributes to ASCL1 expression. Knockdown of LMO1, GATA3, and MYCN each separately downregulated the expression of
ASCL1 mRNA (Fig. 4e and Supplementary Fig. 4d).
Down-regulation of ASCL1 protein expression was observed in multiple LMO1-positive neuroblastoma cell lines after LMO1 knockdown
(Fig.4f). Conversely, overexpression of LMO1 upregulated ASCL1
expression (Supplementary Fig. 4e, f). Taken together, these results indicated that LMO1 positively regulates the expression of ASCL1 in concert with the CRC members GATA3 and MYCN.
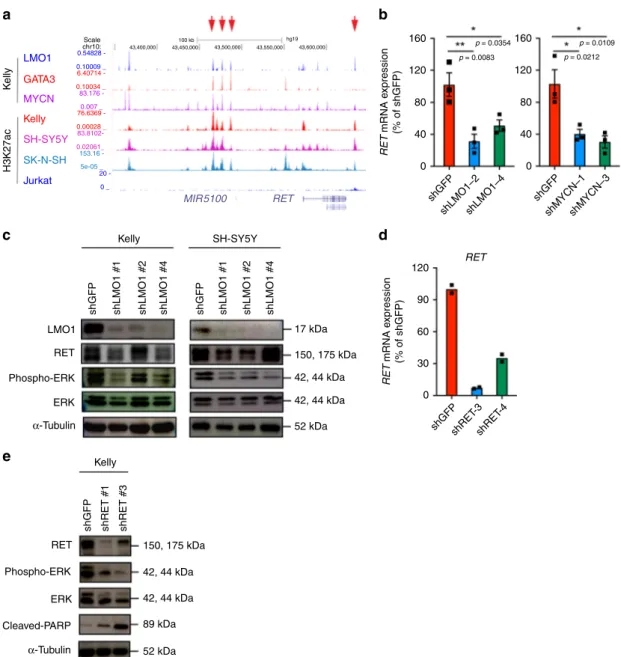
LMO1 and MYCN directly regulate the RET gene. Besides
ASCL1, we found that the receptor tyrosine kinase gene RET was positively regulated by LMO1 and MYCN in neuroblastoma cells
(Fig.3a). RET has been implicated in neuroblastoma and shown
to promote cell proliferation33,34. In our ChIP-seq analysis,
multiple binding events of LMO1, GATA3, and MYCN proteins
were observed upstream of the RET gene locus (Fig. 5a). The
expression of RET was downregulated after knockdown of LMO1
at mRNA (Fig.5b) and protein (Fig.5c) levels in Kelly and
SH-SY5Y cells. Phosphorylation of ERK1/2, which is a downstream effector of the MAP kinase pathway activated by RET kinase
phosphorylation35, was decreased after knockdown of RET in the
Kelly cells (Fig.5d, e). Furthermore, knockdown of RET inhibited
the growth and increased the fraction of Sub-G1 population in Kelly cells (Supplementary Fig. 5a, b), consistent with
observa-tions reported by others34. These results indicated that LMO1 and
MYCN can promote cell growth and proliferation through upregulation of RET. However, it is noted that several LMO1-high cell lines did not express RET, whereas some LMO1-low cell lines also expressed this protein (Supplementary Fig. 5c). This suggested that LMO1 or MYCN may not be the primary deter-minant to induce RET expression, but they can positively regulate this gene when cooperating with other factors. Therefore, we highlighted ASCL1 for the downstream analysis.
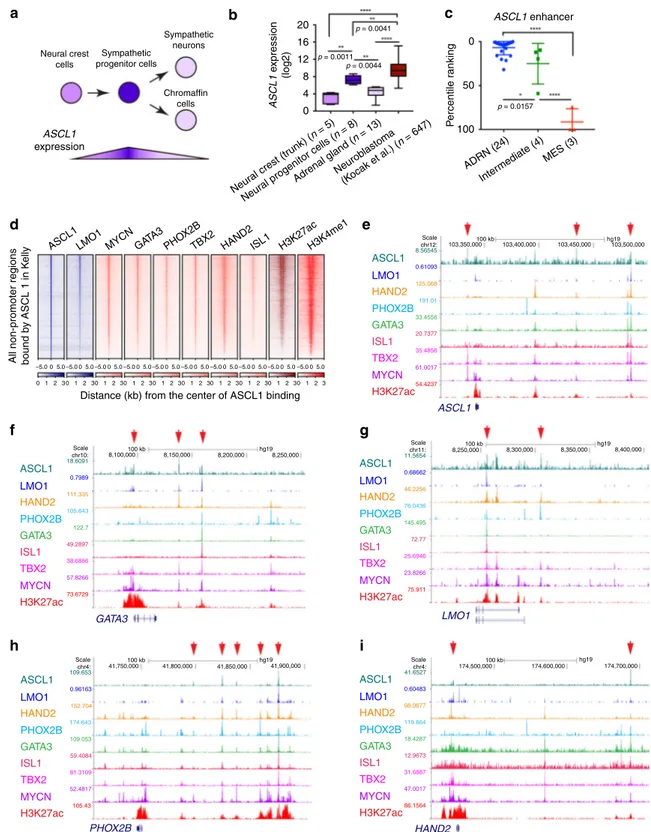
ASCL1 is a member of the CRC of ADRN neuroblastoma. Since LMO1 directly regulated ASCL1 expression, we sought to understand the role of ASCL1 in mediating LMO1-driven oncogenesis. ASCL1 has been known to be regulated in a
stage-specific manner during neuronal differentiation28,29 (Fig. 6a).
human ASCL1 expression was elevated in neural progenitor cells, compared with less differentiated neural crest cells or more
dif-ferentiated chromaffin cells in the mature adrenal gland (Fig.6b).
Furlan et al. also reported that mouse Ascl1 expression begins before the lineage specification that gives rise to progenitor cells
that differentiate into sympathoblasts and chromaffin cells36. At
the stage of E11.5, sympathoblasts start downregulating the
expression of Ascl1, whereas chromaffin cells start down-regulating the expression of Ascl1 after E13.5. These observations indicated that ASCL1 is expressed at higher levels in neural progenitor cells.
Importantly, ASCL1 expression was high in primary
neuro-blastoma cells (Fig. 6b), consistent with the origin of most
neuroblastomas from sympathetic nervous system progenitors.
shGFP#1 shGFP#2 shLMO1#1 shLMO1#2 shGFP#1 shGFP#2 shMYCN#1 shMYCN#2
K elly CHP-134 SK-N-SH SH-SY5Y Ju rkat RPMI-8402 MOL T -4 CCRF-CEM CHRM1 LMO1 17 kDa 62 kDa 34 kDa 42 kDa Neuroblastoma Neuroblastoma (Kocak et al.) p-value < 0.0001 Neuroblastoma (Kocak et al.) T-ALL MYCN Amp ASCL1 exprression (log2)
MYCN non-amplified cases MYCN amplified cases
LMO1
KD log
2
fold change
Overall survival probability
Overall survival probability Overall survival probability
Amp 0
0.0
0 2 4 6 8 10 Years Raw p value: 7.5e–18 Bonf p value: 3.4e–15
Raw p value: 2.6e–15 Bonf p value: 1.0e–12
Raw p value: 2.9e–05 Bonf p value: 1.5e–03 12 14 16 18 0.1 0.2 0.3 0.4 0.5 0.6 0.7 0.8 0.9 1.0 0.0 Row Z-score –1 –0.5 0 0.5 1 0 2 4 6 8 10 Years 12 14 16 0 2 4 6 8 10 Years 12 14 16 18 0.1 0.2 0.3 0.4 0.5 0.6 0.7 0.8 0.9 1.0 0.0 0.1 0.2 0.3 0.4 0.5 0.6 0.7 0.8 0.9 1.0 5 10 15 20 MYCN amp (n = 93) ASCL1 low (n = 363) ASCL1 low (n = 316) ASCL1 low (n = 49) MYCN Non-amp Non-amp MYCN non-amp (n = 550) ASCL1 high (n = 113)
ASCL1 high (n = 88) ASCL1 high (n = 17)
MYCN ASCL1 β-Actin ASCL1 RET SAMD11 PRCD ITGA1 GALNT6 RFTN1 MFSD1 SMCO4 CD9 TYW3 GFRA2 EML6 RAB37 CC2D2A PHKB CAMK1D CPE ID3 LTA4H CHST8 SUCO GLCE SPSB4 CBFB PYGB GRIA4 ANKRD28 MRS2 RPL22L1 TTC8 CCDC167 CDH2 MICU2 PTPN13 TAF4B SLC18A2 HTR3A GALNT10 G3BP1 PRCP a b d e c
Fig. 3ASCL1 a high-confidence LMO1 target in neuroblastoma cells. a Heatmap image represents gene expression changes of selected genes after knockdown ofLMO1 or MYCN in Kelly cells. The genes were ordered based on log2 fold-change values between control and LMO1 knockdown. The color scale represents row z-scores.b Protein expression of LMO1, MYCN, and ASCL1 in a panel of neuroblastoma and T-ALL cell lines were analyzed by western blot.β-actin was used as an internal control. MYCN-amplified (amp) and nonamplified (non-amp) cell lines are indicted. c A total of 643 primary neuroblastoma cases in the Kocak cohort31were classified into two groups: with MYCN amplification (n = 93), and without MYCN amplification (n = 550).
ASCL1 mRNA expression were shown in each group. Data are represented as box plots where the middle line indicates the median, the lower and upper hinges correspond to thefirst and third quartiles, the lowest datum indicates the minimum (within the 1.5 IQR of the lower quartile), and the highest datum indicates the maximum (within the 1.5 IQR of the upper quartile). Thep values by the Mann–Whitney test are indicated. d The survival curve analysis for primary neuroblastoma samples in the Kocak cohort31was done using the R2 database. The samples for which the prognostic data are available were
classified into two groups (ASCL1-high and low) by the Kaplan Scan method, which calculates the optimum cutoff based on statistical testing. The raw p value and Bonferroni-correctedp value are shown. The Kaplan–Meier curve analysis for each group was done using the R2 database. e Primary neuroblastoma cases for which the prognostic data are available from the Kocak cohort31were classified into two groups: without MYCN amplification (n =
This was further supported by the fact that ASCL1, LMO1, and MYCN were each more highly expressed in the ADRN subtype of neuroblastoma cell lines corresponding to sympathetic progeni-tors, but less in cell lines of the MES subtype, which appear to retain features of earlier migratory neural crest cells (Supple-mentary Fig. 6a). ADRN cases expressed higher levels of CRC
member genes (HAND2, PHOX2B, TBX2, and ISL1) than the MES subtype, whereas MES cases commonly expressed MYC
(c-MYC). Consistent with thesefindings, analysis of our previously
established neuroblastoma zebrafish models30demonstrated that
mRNA expression levels of the zebrafish orthologues, namely ascl1a, lmo1, phox2bb, hand2, tbx2a, and isl1l, were higher in
Peaks #1 +55 kb 100 kb Scale Chr12: 0.57381 33.4556 125.068 191.01 35.4856 20.7377 60.101 54.4237 35.4195 -H3K4me1 ASCL1 H3K27ac MYCN ISL1 TBX2 PHOX2B HAND2 GATA3 LMO1 103,450,000 103,500,000 103,350,000 103,400,000 hg19 +93 kb +141 kb +143 kb Kelly K elly K elly dCAS9 Transduced with Flag-dCAS9-KRAB Transduced with Dox-inducible sgRNA Induce sgRNA dCAS9 #2 #3a #3b Positions Peaks #1 +55 kb +93 kb +141 kb +143 kb #2 #3a #3b Positions Peaks #1 +55 kb +93 kb +141 kb +143 kb #2 #3a #3b Positions Con – + – + – + – + – + – + – + DOX ASCL1 ns ns p = 0.0805 p < 0.0001 p = 0.0021 p = 0.0064 p = 0.0264 p = 0.1491 p = 0.0371 p = 0.0029 p = 0.0077 p = 0.0104 p = 0.0300 p = 0.0074 p = 0.0209 160 120 80 40 0 160 120 80 40 0 shGFP shLMO1–2shLMO1–4 shGFP shMYCN–1shMYCN–3 shGFP shGA TA3–1 shGA TA3–2 160 120 80 40 0 200 150 100 50 0 DOX – + con – + – + – + – + – + – + β-Actin sg#1 sg#2 sg#3 sg#4 sg#5 sg#7 sg#1 sg#2 sg#3 sg#4 sg#5 sg#7 K elly ASCL1 mRNA e xpression [% of con DO X(–)] ASCL1 mRNA e xpression (% of shGFP) sgRNA KRAB domain Transcription repression α-Tubulin dCAS9 200 kDa 52 kDa 34 kDa 42 kDa Kelly CHP-134 SK-N-SH SH-SY5Y LMO1
shGFP shLMO1 #1 shLMO1 #2 shLMO1 #4 shGFP shLMO1 #1 shLMO1 #2 shLMO1 #4 shGFP shLMO1 #1 shLMO1 #2 shLMO1 #4 shGFP shLMO1 #1 shLMO1 #2 shLMO1 #4 17 kDa 34 kDa 52 kDa ASCL1 α-Tubulin a b c e d f
Fig. 4ASCL is directly regulated by LMO1 and MYCN in neuroblastoma cells. a ChIP-seq gene tracks showing the binding locations of various transcription factors at theASCL1 gene locus in Kelly cells. Black arrows (top) indicate regions associated with H3K27ac signals in Kelly cells (peaks 1, 2, 3a, and 3b). b Kelly cells wasfirst transduced with the dCas9-KRAB protein. sgRNAs (sg#1–7) targeting each of peaks bound by LMO1 (peaks 1, 2, 3a and 3b) were then induced by the treatment with doxycycline (DOX) (right). Protein expression of dCas9 was confirmed by western blot (left). α-tubulin was used as an internal control.c Protein expression of ASCL1 after the induction of each sgRNA was analyzed by western blot. d mRNA expression ofASCL1 after the induction of each sgRNA was analyzed by qRT-PCR. Expression was normalized tospike-in control RNA and shown as a percent relative to untreated control samples. Data are represented as means ± standard error of the mean (SEM) for three biological replicates. Thep values by two-tailed unpaired t test are indicated.e mRNA expression ofASCL1 after knockdown of LMO1, MYCN, and GATA3 in Kelly cells were analyzed by qRT-PCR. Expression was normalized tospike-in control RNA and shown as a percent relative to control shGFP. Data are represented as means ± SEM for three biological replicates. Thep value by one-way ANOVA followed by Tukey's multiple comparisons post hoc test are indicated. f Protein expression of LMO1 and ASCL1 were analyzed after transduction of different LMO1 shRNAs infive different neuroblastoma cell lines.
MYCN-induced tumors compared with the c-MYC-induced tumors (Supplementary Fig. 6b). Furthermore, the ASCL1 gene locus itself was associated with a regulatory region highly enriched for H3K27ac, indicative of an enhancer ranked in top 10% of enhancers in ADRN subtype cell lines but not in MES
subtype cell lines (Fig. 6c). This result suggested that ASCL1 is
possibly involved in the ADRN CRC in neuroblastoma cells. In fact, ChIP-seq analysis demonstrated that ASCL1 frequently co-occupies regions with LMO1, MYCN and members of the
ADRN CRC in Kelly cells (Fig.6d). ASCL1 is bound to regions
within regulatory elements of CRC genes at sites that were also bound by LMO1, HAND2, PHOX2B, GATA3, ISL1, TBX2, and
MYCN in Kelly cells (Fig.6e-i). The E-box motif that is recognized
by type II bHLH proteins, such as ASCL1, as heterodimers with
type I bHLH proteins, was significantly enriched in the ASCL1-bound regions (Supplementary Fig. 6c). These results indicated that ASCL1 is a member of CRC in ADRN neuroblastoma.
Of note, analysis of a dataset from single cells during neural
crest development by Furlan et al.36, showed that mouse Ascl1 is
expressed by a large fraction of the bridging cell population between Schwann cell precursors and chromaffin cells (Supple-mentary Fig. 6d). There was some overlap of Phox2b, Hand2, and Isl1 expression with cells expressing Ascl1, although there was not a significant correlation between cells expressing the highest expression of Ascl1 and expression levels of ADRN CRC genes. Lmo1, Mycn, Tbx2, and Gata3 were only expressed by a small fraction of these cells. Thus, this bridging cell population is not governed by the ADRN neuroblastoma CRC. Other regulatory
K elly LMO1 Jurkat 20 -0 _ GATA3 Kelly Kelly Scale a chr10: 43,400,000 43,450,000 43,500,000 43,550,000 hg19 43,600,000 100 kb 0.54828 -0.10009 _ 6.40714 76.6369 -0.00028 _ 0.10034 _ 83.176 - 83.8102153.16 -5e-05 _ 0.02061_ 0.007 _ Kelly LMO1 160 120 RET 90 60 30 0 p = 0.0354 p = 0.0109 p = 0.0212 p = 0.0083 120 80 40 0 160 120 80 40 0 RET mRNA e xpression (% of shGFP) RET mRNA e xpression (% of shGFP) RET Phospho-ERK Phospho-ERK ERK Cleaved-PARP ERK RET α-Tubulin α-Tubulin
shGFP shLMO1 #1 shLMO1 #2 shLMO1 #1
shGFP shGFP shGFPshRET -3 shRET -4 shGFP
shLMO1–2shLMO1–4 shMYCN–1shMYCN–3
shRET #1 shRET #3 shLMO1 #2 shLMO1 #4 shGFP shLMO1 #4 SH-SY5Y 17 kDa 150, 175 kDa 150, 175 kDa 42, 44 kDa 42, 44 kDa 42, 44 kDa 42, 44 kDa 89 kDa 52 kDa 52 kDa SH-SY5Y SK-N-SH MYCN H3K27ac MIR5100 RET b c d e
Fig. 5RET is directly regulated by LMO1 in neuroblastoma cells. a ChIP-seq gene tracks showing the binding locations of various transcription factors at the RET gene locus in Kelly cells. Red arrows (top) indicate regions associated with H3K27ac signals in Kelly cells. b mRNA expressions of RET after knockdown ofLMO1 and MYCN in Kelly cells were analyzed by qRT-PCR. Data are represented as means ± SEM for three biological replicates. The p value by one-way ANOVA followed by Tukey's multiple comparisons post hoc test are indicated.c Protein expressions of RET, LMO1, p-ERK, and total ERK were analyzed after transduction of different LMO1 shRNAs in three different neuroblastoma cell lines.α-tubulin was used as an internal control. d The mRNA expression ofRET after RET knockdown were measured by qRT-PCR. Data are represented as mean of technical duplicates. The p values by one-way ANOVA followed by Tukey's multiple comparisons post hoc test are indicated.e Protein expressions of RET, p-ERK, total ERK, and cleaved PARP were analyzed after transduction of different RET shRNAs in Kelly neuroblastoma cell line.α-tubulin was used as an internal control.
0 20 a Sympathetic neurons Sympathetic progenitor cells Chromaffin cells ASCL1 LMO1 HAND2 PHOX2B GATA3 ISL1 TBX2 MYCN H3K27ac ASCL1 LMO1 GATA3 HAND2 PHOX2B ASCL1 LMO1 HAND2 PHOX2B GATA3 ISL1 TBX2 MYCN H3K27ac ASCL1 LMO1 HAND2 PHOX2B GATA3 ISL1 TBX2 MYCN H3K27ac ASCL1 LMO1 HAND2 PHOX2B GATA3 ISL1 TBX2 MYCN H3K27ac ASCL1 LMO1 HAND2 PHOX2B GATA3 ISL1 TBX2 MYCN H3K27ac Neural crest cells 16 12 8 Scale chr12: 103,350,000 103,400,000 103,450,000 103,500,000 8,400,000 8,350,000 8,300,000 174,500,000 174,600,000 41,900,000 41,850,000 41,800,000 41,750,000 174,700,000 8,250,000 hg19 100 kb hg19 100 kb hg19 100 kb hg19 100 kb 8,250,000 8,200,000 8,150,000 8,100,000100 kb hg19 8.56545 0.61093 125.068 191.01 33.4556 20.7377 35.4856 61.0017 54.4237 Scale chr11: Scale chr10: Scale chr4: Scale chr4: 11.5654 41.6527 0.68662 46.2256 76.0436 145.495 72.77 25.6946 23.8266 75.911 0.7989 111.335 105.643 122.7 49.2897 38.6886 57.8266 73.6729 18.6091 0.60483 98.0677 119.864 18.4287 12.9673 31.6887 47.0017 86.1564 109.653 0.96163 152.704 174.643 109.053 59.4084 81.3109 52.4817 105.43 4 0 ASCL1 enhancer ASCL1 expression ASCL1 e x pression (log2)
All non-promoter regions bound b
y ASCL 1 in K e lly 50 P e rcentile r anking 100 ADRN (24) Neur al crest (tr unk) ( n = 5) ASCL1LMO1 MYCN GATA 3 PHO X2B
TBX2 HAND2ISL1 H3K27acH3K4me1
Neur al progenitor cells ( n = 8) Adrenal gland ( n = 13) Neurob lastoma (Kocak et al.) ( n = 647) Inter mediate (4)MES (3) p = 0.0157 p = 0.0044 p = 0.0011 p = 0.0041 0 1 2 3 0 1 2 30 1 2 30 1 2 30 1 2 30 1 2 30 1 2 30 1 2 30 1 2 30 1 2 3 –5.005.0–5.005.0–5.005.0–5.005.0–5.005.0–5.005.0–5.005.0–5.005.0–5.005.0–5.005.0
Distance (kb) from the center of ASCL1 binding
b c d e f h g i
Fig. 6ASCL1 is a member of CRC in the ADRN subtype of neuroblastoma. a Schematic image for neural differentiation and ASCL1 expression. b The mRNA expression ofASCL1 in normal neural crest, neural progenitor cells, adrenal gland, and neuroblastoma tumors (Kocak cohort31) were analyzed by the R2
database. The sample numbers are indicated. Data are presented as box plots where the middle line indicates the median, the lower, and upper hinges correspond to thefirst and third quartiles, the lowest datum indicates the minimum (within the 1.5 IQR of the lower quartile), and the highest datum indicate the maximum (within the 1.5 IQR of the upper quartile). Thep value by one-way ANOVA followed by Tukey's multiple comparisons post hoc test are indicated inb and c. ****p value < 0.0001. c The dot pot for enhancer ranking in neuroblastoma cell lines (24 ADRN subtype neuroblastoma cell lines, 4 intermediate subtype neuroblastoma cell lines, 3 MES subtype neuroblastoma cell lines). Enhancers were ranked based on H3K27ac signal from high to low. Data are represented as means ± SEM.d The ASCL1-bound gene loci werefirst selected in Kelly cells. Density plots show the distribution of LMO1, MYCN, GATA3, H3K27ac, and H3K4me1 signals at the ASCL1-bound regions (±5 kb from binding sites) in Kelly cells. The color scale shows the intensity of the distribution signal. ChIP-seq gene tracks showing the binding locations of ASCL1 together with various transcription factors at theASCL1 (e), GATA3 (f),LMO1 (g), PHOX2B (h), and HAND2 (i) gene loci in Kelly cells. Red arrows (top) indicate ASCL1-bound peak regions, which were determined by peak calling.
mechanisms may drive high levels of Ascl1 expression in this bridging cell population.
ASCL1 is involved in neuroblastoma differentiation status. Lastly, we analyzed genes and pathways controlled by ASCL1 in neuroblastoma cells. We performed an RNA-seq analysis after
ASCL1 knockdown in Kelly cells (Fig.7a) and selected genes that
were significantly downregulated after ASCL1 knockdown com-pared with control samples. GO term analysis revealed that many pathways involved in the sympathetic nervous system develop-ment and noradrenergic lineage commitdevelop-ment were enriched for
the genes downregulated by ASCL1 knockdown (Fig.7b).
Importantly, knockdown of ASCL1 resulted in the increased expression of genes that are normally upregulated during the transition from neural progenitor to differentiated neuronal cells, such as NTRK1/TrkA and NPY. The result was independently
validated by qRT-PCR (Fig. 7c). As a positive control,
proneuronal differentiation stimuli, such as all-trans retinoic acid
(ATRA)37, also resulted in upregulation of these genes
(Supple-mentary Fig. 7a). In addition, IGF2, which has been reported as a
target of ASCL138, was upregulated after ASCL1 knockdown
(Supplementary Fig. 7b). In contrast, ASCL1 knockdown resulted in a downregulation of several genes that are highly expressed in normal neuronal progenitor cells and are members of the neuroblastoma CRC, such as PHOX2B and HAND2. The result
was independently validated by qRT-PCR (Fig. 7d). These
findings indicate that ASCL1 affects the cellular differentiation status in neuroblastoma cells.
Previous studies have shown that phosphorylation also
modulates the function of ASCL136,44, and that the
phosphory-lated form of ASCL1 is associated with undifferentiated neuronal cells. Indeed, ASCL1 protein bands migrated faster after the treatment with lambda phosphatase in all cell lines examined (Supplementary Fig. 7c), suggesting that the predominant fraction is likely phosphorylated supporting the previous study
by others36,44. Conversely, the treatment of Kelly cells with
Calyculin A, a protein phosphatase inhibitor, increased this fraction (Supplementary Fig. 7d). These results suggested that the ASCL1 protein is constitutively phosphorylated in neuroblastoma cells, affecting cell differentiation status and resulting in differentiation arrest of neuroblastoma cells.
In fact, knockdown of ASCL1 promoted axonal extension in
the presence of NGF (Fig. 7e), which is a primary ligand for
NTRK1. This phenotype was intensified with the presence of low dose of ATRA. ASCL1 knockdown moderately inhibited the
growth of Kelly cells (Fig. 7f), which was accompanied with a
relative increase in percentage of cells in sub-G1 (Supplementary Fig. 7e). Similarly, the growth of SH-SY5Y cells, which does not possess MYCN amplification, was also inhibited by ASCL1 knockdown (Supplementary Fig. 7f, g). However, ASCL1 over-expression did not rescue the cell growth inhibition caused by LMO1 knockdown (Supplementary Fig. 7h–j), indicating that the effects of the CRC in maintaining neuroblastoma cell growth and survival depend on high levels of expression of each member of the CRC and the LMO1 CRC coregulator acting in concert.
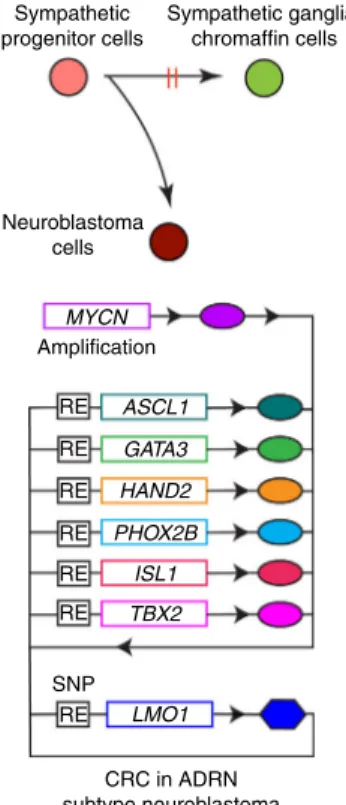
Taken together, our results indicate that ASCL1 contributes to the CRC with the other members to ensure viability and establish
the ADRN neuroblastoma cell state (Fig. 8). In this context,
LMO1 is essential for the formation of CRC and ASCL1 expression. Because LMO1 does not contain a DNA-binding
domain, it does not qualify as a bona fide CRC transcription
factor18. Rather, it appears to operate as an auxiliary
transcrip-tional cofactor involved in protein–protein interactions essential for CRC activities in the regulation of cell identity and the malignant cell state in neuroblastoma cells.
Discussion
Accumulating evidence implicates LMO1 as a critical factor in the ADRN subtype of neuroblastoma. A large-scale neuroblastoma GWAS study demonstrated that a polymorphism within the LMO1 gene locus is strongly associated with the susceptibility of
children to develop neuroblastoma8. The crucial SNP mediating
this neuroblastoma phenotype consists of an ancestral G
per-missive allele that forms a GATA DNA-binding motif9. GATA3
then participates with other CRC transcription factors to generate a potent enhancer that activates LMO1 gene expression. The protective T allele at this SNP, which appeared during evolution in human populations, does not support GATA3 binding. As a member of the ADRN CRC, GATA3 binding is essential for the super-enhancer to form that drives high levels of LMO1 expres-sion. Because LMO1 lacks a DNA-binding domain, it cannot be a member of the ADRN CRC in neuroblastoma, but rather it serves as an essential transcriptional regulatory cofactor for formation of the autoregulatory loop that comprises the CRC, and the absence of LMO1 expression leads to decreased levels of each of the ADRN CRC transcription factors.
Importantly, here we provide an insight into the mechanisms by which LMO1 contributes to the ADRN neuroblastoma pathogenesis. Our study shows that LMO1 is essential for proper expression of ASCL1, a newly identified ADRN CRC member. It is noteworthy that we and other groups independently identified PHOX2B and HAND2 as key components of the CRC in ADRN
neuroblastoma cases5,19,21. Our current results demonstrate that
ASCL1 binds to the associated enhancers and regulates the expression of CRC members—PHOX2B, HAND2, GATA3, TBX2, and ISL1—in concert with LMO1 and MYCN. Each of these transcription factors are highly expressed in the ADRN subtype of neuroblastoma as compared with the MES subtype. ASCL1 co-binds with LMO1 at the loci of binding of the CRC transcrip-tional protein complex within regulatory elements of each CRC gene. This mechanism likely relates to the established proclivity of LMO1 to participate in transcriptional complexes containing the class II bHLH proteins (TAL1, TAL2, or LYL1) observed in
T-ALL13. Given that ASCL1 is also a selective neuroblastoma
dependency gene whose locus is bound by the CRC delineated by
our prior work19, and whose product binds coordinately with the
ADRN CRC members to enhancers controlling each of the CRC members and genes of the extended regulatory network, we propose that ASCL1 is also an essential transcription factor and member of the feed-forward autoregulatory loop that comprises the CRC in the ADRN subtype of neuroblastoma.
In this context, MYCN further promotes gene expression program induced by the ADRN CRC in neuroblastoma cells. A
recent study suggests that “enhancer invasion” shapes
MYCN-dependent transcriptional upregulation in neuroblastomas with
MYCN gene amplification24. Loss of MYCN leads to a global
reduction in transcription, which is more evident at the MYCN target genes with the highest enhancer occupancy. In particular, tissue-specific enhancers define highly tumor-specific MYCN target genes. In fact, we observed that MYCN frequently co-occupies the enhancers of target genes with LMO1, including those of CRC members, which characterize the ADRN subtype neuroblastoma. Hence, when expressed at high levels, MYCN
serves as an“enhancer invader” that reinforces the gene
expres-sion program of the entire adrenergic CRC, including LMO1 as a coregulator of this CRC.
During normal peripheral nervous system development, ASCL1 is expressed in sympathetic progenitor cells and extin-guished when cells become differentiated into neurons or
chro-maffin cells28,29. Narayanan et. al. reported that ASCL1 not only
promotes the acquisition of a proneural phenotype in
similar relationship may exist in neuroblastoma cells, in which the more neural crest-like mesenchymal cells do not express ASCL1, and ASCL1 expression is specifically upregulated as cells differentiate along the sympathetic lineage and express members of the ADRN CRC. In fact, our study demonstrated that ASCL1 can positively regulate CRC genes that are expressed in neuronal progenitor cells such as PHOX2B and HAND2 and also negatively regulates genes expressed in more differentiated cells such as NTRK1 and NPY. Thus, high levels of ASCL1 expression, along with LMO1 and MYCN, helps to mediate a differentiation arrest at the neural progenitor stage, which is an essential component of
childhood neuroblastoma. Of note, comparisons shown in Sup-plementary Fig. 6d argue that, although many of the cells bridging between Schwann cell precursors and chromaffin cells express high levels of Ascl1, this expression is not regulated by the CRC of
the ADRN subset of human neuroblastoma. This finding is
compatible with these bridging cells contributing to neuro-blastoma through a different developmental CRC.
In this study, we also compared genomic loci bound by LMO1 and gene expression profiles after LMO1 knockdown between neuroblastoma and T-ALL cells. Although LMO1 frequently co-occupies target loci with GATA3 in both neuroblastoma and
T-160 300 500 160 ASCL1 120 80 40 0 400 300 200 100 0 200 100 shGFP No treatment NGF (100 ng/mL) NGF (100 ng/mL); RA (100 nM) CHP-134 shASCL1 #2 shASCL1 #3 shGFP Kelly shASCL1 #2 shASCL1 #3 0 p = 0.0262 p = 0.0201 p = 0.0013 p = 0.0002 p = 0.0022 p = 0.0017 p = 0.0006 p = 0.0037 p = 0.0041 p = 0.0163 p = 0.0083 p = 0.0252 mRNA e x pression (% of shGFP) mRNA e x pression (% of shGFP) mRNA e x pression (% of shGFP) 120 80 40 0 160 8.0 6.0 4.0 2.0 0.0 PHOX2B HAND2 NPY NTRK1 Kelly Kelly Kelly a b c e d f
Kelly: GO biological process after ASCL1 knockdown
Neuronal ion channel clustering (GO:0045161) 5.70385e–05 0.003527965 0.000945053 0.000945053 0.00142774 0.001050938 0.00142774 0.005440203 0.000340902 0.010069744 Retinal ganglion cell axon guidance (GO:0031290)
Sympathetic ganglion development (GO:0061549) type B pancreatic cell differentiation (GO:0003309) Intraciliary retrograde transport (GO:0035721) Sympathetic nervous system development (GO:0048485) Ganglion development (GO:0061548)
Cytoplasmic sequestering of NF-kappaB (GO:0007253) Noradrenergic neuron differentiation (GO:0003357) Melanosome transport (GO:0032402)
120 80 40 0 shGFP shASCL1–2shASCL1–3 shGFP shASCL1–2shASCL1–3 shGFP shASCL1–2shASCL1–3 shGFP shASCL1–2shASCL1–3 shGFP shASCL1–2shASCL1–3 Cell g ro w th r a te (f old-change from da y 3) 3 5 7 9
Time (days after lentivirus infection)
12 14 16 18 20 22 24 26 28
Combined score
P -value
Fig. 7 ASCL1 is required for cell growth and regulates neural differentiation status. a Two different shRNAs targetingASCL1 (#2, 3) were transduced into Kelly cells. The mRNA expression ofASCL1 was measured by qRT-PCR, and shown as a percent relative control shGFP. Data are represented as means ± SEM for three biological replicates. Thep value by one-way ANOVA followed by Tukey's multiple comparisons post hoc test are indicated in a, c, d, and f. ****p value < 0.0001. b The shRNA targeting ASCL1 or control (GFP) was transduced into Kelly by lentiviral infection. Experiments were done in biological duplicates. Total RNAs were harvested after 3 days of infection and were subjected to RNA-seq analysis to compare gene expression profiles between two controls and twoASCL1 knockdown (KD) samples. Genes differentially expressed (adjusted p value < 0.05, log2fold-change <−0.5 and TPM > 3) were selected for gene ontology analysis. Top ten terms were shown with combined score. Thep values by the Fisher exact test are indicated. c, d The mRNA expression of genes involved in neural differentiation and mRNA expression of CRC members were analyzed by qRT-PCR afterASCL1 knockdown in Kelly cells. Expression was shown as a percent relative to shGFP control. Data are represented as means ± SEM for three biological replicates.e CHP-134 cells were treated with or without NGF (100 ng/mL) or/and ATRA (100 nM) after being transduced with shRNAs. The cells were then stained with an antineurofilament antibody, with images representative of three fields taken at ×40 original magnification. Scale bars were shown in white at bottom right, 20μm. f Cell viability was measured after 3, 5, 7, and 9 days of infection in Kelly cells (n = 3 per group). The growth rate (fold-change) over 9 days compared with day 3 was indicated. Values represent means ± SD for technical triplicates.
ALL cells, there was little overlap among the regulated enhancers between these two cell types. Similarly, genes and pathways regulated by LMO1 knockdown in neuroblastoma cells were distinct from those in T-ALL cells. These results indicate that LMO1 regulates gene expression in a tissue/tumor-type specific manner, consistent with the fact that it acts in cooperation with type II bHLH proteins, which are known to play key roles in
establishing cell lineage13,25–28. Because LMO1 alone cannot
directly bind to DNA, the target sites of LMO1 largely depend on the binding of its protein–protein interaction partners, which are DNA-binding transcription factors expressed in specific tissues, whose binding may also be also affected by epigenetic alterations and chromatin status. It is intriguing that LMO1 participates as a cofactor in CRCs containing GATA3 in both T-ALL and neu-roblastoma; however, the remainder of the CRC of T-ALL and neuroblastoma remain completely distinct. The extensive studies of the roles of LMO proteins in T-ALL and the control of
hematopoiesis13provide a model for future studies to define the
transcriptional complexes that mediate gene expression through the ADRN CRC in neuroblastoma.
Taken together, our study shows that ASCL1 is an integral member of the neuroblastoma CRC, essential for the formation of the feed-forward autoregulatory loop that drives the oncogenic transformation in concert with MYCN. In this context, LMO1 is a critical cofactor of the CRC. Our data provide evidence that the neuroblastoma CRC, operating through an LMO1-ASCL1 axis, not only promotes the growth and survival of malignant neuro-blasts, but also blocks the differentiation of sympathetic progenitor cells.
Methods
Cell culture and reagents. All neuroblastoma cell lines (Kelly, SH-SY5Y, CHP-134, and SK-N-SH) and T-ALL cell lines (Jurkat, RPMI-8402, MOLT-4, and CCRF-CEM) were cultured in RPMI-1640 medium (Biowest) supplemented with 10% FBS (Biowest) and 1% penicillin/streptomycin (Thermo). All cell lines were confirmed by DNA fingerprinting using the PowerPlex 1.2 system (Promega, Madison, WI, USA) and were regularly tested for mycoplasma contamination.
293T cells were cultured in DMEM medium (Biowest) supplemented with 10% FBS (Biowest) and 1% penicillin/streptomycin (Thermo). Cells were incubated in 37 °C with 5% CO2. ATRA, NGF, and DOX hydrochloride were purchased from Sigma and dissolved in DMSO.
Gene knockdown. The shRNA sequences were designed according to the RNA Consortium’s recommendation (http://www.broadinstitute.org/rnai/trc) and cloned into the lentiviral vector pLKO.1-puro at the Age I and EcoR I digestion site. Each individual shRNA vector (500 ng) was co-transfected into 293T cells with the packaging plasmids pMDLg/pRRE (250 ng) and pRSV-Rev (250 ng) together with the envelope plasmid pMD2.G (250 ng) into 293T cells (200,000 cells) seeded into six-well plate 24 h before transfection, using the FuGENE 6 transfection reagent (Roche) and Opti-MEM, according to the manufacturer’s instruction. Medium was changed 24 h after transfection. Supernatants containing lentivirus was then collected after 48 and 72 h post transfection, combined, andfiltered through a 0.45 mm nitrocellulosefilter (Thermo). The Jurkat cells were infected with lentivirus in the presence of polybrene (8μg/mL: Millipore) by centrifugation at 1300 rcf for 1.5 h. Neuroblastoma cells were transduced with lentivirus in the presence of polybrene (8μg/mL: Millipore) for 2 h incubation followed by toping up fresh medium. Approximately 500,000 cells were infected with 1 mL of virus medium. The cells were then selected by the addition of puromycin (0.7μg/mL for Jurkat cell line; 0.5μg/mL for neuroblastoma cell lines) for at least 36 h after infection. shRNA sequences are shown in Supplementary Data 3.
Gene overexpression. The LMO1 cDNA (CDS region of LMO1 transcript, NM_001270428.1) was amplified and cloned into the pMSCV-IRES-GFP retro-virus vector. Retroviral vector (1000 ng) was co-transfected into 293T cells (200,000 cells) seeded into six-well plate 24 h before transfection with the packa-ging plasmid pMD-MLV (250 ng) and the envelope plasmid VSV-G (250 ng) using FuGENE 6 reagent (Roche) and Opti-MEM. Approximately 500,000 cells were transduced with 1 mL retrovirus media in the presence of polybrene (8μg/ml: Millipore) for 2 h incubation followed by toping up of 1 mL fresh medium. The cells that express GFP were then sorted byflow cytometry using the BD FACSAria II (BD Biosciences).
Cell viability assay. Neuroblastoma cells were seeded into 96-well plates (2500 cells/well) at 24 h post virus infection. Cell viability was measured after 3, 5, 7, and 9 days, based on luminescence by the Cell Titer Glo assay (Promega) using the Tecan Inifinite 200 PRO plate reader (Tecan).
RNA extraction and quantitative reverse transcriptase PCR (qRT-PCR). Total RNA was extracted using the NucleoSpin RNA kit (Macherey-Nagel). A total of 1000 ng of the purified RNA was reverse-transcribed into cDNA in 10 μL reaction andfinally diluted to 50 μL, using the QuantiTect kit (QIAGEN) according to manufacturer guidelines. PCR mix contains 2μL cDNA, 10 μL Power SYBR Green PCR Master Mix (Roche), and 1μL of each forward primer and reverse primer (final concentration of 500 nM). The mRNA expression levels of the genes of interest were evaluated byΔΔ Ct method by performing qPCR analysis the Quant Studio 3 Real-Time PCR System (Thermo Fisher Scientific) with following cycling condition: 2 min at 50 °C, 10 min at 95 °C, and 1 min at 60 °C, with ramping temperature 1.6 °C/s. Primers were tested for standard curve with serial diluted DNA to ensure efficiency between 90 and 110% and R2for standard curve greater than 0.95 and single peak for melt curve to ensure the primer specificity. Primer sequences for each individual gene are shown in Supplementary Data 4. Protein extraction and western blot analysis. The cells were lysed in RIPA Buffer (20 mM Tris-HCl (pH 7.5), 150 mM NaCl, 1 mM Na2EDTA, 1 mM EGTA, 1% NP-40, 1% sodium deoxycholate, 2.5 mM sodium pyrophosphate, 1 mM beta-glycerophosphate, 1 mM Na3VO4, 1 µg/mL leupeptin) (#9806, Cell Signaling Technology) with protease inhibitors (Roche). Equal amounts of protein was diluted in Laemmli sample buffer (Bio-Rad) with 10%β-mercaptoethanol and boiled for 10 min at 95 °C. Protein samples were resolved by SDS-PAGE gel using Bio-Rad system, with running buffer (Bio-Rad), and subsequently blotted onto a PVDF membrane (Bio-Rad). Membranes were block with 5% nonfat milk for 1 h and washed with washing buffer (TBS-Tween 0.1%) following incubation with primary antibody diluted in 5% BSA (Sigma) dissolved in washing buffer, overnight at 4 °C. Incubation with secondary antibodies were performed after washing for 1 h at room temperature. HRP-labeled anti-rabbit (7074, Cell Signaling Technologies, 1:10,000 dilution) and anti-mouse (7076P2, Cell Signaling, 1:10,000 dilution) antibodies were used. Proteins were visualized by enhanced chemiluminescence (Thermo). Antibodies used for immunoblotting were as follows: LMO1 (Bethyl Laboratories, #A300314A, 1:1000 dilution), ASCL1 (Santa Cruz, 1:200 dilution, #sc-390794), MYCN (Cell Signaling Technologies, 1:1000 dilution, #84406), RET (Cell Signaling Technologies, 1:1000 dilution, #14299), ERK (Cell Signaling Technologies, 1:1000 dilution, #9102), phosphor-ERK (Cell Signaling Technolo-gies, 1:1000 dilution, #9101),α-tubulin (Cell Signaling Technologies, 1:1000 dilu-tion, #2144) andβ-actin (Cell Signaling Technologies, 1:1000 dilution, #8457). Original uncropped images are shown in Supplementary Fig. 8.
RE Amplification Neuroblastoma cells Sympathetic progenitor cells Sympathetic ganglia/ chromaffin cells MYCN RE RE RE RE RE RE CRC in ADRN subtype neuroblastoma SNP LMO1 TBX2 ISL1 PHOX2B HAND2 GATA3 ASCL1
Fig. 8 Schematic image for CRC members in ADRN type of neuroblastoma. RE regulatory element.
Blocking of genomic DNA elements. To express dCas9-KRAB protein, lentivirus was made using pLV hU6-sgRNA hUbC-dCas9-KRAB-T2a-Puro lentivirus vector (500 ng; Addgene plasmid #71236) together with packaging plasmids pMDLg/ pRRE (250 ng), pRSV-Rev (250 ng) and the envelope plasmid pMD2.G (250 ng). Kelly cells were infected with virus medium using the same method mentioned in previous section. The cells were selected by puromycin (0.5μg/mL) for 3 days. Subsequently, dCas9-KRAB expressing cells were transduced with an inducible sgRNA and a GFP gene. The sgRNA sequences were designed and cloned into FgH1tUTG lentivirus vector (Addgene#70183) at the BmsBI digestion site. Lenti-virus were made using the vector by the method mentioned above. After 4 days of transduction of the sgRNA vector, the cells were selected by GFP signal byflow cytometry using the BD FACSAria II (BD Biosciences). The cells were then treated with 1000 ng/mL DOX to induce a sgRNA expression. The sgRNA sequences were designed using CRISPR Design Tool (http://crispr.mit.edu/) and shown in Sup-plementary Data 5.
Chromatin immunoprecipitation-quantitative PCR (ChIP-qPCR). Approximately 10 million cells were crosslinked with 1% formaldehyde (final concentration) for 10 min by invertingflasks at room temperature and quenched with 250 mM Glycine. The cells pellets were washed in PBS and then stored at−80 °C. The pellets were lysed in lysis buffer I (50 mM HEPES-KOH pH 7.5, 140 mM NaCl, 1 mM EDTA pH 8.0, 10% Glycerol, 0.5% NP-40, 0.25% Triton X-100, and complemented with protease inhibitor cocktail) for 10 min. After centrifugation, supernatant was discarded and the pellet was lysed in lysis buffer II (10 mM Tris-HCl pH 8.0, 200 mM NaCl, 1 mM EDTA pH 8.0, 0.5 mM EGTA pH 8.0, and complemented with protease inhibitor cocktail) for 10 min. After centrifugation, supernatant was discarded and the pellet was lysed in lysis buffer III (10 mM Tris-HCl, 100 mM NaCl, 1 mM EDTA pH 8.0, 0.1% SDS buffer, 1% Triton-X, and complemented with protease inhibitor cocktail) and subject to sonication. Chromatin was sheared by the Bioruptor Plus sonicator (Diagenode) at high power for 50 cycles of 30 s, with a 30-s pause between cycles. Sheared chromatin was incubated with primary antibody bound to the Dynabeads Protein G (Thermo Fisher Scientific) overnight, followed by elution and reverse cross-linking at 65 °C for 15 h. TE-buffer was added in DNA elution buffer followed by RNase treatment (0.45 mg/mL) at 37 °C for 2 h and by proteinase K treatment (0.3 mg/mL) at 55 °C for 30 min. DNA was isolated using 400μL of the separated lower phase of the Phenol-Chloroform-isoamyl alcohol in MaXtract High Density 2 mL gel tubes (Qiagen) by centrifugation at full speed for 7 min. The aqueous layer was then transferred to a new tube and subsequently added NaCl solution (100 mM final concentration), glycogen solution (20 μg) and 800 μL 100% ethanol, and incu-bated at−80 °C for 1 h. DNA was precipitated by centrifuge at full speed for 20 min and washed with 75% of ethanol and pelleted. Pelleted DNA was dissolved in RNase/ DNase free water. Antibodies used for ChIP-PCR were as follows: LMO1 (Bethyl Laboratories, #A300314A), Flag (Sigma, #F1804), H3K27ac (Abcam), and IgG (Santa Cruz). After the purification of DNA, quantitative PCR was performed using the Quant Studio 3 Real-Time PCR System (Thermo Fisher Scientific) with purified DNA, Power SYBR Green PCR Master Mix (Roche) and PCR primers against the genomic regions of interests. PCR primer sequences were shown in Supplementary Data 6.
Chromatin immunoprecipitation sequencing (ChIP-seq). For each ChIP, 10 µg of antibody was conjugated to 2 mg of M270 epoxy beads and added to 3 mL of soni-cated nuclear extract. Anti-LMO1 antibody (Bethyl Laboratories, #A300314A) and anti-ASCL1 antibody (Santa Cruz, #sc-390794) were used for ChIP. Purified DNA was prepared for sequencing according to a modified version of the Solexa Genomic DNA protocol. Fragmented DNA was end repaired and subjected to linker-mediated-PCR using oligos from Illumina. Amplified fragments were purified and applied to the flow-cell using the Solexa Cluster Station fluidics device. Samples were then subjected to sequencing according to Illumina’s standard protocols. All ChIP-seq reads were mapped to the hg19 human reference genome using bowtie2 with default parameters. Duplicates were removed from aligned ChIP-seq reads using the samtools rmdup package. ChIP-seq peaks were called with MACS14 software version 1.4.2 The output bedgraph were normalized subtracting corresponding background using MACS2 bdgcmp. LMO1 peaks (P < 1e−4) and ASCL1 peaks (P < 1e−9) called by MACS14 were selected andfiltered for nonpromoter binding peaks based on annotatePeaks from the HOMER package. Co-occurrence heatmap and metagene were plotted using deepTools version 3.1.2. Each of the signal matrix was calculated using bigwig output generated using UCSC bedGraphToBigWig of each ChIP-seq sample by deepTools computerMatrix. The signal matrix was then used to plot heatmap using deepTools plotHeatmap package40.
Enhancer ranking analysis. Enhancers were defined as regions with H3K27ac ChIP-seq enrichment. H3K7ac peaks were called using MACS2 version 1.4.2 (q-value < 5e−2 for narrow region and q-(q-value < 1e−1 for broad region) with —keep-dup= 1 and—broad. Enhancers were identified using ROSE v0.1 by merging H3K27ac peaks within 12.5 kb between each other, excluded those were fully contained within ±2 kb from TSS and ranked them along the x-axis based on H3K27ac enrichment plotted on the y-axis (https://bitbucket.org/
youngcomputation/rose). All enhancers were assigned responsible to the nearest RefSeq genes. The percentile of ASCL1 enhancer was measured by ordering the
ranking index and calculating the top ranking of ASCL1 enhancer among all other enhancers in each cell line.
RNA-sequencing (RNA-seq). Total RNA was extracted from control and knockdown samples using the QIAzol lysis reagent (Qiagen) and cleaned using the RNeasy kit (Qiagen). Samples were treated with the TURBO DNase (TURBO DNA-free Kit; Ambion) and cleaned using the RNeasy MinElute Cleanup kit (Qiagen). Strand-specific library construction and sequencing of ~100 M paired-end 100-bp-long reads by Illumina HiSeq or BGISEQ were performed at the BGI Biotech Solutions Co. Ltd. (Hong Kong, China). RNA-seq reads were aligned to the hg19 human reference genome using STAR 2.5.2a with
out-FilterMultimapNmax set to 1. Total mapped reads were quantified using htseq-count version 0.6.1, and htseq-count tables were generated based on Ensembl hg19 gene annotation gtffiles. Differential expression analysis was conducted using the Bioconductor package DESeq2 version 1.12.4. Gene expression for each neuroblastoma cell lines was estimated in transcripts per million (TPM) using Kallisto software version 0.43.1. All RNA-Seq data were normalized using the Sleuth R package from Patcher lab41. Selected gene expression from sleuth normalized TPM were used to generate heatmap using web-based heatmap tools, heatmapper42. Genes differentially expressed after knockdown of each tran-scription factor were selected using the following criteria: adjusted p value < 0.05, log 2 fold-change <−0.5 or >0.5, and TPM > 3.
GO analysis. GO analysis was performed using the Enrichr tool (http://amp. pharm.mssm.edu/Enrichr/). Combined scores were calculated by multiplying the p value computed by Fisher’s exact test by the z-score of the deviation from the expected rank.
Immunostaining. CHP-134 cells were treated with or without NGF (100 ng/mL) or ATRA (100 nM) after transduction of shRNAs. The cells were stained with an antineurofilament antibody (Cell Signaling, #2837).
Statistics and reproducibility. All the statistical analyses were done in GraphPad Prism software. A p value less than 0.05 was considered statistically significant. The details of methods used can be found in eachfigure legend. Experiments in Figs.1a, b,3b,4b, d, e,5b,7a, c–f were repeated three or more times. Experiments in
Figs.4c, f,5c–e were repeated two times. The numbers of experiments conducted in
Supplementary Figures were stated in Supplementary Methods section and Sup-plementary Figure Legends.
Reporting summary. Further information on research design is available in the Nature Research Reporting Summary linked to this article.
Data availability
ChIP-seq dataset for LMO1 and ASCL1 in Kelly cells have been deposited in the GEO database (GSE120074). ChIP-seq datasets of PHOX2B, HAND2, GATA3, MYCN, ISL1, and TBX2, H3K27ac and H3K4me1 in Kelly cells were obtained from the GEO
database (GSE94824 and GSE62726)19,43. ChIP-seq datasets of H3K27ac in various
neuroblastoma cell lines were obtained from the GEO database (GSE86672 and
GSE90683)21,44. ChIP-seq datasets of LMO1, GATA3, H3K27ac and H3K4me1 in
Jurkat cells were obtained from the GEO database (GSE94391, GSE68976, and
GSE50622, GSE119439)45–48. RNA-seq dataset for Kelly cells after LMO1 knockdown
and ASCL1 knockdown were deposited in the GEO database (GSE132760). Microarray dataset for SH-SY5Y cells after LMO1 knockdown was deposited in the GEO database (GSE130747). RNA-seq dataset for Jurkat after LMO1 knockdown has
been reported by us and deposited in the GEO database (GSE97514)48. RNA-seq
datasets for zebrafish neuroblastoma samples reported by us30were obtained from the
GEO database (GSE107518). RNA-seq dataset for various neuroblastoma cell lines
was obtained from the GEO database (GSE90683)21. Single cell sequencing dataset for
mouse neuronal cells was obtained from the GEO database (GSE99933)36. The
microarray datasets for primary neuroblastoma cases reported by the Kocak et al.31
(GSE45547), Versteeg et al.32(GSE16476) and the NRC (GSE85047) were analyzed by
the R2 database (http://hgserver1.amc.nl/cgi-bin/r2/main.cgi). The cancer cell line dataset is derived from CCLE database (https://portals.broadinstitute.org/ccle). Detailed information is also shown in Supplementary Data 7. All other methods used for Supplementary Figures are described in the Supplementary Methods section.
Received: 8 January 2019; Accepted: 11 November 2019;
References
1. Maris, J. M., Hogarty, M. D., Bagatell, R. & Cohn, S. L. Neuroblastoma. Lancet 369, 2106–2120 (2007).