HAL Id: hal-00316595
https://hal.archives-ouvertes.fr/hal-00316595
Submitted on 1 Jan 2000
HAL is a multi-disciplinary open access
archive for the deposit and dissemination of sci-entific research documents, whether they are pub-lished or not. The documents may come from teaching and research institutions in France or abroad, or from public or private research centers.
L’archive ouverte pluridisciplinaire HAL, est destinée au dépôt et à la diffusion de documents scientifiques de niveau recherche, publiés ou non, émanant des établissements d’enseignement et de recherche français ou étrangers, des laboratoires publics ou privés.
mesosphere/lower thermosphere. I. Prevailing wind
Y. I. Portnyagin, T. V. Solovjova
To cite this version:
Y. I. Portnyagin, T. V. Solovjova. Global empirical wind model for the upper mesosphere/lower thermosphere. I. Prevailing wind. Annales Geophysicae, European Geosciences Union, 2000, 18 (3), pp.300-315. �hal-00316595�
Global empirical wind model for the upper mesosphere/lower
thermosphere. I. Prevailing wind
Y. I. Portnyagin, T. V. Solovjova
Institute for Experimental Meteorology, 82, Lenin st., Obninsk, Kaluga region, 249020, Russia Received: 6 April 1999 / Revised: 11 June 1999 / Accepted: 30 June 1999
Abstract. An updated empirical climatic zonally aver-aged prevailing wind model for the upper mesosphere/ lower thermosphere (70±110 km), extending from 80°N to 80°S is presented. The model is constructed from the ®tting of monthly mean winds from meteor radar and MF radar measurements at more than 40 stations, well distributed over the globe. The height-latitude contour plots of monthly mean zonal and meridional winds for all months of the year, and of annual mean wind, amplitudes and phases of annual and semiannual harmonics of wind variations are analyzed to reveal the main features of the seasonal variation of the global wind structures in the Northern and Southern Hemi-spheres. Some results of comparison between the ground-based wind models and the space-based models are presented. It is shown that, with the exception of annual mean systematic bias between the zonal winds provided by the ground-based and space-based models, a good agreement between the models is observed. The possible origin of this bias is discussed.
Key words: Meteorology and Atmospheric dynamics (general circulation; middle atmosphere dynamics; thermospheric dynamics)
1 Introduction
Numerous attempts have been undertaken to construct a 2 D empirical wind model of the upper atmosphere that includes the upper mesosphere/lower thermosphere region. The most widely used models are the COSPAR International Reference Atmosphere 72 (CIRA-72, 1972) and the Fleming et al. (1988) model, which is a part of CIRA-86 model. Since it concerns areas far
above the greatest heights for standard rawingsondes the CIRA-72 model was mainly based on rocket data. Only sparse meteor radar and ionospheric drift data were used to develop the CIRA-72 model. A description of the global zonal wind structure at 70±110 km is given in the Fleming et al. (1988) model. In that model the zonal wind below 85 km was calculated from the thermal (gradient) wind equation and the related temperature was determined from satellite radiance measurements. Above 85 km wind data were calculated from the mass spectrometer and incoherent scatter (MSIS-83) empirical model temperatures (Hedin et al., 1991). This method is not a direct way of wind determination. In addition the reliability of the gradient winds is also questionable due to the low accuracy of the satellite temperature measurements in the upper meso-sphere, and the absence of direct temperature data between 85 and 100 km in the MSIS model. It is useful to note that the Fleming et al. (1988) model does not contain information about meridional winds. We do know that, unlike in the stratosphere, the prevailing meridional winds in the upper mesosphere/lower ther-mosphere are only 1.5±2 times slower than the zonal winds. A well-known meridional wind model for this region (Groves, 1969) has been developed utilizing rather sporadic rocket wind data, which were obtained at only a few sites in the Northern Hemisphere (NH). As a result, this model presented a quite schematic picture of the height-latitudinal structure of a zonal mean meridional wind ®eld at 60±110 km for separate sea-sons. In this case the circulation in the Southern Hemisphere (SH) was believed to be a mirror image of NH wind systems for the corresponding season, only with the opposite sign.
Nastrom et al. (1982) have also developed an empir-ical model of the meridional circulation at 95 km for NH summer. Their analysis has shown that at all measurement sites the prevailing meridional wind was predominantly southward independent of longitude. Therefore it was concluded that the prevailing wind in the lower thermosphere (LT) is mainly ageostrophic.
This conclusion of meridional wind ageostrophicity for dierent seasons was made by Portnyagin (1986) who analyzed ground-based meridional wind observations for sites located in two narrow latitudinal belts and situated far apart in longitude.
A model known as ``interim new CIRA'' contained a set of radar derived direct wind measurements for 14 locations (Manson et al., 1985). These were extensively discussed (Manson et al., 1985), and much useful information about global wind structures in the upper mesosphere/lower thermosphere region was obtained. In Manson et al. (1991) comparisons between satellite-derived gradient winds from the Fleming et al. (1988) model and radar-derived winds were made. It was found that overall the agreement for the zonal winds at the particular observational sites was rather good (but not complete). The comparison of meridional winds re-vealed signi®cant ageostrophy.
The ®rst attempt to develop a global height-latitude model of meridional winds from ground-based radar measurements was undertaken by Manson et al. (1987). However due to insucient data (only nine sites were used) the authors only succeeded in constructing the height-latitude cross-sections of meridional wind ®elds for two months and for a limited latitude range in both hemispheres.
The analytic empirical horizontal wind model (HWM93), using the height interval 70±110 km, has been recently developed by Hedin et al. (1996). The model is based not only on the CIRA-86 tabulations, but also on the selected historical rocket data, previous rocket data based tabulations, meteor radar and MF radar data, and lower thermosphere incoherent scatter data. However the data used for constructing of the model for the upper mesosphere/lower thermosphere region (80±100 km) were obtained at the limited number of stations (see Table 1 in Hedin et al., 1996).
Recently direct wind observations from the wind-imaging interferometer (WINDII) and the high-resolu-tion Doppler imager (HRDI) on board the Upper Atmosphere Research Satellite (UARS) have provided the principal new global wind data set for the upper mesosphere/lower thermosphere region. The corre-sponding empirical prevailing zonal wind models (see, e.g., Wang et al., 1997) and the prevailing meridional wind model (Fauliot et al., 1997) were constructed. Fleming et al. (1996) and Portnyagin et al. (1998) concluded that, in general, the space-based zonal wind models exhibited signi®cant dierences relative to the ground-based models. However, Fauliot et al. (1997) have stated that the WINDII-based prevailing meri-dional wind model are similar to the ground-based Portnyagin et al. (1995) model.
Here we present an updated version of our ground-based Global Empirical Wind Model (GEWM) for the upper mesosphere/lower thermosphere (70±110 km). The previous versions of the model, derived from the meteorological radar and MF radar wind measure-ments, have been published earlier by Portnyagin (1984, 1986, 1987), Portnyagin and Solovjova (1992), and Portnyagin et al. (1995). In Sect. 2 information about
the data sets is presented. In Sect. 3 we describe the method of model construction. The characteristics and variations with altitude, season and latitude of the main zonal wind structures in the upper mesosphere/lower thermosphere are presented in Sect. 4. The characteristic height-latitude meridional wind patterns and their sea-sonal evolution is the main topic of Sect. 5. The results of validation of our model by comparison of the model values with the actual experimental data as well as with the existing empirical models are discussed in Sect. 6. Section 7 presents our conclusions and summary. 2 Data sets
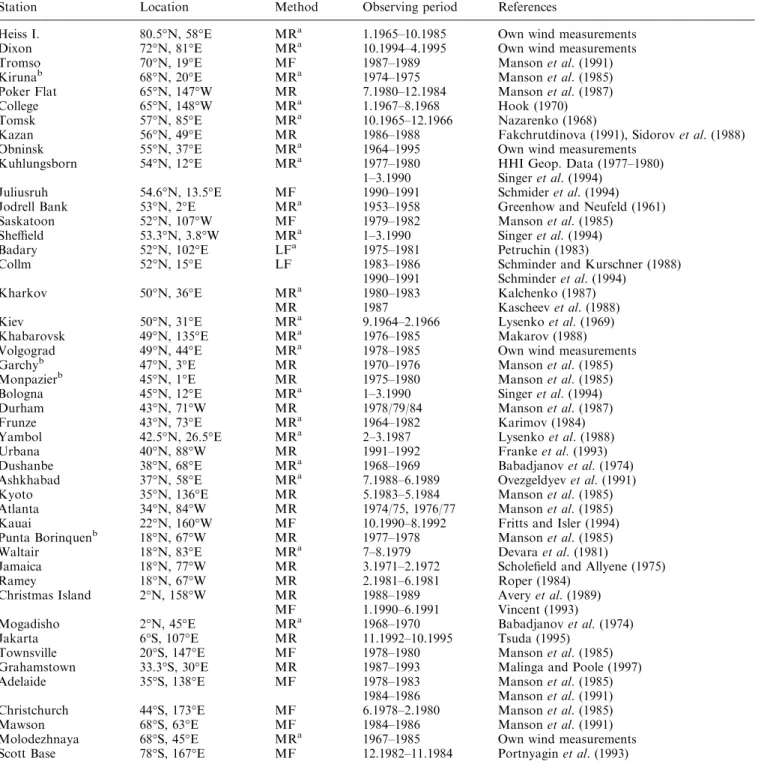
To construct the GEWM we have assimilated the all now available wind measurements in the upper meso-sphere/lower thermosphere, which were carried out with help of meteor radar and MF wind measurements. Table 1 gives a list of sites, their geographical positions and information about measurement periods. Since the measurement periods at the dierent sites do not completely coincide, it is necessary to estimate the degree of interannual variability in the wind data sets. A statistical analysis of the multi-year wind measurements at sites with suciently long time records allows us to estimate the mean square standard deviation ri of the
monthly mean wind values. For mid latitudes of the NH (Obninsk, 1964±1995, 95 km height) we obtained ri£ 4.5 m/s for zonal and ri£ 3.5 m/s for meridional
winds. For high latitudes of the SH (Molodezhnaya st., 1972±1985, 95 km height) we have ri £ 6 m/s for the
zonal winds and ri£ 4 m/s for the meridional winds.
Similar estimates for other observational sites with shorter measurement periods give similar results. There-fore on average we may adopt values of riranging from
4 to 6 m/s for the zonal wind and from 3 to 5 m/s for the meridional wind.
In developing the zonal mean model the next problem is longitudinal variations of the monthly mean values. We have calculated the mean square deviation of monthly mean values from the zonal mean rkusing data
for the sites located in two narrow latitudinal belts: 52± 57°N (Jodrell Bank/Manchester, Kuhlungsborn-Collm, Obninsk, Kazan, Badary, Saskatoon) and 45±50°N (Kiev, Kharkov, Volgograd, Durham, Khabarovsk). For both latitudinal belts we have obtained rk£ 7 m/s
and £5 m/s for zonal and meridional wind, respectively. These values also re¯ect the eect of interannual variability. The results of the DYANA campaign (Singer et al., 1994) also support our results. The comparison of available data for College, Poker Flat, Kiruna, Tromse and Dixon (a high-latitude belt) and for Punta Borinquen, Kauai, Kingston and Waltair (a low-latitude belt) permits us to suppose that on global scale the intensity of seasonal wind variations in the upper mesosphere/lower thermosphere is much stronger com-pared to longitudinal variations.
In relation to Table 1 it should be noted that some sites have height-varying measurements while others have data only at the mean height of the meteor zone
(about 95 km). It is therefore important to estimate the eect that averaging over the meteor zone has on the monthly mean winds. To do this we have used the measurement data from the Kazan meteor radar which is equipped with a height measuring system (Lysenko et al., 1994). These measurements were then averaged over the meteor zone and compared to the actual data at 95 km height. The result showed that the averaging eect is negligible in comparison with seasonal wind variations. Theoretical estimates (Palo et al., 1998) have also shown that this eect is nearly independent of
latitude. We therefore conclude that measurement data from meteor radars without height resolution can be used in our analysis of the seasonal wind variations at 95 km altitude.
3 Method of the GEWM construction
The method of construction of the GEWM is as follows. As the ®rst step all experimental monthly mean wind values (pro®les), which were obtained using the
equip-Table 1. Data base
Station Location Method Observing period References
Heiss I. 80.5°N, 58°E MRa 1.1965±10.1985 Own wind measurements
Dixon 72°N, 81°E MRa 10.1994±4.1995 Own wind measurements
Tromso 70°N, 19°E MF 1987±1989 Manson et al. (1991) Kirunab 68°N, 20°E MRa 1974±1975 Manson et al. (1985)
Poker Flat 65°N, 147°W MR 7.1980±12.1984 Manson et al. (1987) College 65°N, 148°W MRa 1.1967±8.1968 Hook (1970)
Tomsk 57°N, 85°E MRa 10.1965±12.1966 Nazarenko (1968)
Kazan 56°N, 49°E MR 1986±1988 Fakchrutdinova (1991), Sidorov et al. (1988) Obninsk 55°N, 37°E MRa 1964±1995 Own wind measurements
Kuhlungsborn 54°N, 12°E MRa 1977±1980 HHI Geop. Data (1977±1980)
1±3.1990 Singer et al. (1994) Juliusruh 54.6°N, 13.5°E MF 1990±1991 Schmider et al. (1994) Jodrell Bank 53°N, 2°E MRa 1953±1958 Greenhow and Neufeld (1961)
Saskatoon 52°N, 107°W MF 1979±1982 Manson et al. (1985) Sheeld 53.3°N, 3.8°W MRa 1±3.1990 Singer et al. (1994)
Badary 52°N, 102°E LFa 1975±1981 Petruchin (1983)
Collm 52°N, 15°E LF 1983±1986 Schminder and Kurschner (1988) 1990±1991 Schminder et al. (1994)
Kharkov 50°N, 36°E MRa 1980±1983 Kalchenko (1987)
MR 1987 Kascheev et al. (1988) Kiev 50°N, 31°E MRa 9.1964±2.1966 Lysenko et al. (1969)
Khabarovsk 49°N, 135°E MRa 1976±1985 Makarov (1988)
Volgograd 49°N, 44°E MRa 1978±1985 Own wind measurements
Garchyb 47°N, 3°E MR 1970±1976 Manson et al. (1985)
Monpazierb 45°N, 1°E MR 1975±1980 Manson et al. (1985)
Bologna 45°N, 12°E MRa 1±3.1990 Singer et al. (1994)
Durham 43°N, 71°W MR 1978/79/84 Manson et al. (1987) Frunze 43°N, 73°E MRa 1964±1982 Karimov (1984)
Yambol 42.5°N, 26.5°E MRa 2±3.1987 Lysenko et al. (1988)
Urbana 40°N, 88°W MR 1991±1992 Franke et al. (1993) Dushanbe 38°N, 68°E MRa 1968±1969 Babadjanov et al. (1974)
Ashkhabad 37°N, 58°E MRa 7.1988±6.1989 Ovezgeldyev et al. (1991)
Kyoto 35°N, 136°E MR 5.1983±5.1984 Manson et al. (1985) Atlanta 34°N, 84°W MR 1974/75, 1976/77 Manson et al. (1985) Kauai 22°N, 160°W MF 10.1990±8.1992 Fritts and Isler (1994) Punta Borinquenb 18°N, 67°W MR 1977±1978 Manson et al. (1985)
Waltair 18°N, 83°E MRa 7±8.1979 Devara et al. (1981)
Jamaica 18°N, 77°W MR 3.1971±2.1972 Schole®eld and Allyene (1975) Ramey 18°N, 67°W MR 2.1981±6.1981 Roper (1984)
Christmas Island 2°N, 158°W MR 1988±1989 Avery et al. (1989) MF 1.1990±6.1991 Vincent (1993)
Mogadisho 2°N, 45°E MRa 1968±1970 Babadjanov et al. (1974)
Jakarta 6°S, 107°E MR 11.1992±10.1995 Tsuda (1995) Townsville 20°S, 147°E MF 1978±1980 Manson et al. (1985) Grahamstown 33.3°S, 30°E MR 1987±1993 Malinga and Poole (1997) Adelaide 35°S, 138°E MF 1978±1983 Manson et al. (1985)
1984±1986 Manson et al. (1991) Christchurch 44°S, 173°E MF 6.1978±2.1980 Manson et al. (1985) Mawson 68°S, 63°E MF 1984±1986 Manson et al. (1991) Molodezhnaya 68°S, 45°E MRa 1967±1985 Own wind measurements
Scott Base 78°S, 167°E MF 12.1982±11.1984 Portnyagin et al. (1993)
ment with height resolution, were interpolated (and some extrapolated) over height. As a result the wind values were calculated for constant height levels with a standard step over height (usually 1 km). Then for each height level the wind values were interpolated over latitude using a routine cubic spline procedure. The values obtained were additionally smoothed over lati-tude with help of the Legendre function's decomposi-tion. This procedure is correct for the 2D wind models, (actually an assumption about zero winds at the poles is made).
The next step is adaptation of the obtained prelim-inary (®rst step) model to the meteor wind data without height resolution. These data are usually related to the average height of about 95 km at the dierent latitudes, and show very consistent and regular seasonal behav-iour which is practically the same as deduced from the meteor radar wind measurements with height resolution (Lysenko et al., 1994). The general conclusion of this study (see also Sect. 2) is that the seasonal course of the height-averaged monthly mean meteor wind data are well matched to the corresponding monthly means at the particular height of about 95 km and that climatic features of the seasonal variations are very persistent independent of longitude and observational periods and consistent for all types of devices. This conclusion was supported by comparison of the wind measurement data with and without height resolution for the other latitudinal belts (see Table 1).
Based on these results, we tune the preliminary wind pro®les at about 95 km to the data, obtained with the devices without height resolution, at the appropriate latitudes. The obtained additional wind pro®les for the particular sites were also incorporated in the whole set of the wind pro®les. Then, the smoothing procedures over latitude were repeated and resulting monthly mean values were calculated for the regular grid with a required height and latitude resolution (usually, 2.5° in latitude and 1 km in height). The whole model was constructed by taking into account the statistical weight (in a climatological sense) of the measurement data. Finally the height-latitude wind isoline plots were drawn with help of suitable software.
4 Global empirical zonal wind model 4.1 Monthly mean cross sections
The latitude-height cross sections of the zonally aver-aged mean zonal winds for all months are shown in Fig. 1. This ®gure clearly shows that the monthly mean zonal wind circulation is characterized by several global circulation structures with winds of a similar sign (direction). We can specify two periods with particularly stable circulation structures: November±February and May±August, and two periods when the seasonal circulation reconstruction processes are developing: March±April and September±October. During the greater part of the year (8 months) the circulation systems are rather stable. In the winter season
(Novem-ber±February in NH and May±August in SH) the global circulation region with dominating eastward winds extends over most of the height-latitude zone consid-ered. Unclosed isolines in this region at 70 km and a negative vertical gradient of the zonal wind are evidence that this region is dynamically coupled with a eastward wind structure in the winter lower thermosphere (LT). Hence, it can be concluded that the considered region of eastward winds represents the upper part of a circula-tion structure formed in the zone of a winter circum-polar global strato-mesospheric cyclone. It is worth noticing that the height of the upper boundary of this cyclone varies non-monotonically in latitude and the latitudinal zonal wind gradient repeatedly changes its sign when passing from high to low latitudes.
During the summer season (May±August in NH and November±February in SH) in the upper mesosphere the westward circulation system is dominant. This global system is connected with a summer strato-mesospheric anticyclone as is indicated by the unclosed isotaches at 70 km and the negative vertical gradient of the westward winds.
In the LT during this season a circulation system with eastward winds is seen. Such a system seems to be connected with the axially symmetric cyclonic vortex prevailing in LT in summer. This vortex may be caused by a speci®c thermal regime at the mesopause/lower thermosphere heights.
As can be seen from Fig. 1 in the spring season (March±April in NH and September±October in SH) the eastward wind pattern, associated with the winter strato-mesosphere cyclone, becomes less pronounced and then disappears. This structure is gradually replaced by a structure with winds of the opposite sign (westward winds). During May this structure is transformed in two global structures, typical of summer season.
In the fall season (September±October in NH and March±April in SH) a process opposite to that in the spring season, is observed. In the upper mesosphere the eastward circulation structure, typical of the winter season, is primarily formed and then extended to the lower thermosphere.
In addition to these above considered structures, in the spring and fall seasons the intensive westward structures are well expressed at low latitudes, thus indicating the important role which the semiannual cycle plays at these latitudes.
4.2 Main parameters of the seasonal zonal wind variations
In this subsection we consider the spatial structure of annual mean zonal winds, and corresponding ampli-tudes and phases of annual and semiannual harmonics of seasonal zonal wind variations, which at 70±110 km make a 80±90% contribution to the integral variance of monthly mean wind values.
The height-latitude cross section of annual mean zonal wind in the upper mesosphere/lower thermosphere is presented in Fig. 3a. Some important features may be
Fig. 1a, b. Height versus latitude contour plots for monthly mean zonal wind (positive eastward). Contour spacing is 10 m/s. a January±June; b July±December
revealed in this contour plot. We note that the annual mean zonal wind is characterized by three main large-scale structures with a certain degree of symmetry about the equator: eastward jets with maxima of order 10 m/s at moderate and subtropical latitudes and westward regions at equatorial and tropical latitudes. Below the mesopause region at high latitudes two additional westward wind structures are discernible. The annual mean eastward jets ¯anking a predominantly westward ¯ow at the equatorial/tropical latitudes and a rather weak polar westward wind structures correspond closely to the well-known situation in the troposphere (Lorenz, 1976).
The contour plots of amplitudes and phases of the zonal wind annual variations are shown in Fig. 4 Clearly Fig. 4a shows that there are four regions of increased annual cycle amplitudes. Two of these regions (the most intensive) are situated at the mesospheric heights. Two less-pronounced but signi®cant regions are revealed at the lower thermospheric heights.
The structure of the amplitude's isolines in the mesospheric regions of increased amplitudes removes all doubts that these regions are the upper parts of well-known regions of increased annual harmonic amplitudes in the stratosphere and mesosphere (Holton, 1975). Additional support for this conclusion may be found when considering annual phase behaviour (Fig. 4b). At all heights of these regions the maximum positive (eastward) winds occur in December/January in NH and in May/June in SH, which correspond to dominance of the winter season cyclonic circulation, typical also of the stratospheric and mesospheric heights. In summer an anticyclonic circulation is characteristic of strato-meso-spheric layers, including the upper mesophere heights considered here.
In the lower thermosphere the zonal wind direction in the regions of increased amplitudes (Fig. 4) changes to the opposite one observed in the upper mesosphere, and the maximum of eastward winds occurs in the summer season (July±August in NH and December±January in SH). It means that the phase shift between the mesospheric and lower thermospheric annual wind oscillations in these regions is near to p for the corresponding seasons in both hemispheres. Along with the phases in NH are generally shifted at p relative to those in SH. It means that the nature of the mesospheric and lower thermospheric annual wind oscillations in NH and SH is similar. Naturally, there is no perfect symmetry between these oscillations in the two hemi-spheres. For example, in SH the annual cycle amplitudes in the thermospheric region exceed the corresponding values for NH by a factor of 1.5. Somewhat higher amplitude values, on average, are observed in the mesospheric region of SH, which in addition occupy a large space.
The height-latitude contour plots of amplitudes and phases of semiannual oscillation (SAO) of the zonal wind are shown in Fig. 5. The main features of this oscillation are as follows. The well-known region of increased SAO amplitudes is situated in the low-latitude zone. The isoline 10 m/s associated with this structure
limits this one by the latitudes 25±30°. The centre of maximum amplitudes in this region was not observed exactly at the equator but split into two, placed near 20° in both hemispheres at 80±85 km.
Additional information about this structure may be obtained from the contour plots of the SAO zonal wind phases. According to our model (see Fig. 5b) the earliest maximum west wind (eastward wind) appears at the equator at beginning of May (and beginning of Novem-ber) practically simultaneously at 85±95 km heights. The whole region of slowly changing phase, con®ned by the 5.5 (middle of May) isoline, is extended from about 30°N to 30°S, and is obviously related to the region of increased amplitudes of the zonal wind SAO. In the lower 80 km more rapid phase variations, which cor-respond to downward phase progression, are observed with average vertical gradients of about 1.5 month/ 10 km. Two other regions of increased amplitudes are observed at moderate and high latitudes in both hemispheres (Fig. 5a). The structure of these regions in NH and SH is not the same. The rather intensive zonal wind SAO is characteristic of the moderate latitudes of SH with maximum amplitudes of about 20 m/s in upper mesosphere at 75 km. The secondary maximum of increased amplitudes at these SH latitudes can be delineated in LT (10 m/s isoline con®ned this structure). It is dicult to conclude whether these two SH structures with increased SAO amplitudes are separate regions or parts of one extended region, but the phase behaviour in these regions (Fig. 5b) in the upper mesosphere is de®nitely dierent from that in LT.
The NH region of increased zonal wind SAO amplitudes is displaced toward higher latitudes in comparison with the corresponding SH region. The maximum amplitudes are limited by 15±17 m/s in the upper mesosphere and by slightly more than 5 m/s values in the lower thermosphere. The LT structure is not so de®nitely expressed as that in the SH. The character of phase variations in this region has certain similarities with those in the related region in SH. The position of the region with slowly varying phases (about 0.5±1.0) is observed at about 40±60°N, and the centre of increased amplitudes in LT is situated at the same latitudes. In SH the position of LT region of constant phases (isoline 6.0) also coincides with the LT region of increased amplitudes.
5 Global empirical meridional wind model 5.1 Monthly mean cross-sections
The monthly mean height-latitude contour plots of the prevailing meridional wind are shown in Fig. 2. Unlike the zonal winds the meridional wind structures in NH and SH for the same season are in general of opposite sign, in accordance with the change in sign of the Coriolis parameter, from one hemisphere to the other. Remembering this, it is more convenient to consider the meridional wind structures for separate months. In
November±January at low-latitude upper mesospheric heights there is a well pronounced and intensive meridional circulation cell with southward winds up to about 20 m/s in the centre of this cell. Two other systems of southward winds are also observed at middle and subtropical latitudes in the LT of both hemispheres. In SH the latter structure extends to high latitudes. Two systems with predominantly northward winds are found at middle-/high-latitude mesospheric heights. Above the mesopause these systems merge into one with the most intensive winds about 15 m/s occurring at SH tropical latitudes.
During February±April a gradual seasonal recon-struction of the meridional wind structures is obvious. Their winds change directions and new global circula-tion cells are formed. This process is practically over in May. During May±July the main meridional wind
structures are rather stable and repeated from month to month. In the LT a global northward wind structure dominates at most latitudes of the globe. However the strength of the wind in this structure in SH is much larger than that in NH. The centre of this structure is situated at middle SH latitudes above 100 km. Below the mesopause the southward wind structure prevails. The wind speed in this structure changes with latitude, month and height. However, in general the southward wind in the upper mesosphere during this season is the most intensive one in SH. In August±October we can reveal the wind behaviour, is typical of seasonal wind reversal process. However, even during this period a rather limited number of the clear global structures in both hemispheres are observed. It is also interesting to note that the most prominent meridional wind
struc-Fig. 3a, b. Height-latitude cross sections of the annual mean winds. a Zonal wind (contour spacing is 2.5 m/s); b meridional wind (contour spacing is 2.5 m/s)
Fig. 4a, b. Height versus latitude contours of the parameters of zonal wind annual variations: a amplitude (contour spacing is 5 m/s); b phase (time of maximum of eastward winds in month and, contour spacing is 1 month)
tures penetrate from the lower thermosphere to the upper mesosphere and vice versa, thus con®rming the possibility of dynamical coupling between the dierent atmospheric layers.
5.2 Main parameters of meridional wind seasonal variations
The existence of a signi®cant climatic annual mean circulation system in the MLT region is the most important output of our prevailing meridional wind model. The height-latitudinal contour plot of the annual mean meridional wind is shown in Fig. 3b. The whole picture is rather simple. If we neglect some details in this plot, which are de®nitely non-zonally symmetric, we may separate four global structures of ageostrophic annual mean meridional wind. Two of them observed at the upper mesosphere and mesopause heights and are
characterized by northward winds in the NH and southward winds in the SH. Another two structures with opposite wind directions in relation to the under-lying structures are typical of the LT region. It is clearly seen that the meridional wind in SH is more intensive than in NH, which is the indication of a certain asymmetry between the two hemispheres. It is consistent with the stronger vertical shear of zonal mean winds in SH rather than that in NH. The localization of these four structures implies that on a global scale at 70±110 km height there are a few meridional cells each with com-bined meridional and vertical ¯ows. To maintain these circulation cells the annual mean momentum ¯ux in this region must be signi®cant (Portnyagin et al., 1995).
Height-latitude cross sections of amplitudes and phases of the meridional wind annual oscillations (AO) are shown in Fig. 6. We can see from this that in
Fig. 5a, b. Same as Fig. 4, except for semi-annual variation
Fig. 6a, b. Same as Fig. 4, except for meridional wind. a Amplitude (contour spacing is 2.5 m/s); b phase (time of maximum of northward wind, contour spacing is 1 month)
the SH these oscillations are signi®cantly stronger in comparison with those in the NH and the height-latitude structure of amplitudes is more pronounced in the SH. We can delineate three main regions of increased amplitudes for the SH. The ®rst of them is observed in the upper mesosphere at moderate and high latitudes. The centre of the second region, where the amplitudes approach about 13 m/s, is placed at the mesopause heights in the subtropical and tropical latitudinal interval. However, the analysis of the phase distribution (Fig. 6b) shows that in both regions discussed the time of maximum of northward wind corresponds to the summer season in the SH and the phases do not basically change with height. Hence, these regions may not be separate regions, but the merged regions of a common origin. The height behaviour of phases in the low-latitudinal part of this region shows that this region extends to LT heights. The third region is observed in LT at moderate and high latitudes. The phases of AO in this region vary between 5 and 6 months and dier by 6 months from those in the adjoining regions of increased amplitudes. The amplitudes and phases of isoline structures for this region indicate that it is the lower part of a more extensive thermospheric structure.
In the NH the structures mentioned are not so well pronounced as in SH, but some tendency for amplitude to increase in similar height-latitudinal regions, espe-cially at low latitudes, is observed. The AO phases in NH regions do not dier from those in the correspond-ing SH regions. This means that the maximum positive (northward) meridional winds, stipulated by the annual cycle, in NH occur in the seasons which are opposite to those in the SH (e.g. summer versus winter). The meridional wind SAO is signi®cantly less than those of AO and their spatial structure are not so well de®ned, so they are not discussed here.
6 Discussion (validation of GEWM)
In this section we consider the problem of reliability of the GEWM and to compare it with space-based models. To give an impression of correspondence of the model data to the actual experimental data at the most representative height of about 95 km, as well as to the WINDII model, in Fig. 7 the seasonal course of zonal wind for some particular latitudinal belts is presented. From this ®gure it may be seen that, in spite of the dierent averaging procedures over latitudes, longi-tudes, years and heights, used when constructing of the GEWM, the model's wind seasonal behaviour is on the whole well matched with experimental results. From this comparison it may be concluded that the GEWM actually describes the most signi®cant features in the upper mesosphere/lower thermosphere global circula-tion structures which may be revealed by ground-based observational techniques. However, the ®ne structure of the height-latitudinal cross sections in the GEWM discussed results from the best ®tting of the model to the available experimental data. Therefore, it is obvious that the details of the revealed global structures are not
completely zonally symmetric as well as not repeated from year to year. The accuracy of model wind values is not similar everywhere and is also dependent on the amount of data for a particular latitudinal belt. On average, however, we have estimated that the actual positions of the isolines may vary within the limits of 5±7 m/s (at the con®dence level of about 67%).
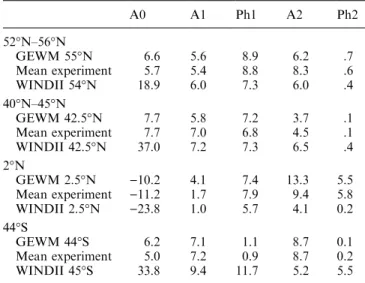
It is very important to verify the model by comparing it with space-based models. A comprehensive compar-ison of our wind model with that constructed by using the UARS (WINDII) wind data was made by Portnya-gin et al. (1998) for zonal prevailing wind, and by Fauliot et al. (1997) for the meridional prevailing wind. Comparison between the zonal winds retrieved from the models has revealed a general consistency, in particular, almost the same annual and semi-annual variation components in global scale wind structures. However, systematic bias exists in the annual mean zonal wind. Table 2 illustrates this bias (see, also, Fig. 6 in Portnya-gin et al., 1998).
It can be concluded from Table 2, from Fig. 7 and from Fig. 6 in Portnyagin et al. (1998) that a good agreement between the models could be obtained, provided that the WINDII annual mean zonal wind values were reduced by a term of Acos 4x, where A is about 20 m/s for all heights and x is colatitude. This signi®cant regular oset, varying with latitude but independent of altitudes, is unlikely to be associated with model representation and/or inter-annual/longitu-dinal variability of the observational data sets. By comparing the global structure of this oset with Fig. 3a, we may see that the annual mean wind itself also shows a similar A¢cos 4x dependence, where A¢ is the amplitude of the annual means and is larger than A by a factor of 2 to 2.5. The amplitude is likely to be independent of height when some ®ne structures are neglected. This implies that the osets between the annual means of WINDII and GEWM can also be described by a constant factor of about 2 everywhere in the regions considered, independent of both height and latitude. For space-based wind instruments, the correc-tion to account for the rotacorrec-tion of the Earth, dependent on viewing direction and latitude, would lead to such large variable wind errors, if the absolute calibration of the line shift to Doppler velocity factor was incorrect (Portnyagin et al., 1998). This is most likely the possible origin of the observed dierences between ground-based and space-based MLT zonal winds. The comparison between our previous version of the ground-based meridional wind model (our new updated GEWM retains all global features of this previous version) and a space-based meridional wind model, which were constructed using the WINDII MLT wind data set, was made by Fauliot et al. (1997). They concluded that the global structures in the annual mean meridional wind, as well as for the particular months, which may be revealed in the both models, are very close in terms of wind velocity, cell distribution and wind magnitude. Fauliot et al. (1997) wrote: ``Even if our results exhibit some dierences in term of the position of wind cells when compared to the empirical models described by these
authors (our ground-based wind models, Y.P., T.V.S.), these dierences are weak enough to con®rm their conclusions''. It is important to emphasise that for the ground-based and spaced-based meridional wind mod-els discussed a signi®cant bias even between the annual mean values has not been found (contrary to that for zonal wind). This result may be considered as an additional support to our supposition that an uncer-tainty in the correction to account for the rotation of the Earth may cause the observed dierences between ground-based and space-based zonal wind models. 7 Conclusions
We have presented here a 2-D climatic global prevailing-wind model for the upper mesosphere/lower thermo-sphere region, based on the analysis of multi-year ground-based wind measurement results at more than 40 stations, well distributed over the globe. This model is constructed for all months of the year, thus permitting us to investigate the main regularities of seasonal transformation of zonal and meridional wind patterns in the Northern and in the Southern Hemispheres. Analysis of height-latitude plots of monthly mean wind values for 70±110 km heights showed that for each
season several global wind structures were characteris-tic. A de®nite similarity in these structures for the NH and SH are observed, but there is no complete mirror symmetry between both hemispheres. Usually in the SH the winds are more intensive than those in the NH and the spatial position and extension of the main circula-tion structures in NH and SH do not completely coincide. In the upper mesosphere/lower thermosphere annual and semiannual harmonics of seasonal wind velocity variations make a 80±90% contribution to the total variance of monthly mean velocity values stipulated by their seasonal course. However, the annual mean wind component, which does not reproduce in most numerical models, is also signi®cant. Some results of comparison of the GEWM presented with space-based wind models are made. This comparison exhibits general agreement in the global prevailing wind structures, if a systematical bias term of Acos 4x was subtracted from the space-based zonal wind data.
Acknowlegements. The authors are grateful to Drs. and Profs. J. M. Forbes, G. Shepherd, D. Wang, T. Tsuda, T. Nakamura, D. Fritts, J. Isler, R. Vincent, A. H. Manson, S. Avery, G. Fraser, F. Vial, D. Pancheva, M. Burrage, G. Beard, N. Mithchell, Ch. Jacobi, W. Singer, A. Fachrutdinova and B. Kascheev for their courtesy in supplying the authors with wind measurement data in a computer readable form and for their constant attention to the work. The authors also thank Dr. D. Wang for helpful and encouraging discussions. This research was partly supported by INTAS under contract 96-1669.
Topical Editor F. Vial thanks S. Miyahara and another referee for their help in evaluating this paper.
References
Avery, S. K., R. L. Obert, and J. P. Avery, Observations of equatorial mesospheric mean winds and tides, Handbook for MAP, 28, 64±67, 1989.
Babadjanov, P. B., B. L. Kascheev, V. A. Nechitailenko and V. V. Fedynsky, Meteor radar study of the upper atmosphere circula-tion, ``Donisch'', Dushanbe, 1974.
CIRA-72, COSPAR International Reference Atmosphere, A. Verlag Akademisches Berlin, 1972.
Devara, P. C. S., M. I. Achmed., M. S. Rao, and B. R. Rao, Neutral wind measurements over Waltair using meteor wind radar, J. Atmos. Terr. Phys., 43, 239±242, 1981.
Fakchrutdinova, A. N., Height-temporal structure of the lower thermosphere neutral and the eects of their interaction with ionospheric phenomena, Doctor of Science Thesis, Kazan, 1991 (unpublished) (in Russian)
Fauliot, V., G. Thuillier and F. Vial, Mean vertical wind in the mesosphere-lower thermosphere region (80±120 km) deduced from the WINDII observations on board UARS, Ann Geo-physicae, 15(9), 1221±1231, 1997.
Fleming, E. L., S. Chandra, M. R. Shoeberl, and J. J. Barnett, Monthly mean global climatology of temperature, wind, geopo-tential height and pressure for 0±120 km, NASA Technical Memorandum 100697, 1988.
Fleming, E. L., S. Chandra, M. D. Burrage, W. R. Skinner, P. B. Hays, B. H. Solheim, and G. G. Shepherd, Climatological mean wind observations from UARS HRDI and WINDII: compar-ison with current reference models, J. Geophys. Res., 101, 10 455±10 473, 1996.
Franke, S. J., and D. Thorsen, Mean winda and tides in the upper middle atmosphere at Urbana (40°N, 88°W) during 1991-1992, J. Geophys. Res., 98, 607±615, 1993.
Table 2. Zonal prevailing wind, seasonal course components 95 km A0 A1 Ph1 A2 Ph2 52°N±56°N GEWM 55°N 6.6 5.6 8.9 6.2 .7 Mean experiment 5.7 5.4 8.8 8.3 .6 WINDII 54°N 18.9 6.0 7.3 6.0 .4 40°N±45°N GEWM 42.5°N 7.7 5.8 7.2 3.7 .1 Mean experiment 7.7 7.0 6.8 4.5 .1 WINDII 42.5°N 37.0 7.2 7.3 6.5 .4 2°N GEWM 2.5°N )10.2 4.1 7.4 13.3 5.5 Mean experiment )11.2 1.7 7.9 9.4 5.8 WINDII 2.5°N )23.8 1.0 5.7 4.1 0.2 44°S GEWM 44°S 6.2 7.1 1.1 8.7 0.1 Mean experiment 5.0 7.2 0.9 8.7 0.2 WINDII 45°S 33.8 9.4 11.7 5.2 5.5 A0: annual mean wind (m/s)
A1: amplitude of annual harmonic (m/s)
Ph1: phase of annual harmonic (month of maximum) A2: amplitude of semiannual harmonic (m/s)
Ph2: phase of semiannual harmonic (month of maximum) Fig. 7a±h. Seasonal variations of zonal wind at 95 km for particular latitudinal belts: a 52±56°N; b 40±45°N; c 34±38°N; d 18±22°N; e 2°N; f 6°S; g 33±35°S; h 44°S. (±d± GEWM, ±n± WINDII, ±u± mean experimental data, see Table 1): a Kazan, Obninsk, Kuhlungsborn, Jodrell Bank, Saskatoon; b Monpazier, Durham, Frunze, Jambol, Urbana; c Dushanbe, Ashkhabad, Kyoto, Altanta; d Kauai, Punta Borinquen, Waltair, Jamaica, Ramey; e Christmas Island, Moga-dishu; f Jakarta; g Grahamstown, Adelaide; h Christchurch b
Fritts, D. C., and J. R. Isler, Mean motions and tidal and two-day structure and variability in the mesophere and lower thermo-sphere over Hawaii, J. Atmos. Sci., 51, 2145±2164, 1994. Greenhow, J. S., and E. L. Neufeld, Winds in the upper atmosphere,
Q. J. R. Meteorol Soc., 87, 472±489, 1961.
Groves, G. V., Seasonal and latitudinal model of atmospheric structure between 30 and 120 km altitude, J. British Interplanet. Soc., 22, 285±307, 1969.
Hedin, A. E., M. A. Biondi, R. G. Burnside, G. Hernandez, R. M. Johnson, T. L. Killeen, C. Mazaudier, J. W. Meriwether, J. E. Salah, R. J. Sica, R. W. Smith, N. W. Spencer, V. B. Wickwar and T. S. Virdi, Revised global model of thermosphere winds using satellite and ground-based observations, J. Geophys. Res., 96, 7657±7688, 1991.
Hedin, A. E., E. L. Flemming, A. H. Manson, F. J. Schmidlin, S. K. Avery, R. R. Clark, S. J. Franke, G. J. Fraser, T. Tsuda, F. Vial, and R. A. Vincent, Empirical wind model for the middle and lower atmosphere, J. Atmos. Terr. Phys., 58, 1421±1447, 1996. HHI Geophys. Data, Meteor Winds Suppl, 28, 1977.
HHI Geophys. Data, Meteor Winds Suppl, 29, 1978. HHI Geophys. Data, Meteor Winds Suppl, 30, 1979. HHI Geophys. Data, Meteor Winds Suppl, 31, 1980.
Holton, J. R., The dynamic meteorology of syratosphere and mesosphere. Meteorol. Monogr. 37, American Meteorological Society, 218 pp., 1975.
Hook, J. L., Winds at the 75±105 km level at College, Alaska, Planet. Space Sci., 18, 1623±1638, 1970.
Kalchenko, B. V., Variations of prevailing, diurnal and semidiurnal components of wind velocity at 80±105 km heights. Meteor Researches N13, Moscow, 34±42, 1987 (in Russian).
Karimov, K. A., Dynamical characteristics of the lower thermosphere and their coupling with the mesosphere/stratosphere processes over Middle Asia region, ``Ilim'', Frunze, 1984.
Kascheev, B. L., V. A. Nechitailenko, A. N. Oleinikov, and V. A. Shevchuk, Long-term variability of the vertical pro®les of wind velocities in 80±100 km height region, in ``Global Meteor Observation System'' (results of observations), Soviet Geophys. Com., Moscow, 5±15, 1988.
Lorenz, E. N., The nature and theory of the general circulation of the atmosphere, World Meteorological Organization, 260 pp., 1967. Lysenko, I. A., B. L. Kascheev, M. K. Nazarenko, R. P. Chebotarev, A. D. Orlyansky and E. I. Fialko, The results of investigations of atmosphere circulation over Euroasia and Arctic by meteor radar method, Proc. Acad. Sci. USSR, Ser. ``Phys. Atmos. and Ocean'', 5, 893±902, 1969.
Lysenko, I. A., P. P. Michailik, B. I. Petrov, C. V. Sapsov, and P. C. Manev, Wind measurements by meteor radar method in BPR, Bulgarian Geophys. J., 14, 34±47, 1988.
Lysenko, I. A., Y. I. Portnyagin, A. N. Fahrutdinova, R. A. Ishmuratov, A. H. Manson, and C. E. Meek, Wind regime at 80± 110 km at mid-latitues of the Northern Hemisphere, J. Atmos. Terr. Phys., 56(1), 31±42, 1994.
Makarov, N. A., Main regularities of wind regime in the atmospheric meteor zone over Far East region from meteor radar measurement results, in Investigations of dynamical processes in the upper atmosphere, Moscow, Hydrometeoizdat, 8±13, 1988.
Malinga, S. B., and L. M. G. Poole, Atmospheric tides observed at Grahamstown (33.3°S, 26.5°E), J. Atmos. Sol. Terr. Phys., 59, 2037±2050, 1997.
Manson, A. H., C. E. Meek, M. Massebeuf, J.-L. Fellous, W. G. Elford, R. A. Vincent, R. L. Craig, R. G. Roper, S. Avery, B. B. Balsley, G. J. Fraser, M. J. Smith, R. R. Clark, S. Kato, T. Tsuda and A. Ebel, Mean winds of the upper middle atmosphere (60±110 km): a global distribution from radar systems (MF, meteor, VHF), Handbook for MAP, 16, 239± 268, 1985.
Manson, A. H., C. E. Meek, E. Flemming, S. Chandra, R. A. Vincent, A. Phillips, S. K. Avery, G. J. Fraser, M. J. Smith, J. L. Fellous, and M. Massebeuf, Comparison between
satellite-derived gradient winds and radar-satellite-derived winds from CIRA-86, J. Atmos. Sci., 48, 411±428, 1991.
Manson, A. H., C. E. Meek, M. Massebeuf, J.-L. Fellous, W. G. Elford, R. A. Vincent, R. L. Craig, R. G. Roper, S. Avery, B. B. Balsley, G. J. Fraser, M. J. Smith, R. R. Clark, S. Kato, T. Tsuda, Mean wind of the upper middle atmosphere (70± 110 km) from the global radar network: comparison with CIRA-72, and new rocket and satellite data, Adv. Space Res., 7, 143±153, 1987.
Nastrom, G. D., B. B. Balsley and D. A. Carter, Mean meridional wind in the mid- and high-latitude summer mesosphere, Geophys. Res. Lett., 9, 139±307, 1982.
Nazarenko, M. K., Regular motions in the meteor zone from meteor radar observations in Tomsk in 1969, in Comets and Meteors, ``Donish'', Dushbane, 15±22, 1968.
Ovezgeldyev, O. G., Y. Karadjaev, L. P. Korsunova, I. A. Lysenko and B. I. Petrov, Some features of the lower thermosphere wind regime over Ashkhabad from meteor radar measurement data, J. Meteorol and Hydrol 19, 51±57, 1991.
Palo, S. E., Y. I. Portnyagin, J. M. Forbes, N. A. Makarov and E. G. Merzlyakov, Transient eastward-propagating long-period waves observed over South pole, Ann. Geophysicae 16, 1486± 1500, 1998.
Petruchin, V. F., Lower thermosphere wind regime over East Siberia, PhD. Thesis, Irkutsk, 1983 (unpublished) (in Russian) Portnyagin, Y. I., Basic features of global circulation in the
mesopause-lower thermosphere region, Handbook for MAP, 10, 134±142, 1984.
Portnyagin, Y. I., The climatic wind regime in the lower thermo-sphere from meteor radar measurements, J. Atmos. Terr. Phys., 48, 1099±1109, 1986.
Portnyagin, Y. I., An empirical model of the zonal circulation at the 70±110 km, J. Meteorol Hydrol., 4, 6±14, 1987.
Portnyagin, Y. I., and T. V. Solovjova, An empirical model of the meridional wind in the mesopause/lower thermosphere, Part 1, a monthly mean empirical model, J. Meteorol Hydrol., 10, 28± 35, 1992.
Portnyagin, Y. I., K. Sprenger, I. A. Lysenko, R. Schminder, A. D. Orlyansky, K. M. Greisiger, Y. D. Iijichev, R. Kurschner, and B. Schening, Wind measurements at 90±100 km heights by ground-based methods, Hydrometeoizdat, Leningrad, 1978. (in Russian).
Portnyagin, Y. I., J. M. Forbes, G. J. Fraser, R. A. Vincent, S. K. Avery, I. A. Lysenko, and N. A. Makarov, Dynamics of the Antarctic and Arctic mesosphere and lower thermosphere regions ± I. The prevailing wind, J. Atmos. Terr. Phys., 55, 827±841, 1993.
Portnyagin, Y. I., J. M. Forbes, T. V. Solovjova, S. Miyahara, and C. DeLuca, Momentum and heat sources of the mesosphere and lower thermosphere regions 70±110 km, J. Atmos. Terr. Phys., 57, 967±977, 1995.
Portnyagin, Y. I., T. V. Solovjova, and D. Y. Wang, Some results of comparison between the lower thermosphere winds as seen by the ground-based and space-based methods, Submitted to Earth, Planets and Space, 1998.
Roper, R. G., Meteor wind results from Atlanta, U.S.A. and Ramey, Puerto Rico, Handbook for MAP, 10, 127±133, 1984. Schminder, R., and D. Kurschner, Mean winds and tides in the 85 to
110 km region over Central Europe in 1983±1986. J. Geophys. Res., D93, 2493±2497, 1988.
Schminder, R., W. Singer, D. Kurschner, P. Homann, and D. Keuer, Permanent monitoring of the upper atmosphere wind ®eld over Central Europe by a joint analysis of LF windpro®ler and MF radar measurements at Collm and Juliusruh (Germa-ny), Meteorol. Z., N.F.3, H.5, 297±300, 1994.
Schole®eld, A. J., and H. Alleyne, Low latitude meteor wind observations, J. Atmos. Terr. Phys., 37, 273±286, 1975. Sidorov, V. V., A. N. Fakchrutdinova, V. A. Makarov, R. A.
Ishmuratov, and A. A. Umjarov, Height and seasonal regularities of prevailing and tidal motions from measurements in Kazan,
in Global Meteor Observation System (results of observations), Soviet Geophys. Com., Moscow, 32±37, 1988.
Singer, W. P. Homann, A. H. Manson, C. E. Meek, R. Schminder, D. Kurschner, G. A. Kokin, A. K. Knyazev, Y. I. Portnyagin, N. A. Makarov, A. N. Fakhrutdinova, V. V. Sidorov, G. Cevolani, H. G. Muller, E. S. Kasimirovsky, V. A. Gaidukov, R. R. Clark, R. P. Chebotarev, and Y. Karadjaev, The wind regime of the mesosphere and lower thermosphere during the DYANA campaign ± I. Prevailing winds, J. Atmos. Terr. Phys., 56, 1717±1729, 1994.
Tsuda, T., A preliminary report on observations of equatorial atmosphere dynamics in Indonesia with radar and radiosondes, J. Meteorol. Soc. Jpn, 73, 393±406, 1995.
Vincent, R. A., Long-period motions in the equatorial mesosphere, J. Atmos. Terr. Phys., 55, 1067±1080, 1993.
Wang, D. Y., C. McLandress, E. L. Flemming, W. E. Ward, B. Solheim, and G. G. Shepherd, Empirical model of 90±120 km horizontal winds from wind-imaging interferometer green line measurements in 1992±1993, J. Geophys. Res., 102, D6, 6729± 6745, 1997