HAL Id: hal-01593593
https://hal.sorbonne-universite.fr/hal-01593593
Submitted on 26 Sep 2017
HAL is a multi-disciplinary open access
archive for the deposit and dissemination of
sci-entific research documents, whether they are
pub-lished or not. The documents may come from
teaching and research institutions in France or
abroad, or from public or private research centers.
L’archive ouverte pluridisciplinaire HAL, est
destinée au dépôt et à la diffusion de documents
scientifiques de niveau recherche, publiés ou non,
émanant des établissements d’enseignement et de
recherche français ou étrangers, des laboratoires
publics ou privés.
Distributed under a Creative Commons Attribution| 4.0 International License
control of embryonic stem cell differentiation
Vicard Du, Nathalie Luciani, Sophie Richard, Gaëtan Mary, Cyprien Gay,
François Mazuel, Myriam Reffay, Philippe Menasche, Onnik Agbulut, Claire
Wilhelm
To cite this version:
Vicard Du, Nathalie Luciani, Sophie Richard, Gaëtan Mary, Cyprien Gay, et al.. A 3D magnetic
tissue stretcher for remote mechanical control of embryonic stem cell differentiation. Nature
Commu-nications, Nature Publishing Group, 2017, 8, pp.400. �10.1038/s41467-017-00543-2�. �hal-01593593�
A 3D magnetic tissue stretcher for remote
mechanical control of embryonic stem cell
differentiation
Vicard Du
1
, Nathalie Luciani
1
, Sophie Richard
1
, Gaëtan Mary
1
, Cyprien Gay
1
, François Mazuel
1
, Myriam Reffay
1
,
Philippe Menasché
2
, Onnik Agbulut
3
& Claire Wilhelm
1
The ability to create a 3D tissue structure from individual cells and then to stimulate it at will
is a major goal for both the biophysics and regenerative medicine communities. Here we
show an integrated set of magnetic techniques that meet this challenge using embryonic
stem cells (ESCs). We assessed the impact of magnetic nanoparticles internalization on ESCs
viability, proliferation, pluripotency and differentiation pro
files. We developed magnetic
attractors capable of aggregating the cells remotely into a 3D embryoid body. This magnetic
approach to embryoid body formation has no discernible impact on ESC differentiation
pathways, as compared to the hanging drop method. It is also the base of the
final magnetic
device, composed of opposing magnetic attractors in order to form embryoid bodies in situ,
then stretch them, and mechanically stimulate them at will. These stretched and cyclic purely
mechanical stimulations were suf
ficient to drive ESCs differentiation towards the mesodermal
cardiac pathway.
DOI: 10.1038/s41467-017-00543-2
OPEN
1Laboratoire Matière et Systèmes Complexes (MSC), UMR 7057, CNRS and Université Paris Diderot, 75205 Paris Cedex 13, France.2Department of
Cardiovascular Surgery, Hôpital Européen Georges Pompidou; Paris Cardiovascular Research Center, INSERM U970, Université Paris Descartes, Paris 75015, France.3Sorbonne Universités, UPMC Univ Paris 06, Institut de Biologie Paris-Seine (IBPS), UMR CNRS 8256, Biological Adaptation and Ageing, 75005
R
esearch in regenerative medicine has advanced rapidly over
the past decade thanks to the development of multiple tools
(e.g., 3D printing and 3D culture, controlled forces and
microenvironments, cell differentiation and reprogramming)
1–4.
Stem cells and their unique potential for differentiation lie at the
heart of this emerging
field.
In particular, a growing number of studies have evidenced that
mechanical factors can influence stem cell differentiation
5.
This idea of a physical guidance of differentiation emerged from
studies using adult mesenchymal stem cells, and was then tested
on pluripotent/embryonic stem cells. Most techniques applied
on two-dimensional (2D) cell cultures, focusing in particular on
the role of microenvironmental mechanical cues such as substrate
rigidity
6–11,
flow-induced shear stress
12–14, strains imposed on
cell monolayers by the stretching of deformable supporting
membranes
15–17, or local forces applied on beads attached to the
cell surface
18,19.
Multicellular three-dimensional (3D) approaches have also
received an increasing interest for studying stem cell behavior
beyond the classical 2D culture conditions. First, scaffold-based
constructions not only allow to stimulate mechanically the
seeded stem cells
20, 21, but also provide precise 3D control of
extracellular matrix cues
22, 23. Second, scaffold-free magnetic
or printing technologies make it possible to control spatial
patterning of aggregates
24or to create multilayer structures
25.
One current challenge is now to provide other methodologies
to assemble and organize stem cells (only) into a 3D tissue
structure that can be stimulated at will, in order to explore the
physical differentiation approaches in 3D purely cellular tissues.
To create a 3D cell assembly, one needs to enable remote
spatial organization of component cells. Magnetic cellular forces
acting at a distance are appealing candidates for this application,
provided the individual cells are
first magnetized by the
internalization of magnetic nanoparticles. Magnetic nanoparticles
in
regenerative
medicine
are
mostly
used
either
for
noninvasive in vivo tracking of stem cells by magnetic resonance
imaging
26–29, or for magnetic cell targeting to sites of tissue
damage
21,30–32. The idea of using magnetic cell manipulation for
tissue engineering is more recent, and the
first works featured
bioprinting and cell sheet engineering, by magnetically creating or
manipulating spheroids
33–35or organizing layers of several cell
types
36,37, respectively. To use magnetic forces not only to form
tissues, but also to remotely stimulate them, is still to be
unraveled.
Incorporating nanoparticles to magnetize and stimulate cells
raises several issues. The
first is the impact of nanoparticle
internalization on the cell phenotype, and particularly
differ-entiation capacity. Previous studies
31, 38of mesenchymal stem
cells have shown that magnetic nanoparticles generally do not
inhibit their differentiation, except for chondrogenesis in some
cases
39, in particular at high iron doses
40. Besides, magnetic
nanoparticles can also be beneficial to mesenchymal stem cells
differentiation, e.g., for myocardial repair
41,42. Only few studies
have investigated the impact of magnetic nanoparticles on
embryonic stem cells (ESCs). One reported that
cardiomyogen-esis was unaffected
43, another that the self-renewal ability or
surface phenotypic markers expressed after forced differentiation
into hematopoietic cells were unchanged
44. To the best of our
knowledge, the impact of magnetic nanoparticles on the whole
ESC differentiation profile, with no biochemical triggers, is still
unknown.
ESC differentiation is initiated within an embryoid body (EB),
generally created with the hanging drop method. A second
important question is thus whether 3D magnetic printing of ESCs
could be equivalent to this method and what would be its
impact on the differentiation profile after cell maturation. The
ultimate and most challenging question is whether magnetic
forces alone could drive stem cells differentiation within a
magnetically formed 3D model tissue.
Here we address all three issues by using magnetized ESCs to
create an EB and remote magnetic forces to stimulate it (Fig.
1).
We
first carefully analyzed iron oxide nanoparticle internalization
by ESCs, and its impact on their viability, pluripotency and
differentiation. Second a magnetic attraction method was
devel-oped to create EBs, and its impact on the ESC differentiation
profile was evaluated. We then designed an all-in-one magnetic
stretcher capable of both creating and stimulating the EB and
evidenced the impact of purely mechanical stimulation on EB
differentiation.
Results
ESCs magnetic labeling, viability and pluripotency. The
first
step was to incorporate magnetic nanoparticles within ESCs.
Magnetophoretic measurements
40of the iron load per cell
(Fig.
2a) yielded uptake curves (in terms of pg of iron per cell)
that saturated as a function of both the extracellular iron
con-centration [Fe] and the incubation time. Thus, by setting the
incubation time to 30 min, a saturation value of 3.3
± 0.5 pg was
obtained with [Fe]
= 2 mM. When the concentration was set at
[Fe]
= 2 mM, a saturation value of 6.6 ± 0.5 pg was obtained after
2–4 h. Nanoparticle uptake can be directly imaged with Perls’
Prussian blue staining (Fig.
2b and Supplementary Fig.
1
for other
views). Observation of cell colonies showed that the stronger
the labeling, the more intense the blue color, up to saturation,
correlating well with the magnetophoretic measurements. Finally,
transmission electron microscopy of labeled cells showed that
the nanoparticles were all internalized and localized within
lysosomes; no nanoparticles were observed outside the cells
(see Fig.
2c and Supplementary Fig.
2
for other views).
Because ESCs are particularly sensitive to perturbations, the
possibility that nanoparticles might impact their viability and
proliferation had to be
first considered. To test the viability, ESCs
metabolic activity was measured after magnetic labeling in
different conditions (iron masses between 1.8 and 6.6 pg per
cell). It is important to note that the cells must be incubated in
RPMI medium with 5 mM citrate to prevent nanoparticle
aggregation before cell internalization. It is therefore also
necessary to quantify the impact of citrate itself on cell viability.
Figure
2d shows cell viability for all the conditions tested, as
compared to the control (unlabeled cells in culture medium). The
short labeling period of 30 min had no impact at 0.5 or 2 mM
extracellular iron, but a slight effect (about
−10%) was noted at
5 mM iron. Upon increasing the labeling period, viability fell at all
Magneticmicrotip
Magnetic microtip
a
b
c
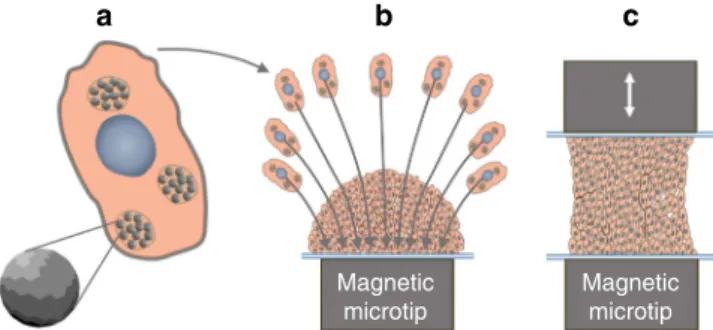
Fig. 1 Schematic illustrating the different steps involved in the magnetic stretcher.a Nanoparticles incorporation in ESCs, b EBs formation from magnetized ESCs driven by a magnetic microtip, andc EBs magnetic stimulation in situ, in the 3D geometry, and without the need for a supporting matrix
iron concentrations. However, the viability of the cells incubated
with citrate alone was modified in the same way as during
magnetic labeling. Citrate alone thus impacted cell viability,
whereas the nanoparticles had only a slight impact on viability at
high iron concentrations. Cell viability was also examined on the
long-term, over 9 days after labeling for the 30 min incubation
condition (3 pg per cell), and no impact was observed on the cells’
viability and ability to replicate compared to control cells
(Supplementary Fig.
3).
The next step was to analyze the impact of magnetic labeling
on ESC pluripotency. The
first indicator of ESC pluripotency is
their morphology; undifferentiated cells form round colonies.
As shown in Supplementary Fig.
4, ESC colonies remained
well-rounded after labeling under different conditions. Figure
2e
shows that the expression level of the key pluripotency genes
Oct 4, Nanog and Sox2 were unaffected by the internalization of
the nanoparticles, whatever the labeling condition, as compared
to the control (unlabeled cells). By contrast, the positive control
(culture without the leukemia inhibitor factor LIF, essential to
maintain pluripotency) suffered a significant decrease of these
genes at day 5. In view of these different results, the labeling
condition of 30 min at [Fe]
= 2 mM was chosen for subsequent
experiments, as it yielded an iron mass of 3 pg per cell without
affecting viability, proliferation, morphology and pluripotency.
Hereafter, the resulting ESCs are referred to as magnetized ESCs.
Impact of magnetic labeling on differentiation profile. The next
mandatory step was to retrieve the differentiation profile of EBs
formed with magnetized ESCs, and compare it with the one of
control EBs (unlabeled ESCs). We chose the standard hanging
drop EB formation method to initiate differentiation. This
method begins with the seeding of 1000 ESCs within a 30
µl drop,
which spontaneously assembles into an EB. Supplementary Fig.
5
shows images of EB formation with unlabeled control and
mag-netized ESCs. No difference in EB morphology was observed.
mRNA from control EBs and magnetized EBs were then collected
and analyzed on days 5 and 7. The expression levels (shown
in Fig.
2f) of Fn1, Lama1, Lamb1, Lamc1, Sox17 (endoderm
markers); T, Nkx2.5, Wt1 (mesoderm markers), Gata4, Gata6
(meso-endoderm markers); and Nes and Pax 6 (ectoderm
markers) were measured by real-time PCR. Importantly, the
obtained results showed no differences between control and
magnetized EBs, demonstrating that the temporal expression
pattern of the different genes was very similar.
Magnetic formation of EBs. Having established the optimal
conditions for ESC magnetic labeling, the next challenge was to
30 min incubation [Fe] = 2 mM 4 3 2 1 0 0 2 4 6 8 0 1 2 Concentration [Fe] (mM) [Fe] = 0 0.5 mM 30 min 100 Control 2 mM - 30 min 2 mM - 2 h 5 mM - 2 h w/o LIF (day 5)
*** ***
Gene expression (a.u.)
** * 10 1 0 Control ESCs 1000 100 10 1
Gene expression (/ day 0)
0.1 0.01
Fn1 Lama1 Lamb1 Lamc1 Sox17 Gata4 Gata6 T Nkx2.5 WT1 Nes Pax6
**
Magnetized ESCs day 5 Magnetized ESCs Ectoderm Mesoderm Endoderm mesoderm Parietal endoderm day 7 day 7 day 5 Control ESCs
Oct 4 Nanog Sox2
2 h 4 h *** *** *** *** *** ** * * 1 0.8 0.6 Cell viability (%) 0.4 0.2 0 RPMI RPMI + citrate 0.5 mM 2 mM 5 mM * 1 mM 2 mM – 30 min mFe per cell (pg) mFe per cell (pg) 3 4 5 0 1 2 Incubation time (hours)
3 4
a
b
c
d
e
f
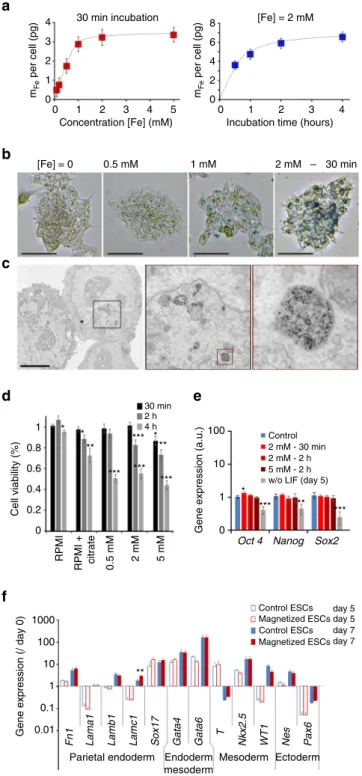
Fig. 2 Optimization of embryonic stem cell (ESC) magnetic labeling. a Magnetic labeling of ESCs at different extracellular iron concentrations (for afixed incubation time of 30 min) and during different incubation periods (for afixed iron concentration of [Fe] = 2 mM). b Perls’ Prussian blue staining of ESCs after labeling with different concentrations of extracellular iron (between 0.5 mM and 2 mM), and afixed incubation time of 30 min. Scale bar: 250µm. c Transmission electron micrograph of ESC after labeling for 30 min at [Fe]= 2 mM (successive zooms of framed areas). Scale bar: 5µm. Nanoparticles are all located inside the lysosomes. d Cell viability testing using Alamar Blue detection of cell metabolic activity. Cell viability was calculated relative to the control (unlabeled cells in complete medium) and was measured 2 h after different incubation periods (in RPMI) with different extracellular iron concentrations and incubation times.e Expression of pluripotency genes Oct4, Nanog and Sox2 measured by real-time PCR. The gene expression level was calculated with respect to RPLP0 mRNA and expressed as compared to control (unlabeled cells, cultured in complete medium with LIF,= 1 ± SEM). A positive control was added in which the LIF has been removed during 5 days before analysis (culture in complete medium without LIF). One can note that only one condition led to a significant upregulation (Oct4—incubation at 2 mM for 30 min). However the gene was upregulated<1.5-fold (1.3-fold exactly). Besides, higher doses (2 h incubation at 2 and 5 mM) provide the same Oct4 expression as the control.f Expression of several genes characteristic of the different embryonic layers in hanging drop EB formation conditions with 1000 unlabeled (control, blue bars) or labeled cells (magnetic, red bars), 5 days (open bars) and 7 days (solid bars) after initiation of differentiation. All values were calculated with respect to RPLP0 mRNA and normalized by the expression value of the same gene measured at day 0. Two-sample t-test was used to compare the control group with the magnetic group, for same gene and same day; *p< 0.05; **p < 0.01; ***p< 0.001. All error bars represent the SEM
create EBs magnetically, as an alternate method to hanging drop
or others. The idea was simple: nanoparticles contained in cells
confer a cellular magnetic moment M
cell(measured by
magne-tophoresis), which allows the cells to be attracted by a magnetic
force F
m= M
cellgradB. In order to use this force to confine cells
within a spheroid, gradB must be at submillimeter scales. To
achieve this, we developed submillimetric (750
µm diameter)
metal tips to channel the magnetic lines of an external
field (about
0.2 T), creating a strong
field gradient localized in space. Figure
3a
shows ESC attraction by one magnetic microtip, perfectly
matching the gradient map (Fig.
3b). The
field gradient is
500 T m
−1at 1 mm from the surface of the microtip (1000 T m
−1at 0.4 mm), equivalent to a force of about 100 pN (200 pN,
respectively) on an ESC containing 3 pg of iron.
Networks of these magnetic spikes were used to assemble
several EBs in the same dish (Supplementary Fig.
6
explains in
detail the fabrication of these magnetic devices). The microtips
were spaced a few millimeters apart in order to preserve the
localization of the
field gradient created by each microtip.
Magnetic formation of EBs was then straightforward
(Supple-mentary Fig.
7): on day 0, the cells were labeled, detached
and placed in a Petri dish (after non-adhesive treatment with
PLL-PEG), itself placed over the magnetic microtip array.
We tested 1000, 10,000 and 30,000 cells per microtip (and thus
per EB). Figure
3c shows EB formed from 30,000 cells, positioned
over a microtip, right after deposition. Figure
3d show the
spheroids thus obtained, one day after cell deposition (day 1).
Long-term intracellular fate of the nanoparticles in the EBs.
One essential question remains that of the fate of the
nano-particles once internalized within ESCs. Or alternatively, will the
EB stay magnetic over long-term culture conditions? To address
this issue, we monitored EBs’ magnetism (initially 10,000 cells) at
different times after EB formation, by magnetophoresis (Fig.
3e).
Briefly, it consists in tracking the EB magnetic mobility when
submitted to a homogeneous magnetic
field gradient created by a
permanent magnet. The magnetic velocity can then be directly
converted into the EB magnetic moment, or alternatively the
amount of nanoparticles (expressed in mass of iron) contained
within the EB. At day 1 after formation, each EB contains on
average 25 ng of iron, consistent with the initial iron load per
single ESC of about 3 pg. This amount progressively decreases
during EB growth, reaching about half its initial value at day 7.
This is due to the lysosomal degradation of the nanoparticles, as
recently evidenced in MSC spheroids
45,46. While the degradation
is beneficial for long-term ability of magnetically-labeled tissue to
get rid of the initial nanoparticles, the fact that at day 7, EBs still
retain half their magnetization is also beneficial for multiple
magnetic stimulations before tissue maturation.
Magnetic EB formation versus hanging drop. This system of
magnetic formation allows tight control of EB size, contrary to
the hanging drop method, which yields EBs of more variable size
and, in some cases, no EBs at all. Figure
4a shows the percent of
EB successfully formed, the EB average diameter and ellipticity,
for magnetic EB formation or hanging drop, starting from 1000
or 10,000 ESCs. Magnetic EB formation appears particularly
advantageous when starting from 10,000 cells, where the success
rate of formation increases from 73 to 91% when using magnetic
formation instead of the hanging drop approach, and EB
ellipticity decreases from 0.17 to 0.04. The size control is also
Grad B (T/m) 250 500 750 1000 1500 2000 Magnetic microtip Magnetic microtip 1000 cells Magnet FDRAG=FMAG Magnetic moment 0 1 2 3 4 Days
Day 1 Day 2 Day 4 Day 7 5 6 7 80 200 400 600 800 30 20 10 mFe per EB (ng) EB diameter ( µ m) 0 Velocity
10,000 cells 30,000 cells Day 1
c
a
b
d
e
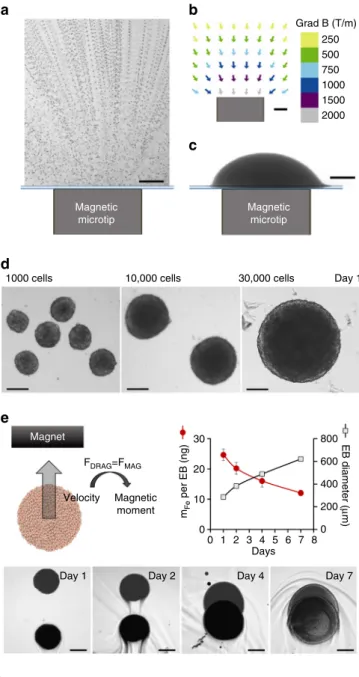
Fig. 3 Magnetic formation of embryoid bodies. a ESC attraction by a magnetic microtip (750µm in diameter). To visualize cell movement, the microtip was introduced into a chamber containing suspended cells under a microscope, and cell movements were video-monitored with a ×10 objective. Here 100 movie images were superimposed (0.1 s time intervals) in order to directly observe the trajectories of the cells migrating towards the magnetic microtip. At 1 mm from the microtip, the cells migrate at an average velocity of 300µm/s, which corresponds to an iron mass of 3 pg cell in a magneticfield gradient of 300 mT/mm. b The field gradient was mapped around the microtip by studying the migration of monodisperse magnetic beads with a calibrated diameter of 4.6µm (Dynal). At 1 mm from the microtip, it was 300 mT/mm. Scale bar: 200µm. c Final image of the aggregate obtained 1 min after seeding 30 000 ESCs over the magnetic microtip. Scale bar: 200µm. d Microscopic images of embryoid bodies (EBs) on day 1, obtained by seeding 1000, 10,000 and 30,000 cells per microtip. Scale bar: 200µm. e Monitoring of EBs magnetism over 7 days after nanoparticles cellular incorporation, and EB formation (day 0). It consists of tracking the EB magnetic migration towards a magnet, and measuring the corresponding velocity, which translates into the EB magnetic moment (proportional to the mass of iron per EB) by balancing the viscous drag and the magnetic force. Typical migrations are shown for the different times (days 1, 2, 4 and 7), corresponding to the superimposition of two images at 3 s interval. Scale bar: 200µm. The mass of iron (circles) and the EBs diameters (squares), averaged over eight different EBs, were then plotted as a function of time. Error bars represent the SEM
increased as demonstrated by a thinner distribution of EBs
sec-tional areas in case of magnetic formation (see Supplementary
Fig.
8). Finally, magnetic EB formation is almost instantaneous,
and the transfer step (drops to dishes on day 2) necessary for the
hanging drop method is avoided.
We then studied ESC differentiation under these magnetic
conditions of EB formation. As previously, differentiation is
initiated at day 0 of magnetic EBs formation by LIF removal from
culture medium. Figure
4b compares the magnetic formation
technique (magnet condition) to the hanging drop method, for
1000 and 10,000 cells deposited per EB, on day 5 and day 7 of
maturation. The expression level of most of the genes involved in
the three embryonic layers of the EBs formed magnetically was
unchanged compared to control EBs formed with the hanging
drop. Significant differences were observed in only 10 of the 48
conditions, and significant differences observed for one gene are
never spread to all conditions (from day 5 to day 7, or from 1000
cells to 10,000 cells).
Magnetic stretcher for in situ EB formation and stimulation.
ESCs thus retain a similar differentiation profile as obtained in
control condition, not only after incorporating magnetic
nano-particles, but also after magnetic formation of EBs. The concept of
the magnetic stretcher then becomes relevant: the EB should be
formed in the culture medium by the same magnetic microtip as
described above, then another magnetic microtip would be
approached to trap and deform (stretch/stimulate) it (Fig.
5a),
and only this mechanical stimulation step would be responsible
for any change in differentiation capacity.
The magnetic stretcher (Fig.
5a and Supplementary Fig.
9)
combines
fixed and mobile microtips for stretching and
stimulation, in a perfectly sterile setup. With dimensions
(20 × 40 × 20 cm), it
fits easily inside an incubator, to maintain
the EBs temperature at 37 °C, with 5% CO
2. It was also designed
to be placed directly on a microscope stage, thermalized at 37 °C,
without compromising sterility. The magnetic microtips are
inserted in machined structures closed by glass slides 100
μm
thick to prevent contact between the metal and the culture
medium, while allowing them to be very close to the cells.
Removable cylindrical magnets are used to magnetize the
microtips. The device allows three EBs to be formed and
stimulated at the same time, and medium reservoirs
(commu-nicating with the rest of the setup) are placed between the
microtips to ensure nutrient distribution to the EBs. A
micrometric motor (Thorlabs, controller interfaced with Labview)
ensures the normal motion of one of the structures carrying the
magnetic devices (microtips and magnets), while two micrometric
displacements ensure alignment along the other two axes.
The EBs are initially formed from 10,000 cells on the
fixed
magnetic structure (Fig.
5b). These EBs correspond to the magnet
condition, similar to the one shown in Fig.
3c, which were found
to be identical in terms of differentiation profile to EBs formed
with hanging drop and 10,000 ESCs. As the second microtip is
approached, 1 h after EB formation, the EB is deformed between
the two tips (Fig.
5b). This corresponds to the stretched
condition, for which, during the following 3 days, each EB is
maintained in its stretched configuration. Finally the cyclic
condition corresponds to an additional cyclic stimulation (at a
frequency of 1 Hz and an amplitude of 10%) for two 2 h periods
each day of the following 3 days (day 1, day 2 and day 3; Fig.
5c).
In this setup, the magnitude of the magnetic (intracellular)
force applied to single ESCs within the magnetic EB needs
first to
be quantified. At 400 µm from the magnetic tip/attractor and for
ESCs loaded with 3 pg of iron (or equivalently a magnetic
moment of 2 × 10
−13A m
2), the magnetic gradient of about
1000 cells 1000 cells Day 2 Drop Hanging Hanging drop Magnet Magnet 0.2 400 200 0 100 50 EB formation efficiency (%) 0 0.1 0 Ellipticity Diameter (µ m) 10,000 cells
1000 cells Hanging drop day 5 Magnet day 5 Hanging drop day 7 Magnet day 7 10000 cells 1000 100 *** * * *** ** ** ** *** 10 1 0.1 0.01 Fn1
Lama1 Lamb1 Lamc1 Sox17 Gata4 Gata6
T
Nkx2.5
WT1 Nes Pax6 Gene expression (relative to day 0)
1000 100 10 1 0.1 0.01 Fn1
Lama1 Lamb1 Lamc1 Sox17 Gata4 Gata6
T
Nkx2.5
WT1 Nes Pax6 Gene expression (relative to day 0)
0.2 400 200 0 100 50 EB formation efficiency (%) 0 0.1 0 Ellipticity Diameter (µ m) 10,000 cells b a b a ** * **
b
c
a
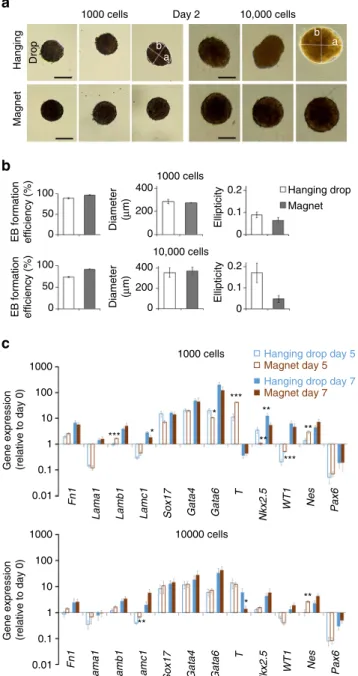
Fig. 4 Comparison between magnetic EB formation and hanging drop method.a Typical images of EBs observed at day 2 after seeding (of 1000 or 10,000 ESCs), either in hanging drop or over a magnetic attractor. The short axis b and the long-axis a of the equivalent ellipse were determined by image analysis (Image J). Scale bar: 200µm. b Quantification over 50 EBs: Efficiency is calculated as the number of EBs actually formed over the number of hanging drops deposited or of magnetic attractors present below the dish; the diameter (expressed inµm) is the effective diameter computed from the EBs areas; and the ellipticity is defined as 1-b/a. c Expression of a panel of genes characteristic of the different embryonic cell layers in EB obtained with hanging drop or magnetic aggregation with either 1000 or 10,000 cells. All gene expressions were normalized using the reference gene RPLP0 mRNA, and calculated relatively to the expression of the same gene obtained at day 0, prior to EB formation. The values varied very little from one condition to another. Even statistically significant differences (over- or under-expression) were small: with 1000 cells on day 5, Lamb1 expression increased by a factor of 1.7 and T expression by 3.7, while Nkx2.5 fell by a factor of 3.2, Wt1 rose by 2.5 and Nes rose by 2.1. On day 7, Lamc1 expression fell 1.5-fold and Nkx2.5 fell 2.3-fold. With 10,000 cells, Lamc1 increased 1.7-fold and Nes 2.6-fold on day 5, while T fell 4.2-fold on day 7. All error bars represent the SEM
1000 T/m provides a force of approximately 200 pN per single
ESC. More precisely, the magnetic force is exerted on the
nanoparticles clustered within lysosomes. Each lysosome is
thus submitted to a force of 1 pN since it contains a maximum
of 10
4nanoparticles and bears a magnetic moment in the range of
10
−15A m
2. Lysosomes, which are embedded in the viscoelastic
cytoplasm, are observed not to agglomerate onto each other or
drift significantly within the cell, see Supplementary Fig.
10
which
shows that the intracellular pattern of the magnetic lysosomes is
the same with or without magnet application.
To document the stimulation at single-cell levels, cell
move-ments were monitored over several stretching cycles using a
membrane cell marker (Pkh26). PIV analysis provided the
velocity
field of the cells submitted to stretching and compression
due to magnet displacements (Fig.
5d). No shear zones are
noticeable on this
figure. Moreover cells inside the EBs are
submitted to a uniform strain over the whole aggregate. Indeed
the divergence of the velocity
field which is representative for the
strain rate
47,48is homogenous. The average effective strain rate is
0.32
± 0.08 s
−1for the stretching step and 0.32
± 0.06 s
−1for the
compression step. Thus all cells experience essentially the same
deformation rate.
Finally, in all conditions, at the end of day 3, the spheroids
could be released (Fig.
5e) by removing the permanent magnets
(thus canceling the magnetic force), and transferred into dishes to
mature until day 5 before mRNA collection and analysis. The fact
that each EB was easily released as soon as the microtips were
demagnetized shows that the stretching is due to remote forces,
exerted at the heart of the tissue structure, with no direct contact.
Besides, as demonstrated in Fig.
5e on cryosections parallel and
perpendicular to the tissue axis, the EB maintains its engineered
shape.
Figure
6a shows the expression levels of genes characteristic of
the different embryonic layers, under the three conditions
(magnet, stretched and cyclic), and at day 5. All levels are
expressed relatively to the same genes expression at day 0, right
before EB formation and LIF removal. The expression levels of
the stretched and cyclic conditions must thus be compared with
the ones of the magnet condition, which are almost identical to
the control hanging drop method. First, we can note an increase
in the expression of Nkx2.5 involved in the cardiac mesoderm
pathway for the stretched condition, enhanced for the cyclic
condition. Concerning the other mesoderm gene T, because the
decrease in the expression of this gene has already begun at day 5
(see Supplementary Fig.
11
for the timing of T and Nkx2.5
involvement in cardiac differentiation), upregulation is lesser,
nevertheless increased for the stretched and cyclic conditions.
Second, we also measured a significant increase of the 3 genes
involved in the next stage towards cardiac differentiation, Sox17,
Gata4 and Gata6 (Supplementary Fig.
11
also summarizes the
role of these genes in cardiac differentiation), compared to the
control magnet condition, and this increase was higher for the
Magnetic microtips
Motorized stage
Day 0 : formation & stretching
Days 1–3 : stimulation Compressed Stretched 1 0.8 0.6 0.4 0.2 0 Day 3 : removal Nuclei F-actin 100 µM/s EB Magnetic microtip Magnetic microtip Magnets
a
b
c
d
e
Fig. 5 Magnetic stretcher: formation and stimulation of EBs. a Diagram of the magnetic stretcher device developed. Three EBs could be created on magnetic microtips (magnetized by permanent magnets), and then could be stretched/stimulated by approaching another 3 microtips (also magnetized by permanent magnets). The system is motorized to realize micrometer displacement of the second mobile magnetic microtips system. b Typical images of thefirst phases on day 0: EB formation and stretching. Scale bar: 200µm. c Typical images of the cyclic stimulation (here at days 1-3). Scale bar: 200µm. d Fluorescence images of membrane-stained cells in compressed and stretched EBs (10% imposed strain) are overlaid with velocity vectors extracted from PIV analysis (arrow bar scales for a speed of 100µm/s). Only one fourth of the vectors are represented for easy reading. Scale bar: 100µm. The divergence of the velocity field (for stretching) or its opposite (for compression) representative for the strain rate is mapped in both cases. For compression and stretching steps the mean effective strain rate sensed by cells is calculated at 0.32± 0.08 and 0.32± 0.06 s−1, respectively.e EB sampling on day 3 (here shown for a “cyclic” condition): Optical microscopy right after magnet removal and fluorescent imaging (DAPI staining, middle; F-actin staining, right) of 16-µm cryosections in the perpendicular and parallel direction of the tissue axis. The nuclei image shows a homogeneous cell density in the center of the EB, while F-actin is homogenous whatever the localization of the cell inside the stretched EB. Scale bar: 100µm. All EBs were formed with 10,000 ESCs
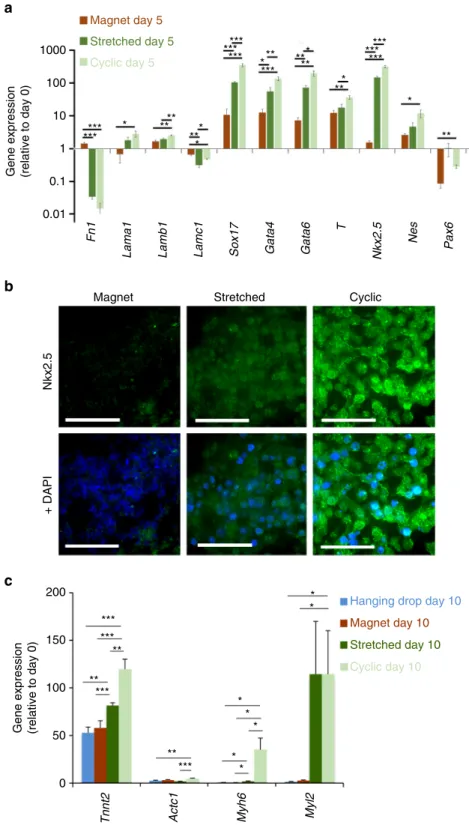
1000 *** *** *** *** *** ****** *** *** ** ** ** ** ** ** ** *** * * * * * * Magnet day 5 Stretched day 5 Cyclic day 5 100 10
Gene expression (relative to day 0) 1 0.1 0.01
Magnet
Hanging drop day 10
Magnet day 10 Stretched day 10 Cyclic day 10 Nkx2.5 + DAPI 200 150 100 50 0
Tnnt2 Actc1 Myh6 Myl2
Gene expression (relative to day 0)
*** *** *** *** ** ** ** * * * * * * * Stretched Cyclic Fn1
Lama1 Lamb1 Lamc1 Sox17 Gata4 Gata6
T Nkx2.5 Nes Pax6
a
b
c
Fig. 6 EBs characterization for the magnet, stretched and cyclic conditions. a Expression of genes characteristic of the different embryonic cell layers in EB after 5 days maturation (day 5). All EBs were obtained from 10,000 magnetized ESCs. Magnet: EB created on a magnetic microtip; Stretching: EB formed on a magnetic microtip, then stretched between two microtips; Cyclic: as before, plus stimulation at 1 Hz twice a day for 3 days. Gene expression (normalized to RPLP0) is calculated relative to the same gene expression at day 0 before EB formation.b Immunostaining (in green) of Nkx2.5 for EBs in the three conditions, with DAPI staining overlaid on the right. Images are obtained at the center of each EB. Scale bar: 50µm. c Gene expression at longer maturation times (day 10) for specific cardiac markers cardiac troponin T (Tnnt2), cardiac α-actin (Actc1), α myosin heavy chain (Myh6) and myosin regulatory light chain 2 (Myl2). All EBs were obtained from 10,000 ESCs. For the hanging drop formation (blue), ESCs were not labeled with the magnetic nanoparticles. For the three other conditions, ESCs were magnetic (3 pg of iron per cell): EB formation by magnet with no further stimulation (dark red), stretched stimulation (dark green) and cyclic stimulation (light green). mRNA levels are shown relative to control (day 0, defined as 1), and normalized to reference gene RPLP0. Error bars represent the SEM
cyclic condition. Finally, and logically, the expressions of other
genes involved in the endoderm or ectoderm pathways, were
either lowly upregulated, with levels close to the ones for
undifferentiated cells (Lama1, Lamb1, Lamc1, Nes and Pax6) or
down-regulated (Lamc1 and Fn1).
Immunostaining of the Nkx2.5 protein confirmed these results
(Fig.
6b). Its detection increased markedly in the stretched
condition, and even more strongly after cyclic stimulation.
Finally, in order to detect if a commitment towards the cardiac
lineage was really enhanced, we analyzed EB at longer maturation
times (day 10, Fig.
6c), and quantified by qPCR the expression of
transcripts encoding for specific cardiomyocyte markers. We
tested troponin T (Tnnt2), involved in cardiomyocyte
contrac-tion, cardiac
α-actin (Actc1), the cardiac cytoskeletal marker,
α myosin heavy chain (Myh6), involved in contraction and
considered as a maturation marker, and myosin regulatory light
chain 2 (Myl2), involved in the regulation of myosin ATPase
activity and known as a ventricular cardiomyocyte marker. The
hanging drop and magnet conditions of EBs formation led to
similar results for all genes and, overall, the efficiency of
differentiation towards functional cardiomyocytes was increased
upon application of stretched and cyclic stimulations. Compared
to the magnet condition, Tnnt2, Myh-6 and Myl2 genes were
overexpressed for the stretched condition, and this upregulation
was higher following cyclic stimulation for Tnnt2 and Myh-6. The
impact on cardiac
α-actin was less pronounced, with a significant
upregulation only for the cyclic condition. This protein is, among
others involved in the left ventricular compaction
49, and probably
expressed later.
Discussion
The main objective of this work was to provide a method for
assembling embryonic stem cells into 3D embryonic bodies
without the need for a scaffold and further stimulating
mechanically this embryoid body in situ, with the overriding aim
to determine whether embryonic stem cell differentiation could
be enhanced in this 3D setting through mechanical stimulation.
The engineering approach we propose is a magnetic one, in which
magnetic forces are created intracellularly on internalized
mag-netic nanoparticles and used to manipulate single ESC within a
3D construct, to produce 3D embryoid bodies with an inherent
capacity for further physical stimulation.
First, one must insist on the fact that, while ESCs are
particularly vulnerable to external perturbations, yet, their
dif-ferentiation profile after magnetic nanoparticle incorporation was
remarkably preserved. This was mandatory for the next steps of
EBs formation and stimulated differentiation. This result must
also be put into perspective with the ongoing use of magnetic
nanoparticles for regenerative medicine. Indeed, ahead of this
application, the question of magnetic nanoparticles on stem cells
differentiation must be addressed, and yet rarely was. Most works
investigated impact on mesenchymal stem cells differentiation,
with controversial results: some showed no effect on
differentia-tion
31while others showed an inhibition of chondrogenetic
dif-ferentiation pathway
50. One possible cause of this inhibition
seems to be the cellular iron dose, with no impact at a low dose
and inhibition at higher doses
40. Here we provide a
compre-hensive analysis of the impact of magnetic nanoparticles on the
whole differentiation profile of embryonic stem cells, and we
evidence a striking preservation of this profile, boding well for
their medical applications.
Studies of ESC differentiation require the creation of 3D
multicellular aggregates (embryoid bodies). There are three main
conventional approaches to EB formation in vitro
51: suspension
culture with spontaneous aggregate formation; encapsulation in
hydrogel; and the hanging drop method. The latter is the most
widely used but it is time-consuming and requires multiple
transfer steps. Control of EB size is a fundamental issue, as it
plays an important role in differentiation, as demonstrated with
alternative methods using microfabrication to control the size,
cell number and shape of EBs
52–55. Here we propose another
alternative method for in situ EB formation on a magnetic
attractor, with no impact on the differentiation profile when
compared to the hanging drop technique. In addition, the
equivalence between the two methods is robust, as demonstrated
by the passage from 1000 cells to 10,000 cells per EB: with both
the hanging drop method and the magnetic method, a fall in the
expression of endoderm and mesoderm marker genes (especially
the T gene on day 5) was observed as EB size increased, in
keeping with the few studies that have examined the influence of
EB size on ESC differentiation
52, 54, 56. The magnetic method
of EB formation could thus be an interesting alternative to
conventional techniques, especially as it avoids most of the
manipulations associated with the hanging drop method.
In order to fully understand the formation and stimulation of
the EB from a mechanical point of view, let us now examine the
corresponding force balance in the magnetic stretcher apparatus,
as depicted in Fig.
7.
During EB formation (Fig.
7a), the magnetic microtip subjects
each cell to a magnetic force (blue arrow), pulling it against its
neighbors, and thus contributing to squeezing all cells, but more
strongly the ones closer to the microtip. The total resulting
cellular magnetic force is then transmitted to the glass wall above
the microtip, and is exactly balanced by the wall reaction force
(green arrow). Straight after magnetic cell assembling, cohesion
builds up through cell–cell junctions, and the whole assembly
displays enough cohesion to be used as a standalone EB (Fig.
7b)
and sustain stretching. Magnetic stretching is initiated by
approaching a second magnetic microtip. The upper cell layers
are then pulled against the upper wall (Fig.
7c). At each wall, the
magnetic stretcher thus plays the role of a clamp acting on a
proximal region of the sample held by the opposing magnetic
force and the wall reaction force. At
first, for a small distance
between the microtips, the intermediate part of the EB is at
rest while within each clamp, the wall reaction force exactly
balances the corresponding total magnetic attraction force.
Moving the clamps apart stretches the intermediate part of the EB
and exerts pulling forces (black arrows) on the upper and lower
(thin) proximal regions. Modulating the distance between the
walls affects the degree of stretching of the large intermediate part
(in a uniform manner as shown by the PIV measurements
depicted in Fig.
5d) and the corresponding pulling forces and
wall reaction forces. Meanwhile, the magnetic forces remain
unchanged.
Let us now discuss whether the magnetic forces used to
manipulate the magnetic EB can endanger the EB cohesion that
results from cell–cell adhesion forces. Adhesive forces are
gen-erated by E-cadherin/E-cadherin bonds, measured at 73 pN each,
which amounts to about 900 nN per mESC-mESC pair
57. This is
of the same order as the force required to separate two cells
(several hundred nN)
58. One should compare this intensity to the
highest tensile cell–cell forces within the aggregate. This happens
to be within the intermediate region in the stretched
configura-tion (Fig.
7c). The magnitude of the tensile force in this region is
at most equal to that of the total magnetic force, around 1000 nN.
This tensile force is distributed over all cells within a horizontal
section of the aggregate (for instance the mid-height plane),
corresponding to roughly 500 cells. It yields a typical maximum
tensile force of 2 nN per cell pair, safely below the mESC-mESC
separation force.
It is also important to emphasize that, using only one magnetic
microtip does not alter significantly the gene expression (Fig.
4b),
while using two magnets, whether in the stretching (static)
or cyclic condition, clearly upregulate some genes (Fig.
6a, c).
With just one magnetic microtip (Fig.
7a), the tip behaves as a
clamp holding a limited (proximal) region of the EB, the only
region where substantial forces are present. Indeed, the applied
magnetic forces and resulting compression strongly decay with
distance from the tip. The major part of the EB thus undergoes
negligible stress in this one-magnet situation, and overall gene
expression is not affected. By contrast, in the two-magnet
situa-tion, the major part of the EB is stretched (Fig.
7c). As a result,
gene expression is expected to be altered in most cells, as detected
with global PCR measurement.
The magnetic stretcher brings several unique advantages: a 3D
aggregate composed solely of its component cells can be formed
in situ, without a supporting matrix, and can then be deformed
and stimulated, with no transfer step, simply by applying remote
magnetic forces. This remote deformation is perfectly illustrated
by the immediate release of the tissue when the magnets are
removed, and represents another advantage of the approach: the
stimulated tissue is easily recovered, perfectly intact. Moreover,
it is important to note that this approach is theoretically feasible
with any cell type capable of cell–cell adhesion to form a cohesive
assembly.
Finally, we show that remote magnetic stimulation (stretching
and cyclic stretching) can promote cardiac differentiation
without the need of chemical factors. In brief, we found that the
stimulation significantly increased the expression of the Gata4,
Gata6, Sox17 and Nkx2.5 genes, and that cyclic stimulation had
an even more important effect, at day 5 of differentiation.
The pattern of these increases is consistent with cardiac
mesoderm differentiation (Supplementary Fig.
8). First, the
car-diac mesoderm marker gene Nkx2.5 is importantly upregulated.
Then, Gata4 and Gata6, endo/mesoderm genes are also
upregulated, and were described to play a decisive role in cardiac
differentiation
59, 60. Finally Sox17 is overexpressed here as
described during cardiomyogenesis
61. Besides, we then
demon-strated that later on, at day 10 of differentiation, later cardiac
markers such as troponin T (Tnnt2), cardiac
α-actin (Actc1),
α myosin heavy chain (Myh6), and myosin regulatory light chain
2 (Myl2) were upregulated as well by the stimulation. The use
of the magnetic stretcher therefore revealed that mechanical
deformation is by itself sufficient to enhance ESC differentiation
towards a cardiac phenotype. 2D cell cyclic stretching was
similarly found to improve cardiac differentiation and maturation
of cardiomyocytes
16,62.
Here we do not provide any molecular mechanisms for
the cardiac commitment. However, because the mechanical
stimulation is that of a global strain applied to the EB, and
resembles the situation of a mechanical stretching on a 2D
deformable substrate, we can extrapolate from these works
how stem cells may translate external forces to mesodermal
differentiation. In brief, mechanical stimuli such as stretch
and shear stress can activate several signaling pathways such as
PI3K/Akt, ERK1/2, GSK-3ß, Tgf-β
63, Fgf5
64, and in turn initiate a
cardiovascular differentiation program
65–67, or facilitate cell–cell
connections
68.
To conclude, we proposed here a technology capable of
creating embryoid bodies (EBs) from individual embryonic stem
cells (ESCs) through the use of remote magnets, while
main-taining the cells’ functionality and differentiation profile. This
approach is an interesting alternative to conventional techniques
for EBs’ formation, such as the hanging drop method. The
magnetic stretching and stimulation of the resulting EBs then
provided a tool to explore the impact of physical biosensing on
ESCs differentiation. This purely mechanical stretching enhanced
the EBs towards the cardiac mesoderm differentiation pathway,
and this was even more pronounced with the application of cyclic
stimulation mimicking heart muscle contraction.
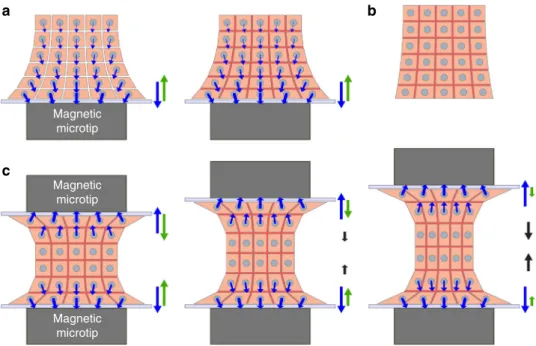
Magnetic microtip Magnetic microtip Magnetic microtip
a
b
c
Fig. 7 Schematic view of the forces involved within the EB in the magnetic stretcher. a Formation of the EB on the magnetic microtip located below a glass wall. Each cell is subjected to a magnetic force (blue arrow). The total resulting magnetic force (shown on the right-hand side, also in blue) is exactly balanced by the wall reaction force (green arrow). This pair of forces act like a“clamp” that holds mainly the “proximal” region of the sample, closest to the glass wall. After the magnetic contact, adhesion molecules (in red) develop the EB cohesion, without affecting forces.b The whole aggregate can then be used as a standalone EB.c When another magnetic microtip is approached with another glass wall, the upper cell layers are“clamped” against the upper wall in a similar way as ina. Varying the separation of both“clamps” makes it possible to adjust or cycle the (tensile) strain of the main part of the EB (represented here with a thickness of only two cells for simplicity, but actually corresponding to the major part of the entire EB)
Methods
ESC culture. CGR8 cell line was purchased from Sigma-Aldrich (09C028). This cell line was established from the inner cell mass of a 3.5 day male pre-implantation mouse embryo (Mus musculus, strain 129). Regular monitoring of cell cultures for Mycoplasma infections was performed using VenorGeM OneStep Mycoplasma Detection Kit (Sigma-Aldrich). To maintain their pluripotency, the cells were cultured on 0.1% gelatin (Sigma-Aldrich)-coated tissue culture plates in Glasgow’s modified Eagle’s medium (GMEM, Thermo Fisher Scientific) supplemented with 10% fetal calf serum (Thermo Fisher Scientific), 2 mM glutamine (Thermo Fisher Scientific), 1% nonessential amino acids (Thermo Fisher Scientific), 0.1 mM β-mercaptoethanol (Sigma-Aldrich), 1 mM sodium pyruvate (Thermo Fisher Scientific), 1% penicillin/streptomycin (Thermo Fisher Scientific); 1000 U/ml of leukemia inhibitor factor (LIF, Thermo Fisher Scientific) were added prior to use. The cells were cultured at the density of 1.2–104/cm2at 37 °C in a humidified 5%
CO2-95% air atmosphere and passaged every 2 days.
Iron oxide magnetic nanoparticles. Iron oxide nanoparticles (provided by PHENIX, UMR 8234, Paris) were synthetized by alkaline coprecipitation of FeCl2 (0.9 mol) and FeCl3 (1.5 mol) salts. The nanoparticles were then oxidized into maghemite with 1.3 mol of iron nitrate under boiling. After magnetic decantation, the maghemite nanoparticles were heated at 80 °C for 30 min in water, then sup-plemented with sodium citrate (70 g) to promote absorption of citrate anions onto their surface (to ensure electrostatic stabilization in aqueous solution) before precipitation in acetone at 25 °C and resuspension in water. The resulting nano-particles were 8 nm in diameter, with polydispersity index of 35%.
Magnetic cell labeling. Before their incubation with ESCs, the nanoparticles were dispersed atfinal [Fe] concentrations between 0.2 and 5 mM in RPMI (Thermo Fisher Scientific) supplemented with citrate at a final concentration of 5 mM to prevent nanoparticle aggregation. The ESCs were incubated in this medium between 30 min and 4 h, rinsed twice with RPMI medium, and then returned to complete proliferation medium (containing LIF) for at least 2 h before use. Determination of the cell iron mass by magnetophoresis. The mass of iron incorporated by the cells was determined by magnetophoresis, based on the determination of radius (Rcell) and velocity (vcell) of single cells dispersed in
aqueous medium (viscosityη = 103Pa.s) and attracted by a magnet whosefield
and gradient were perfectly calibrated (B= 0.15 T; gradB = 17 T/m). Calculation of the cellular iron mass is straightforward: In the horizontal plane of cell movement, the magnetic force (McellgradB) is counterbalanced by Stokes’ viscous force
(6πηRcellvcell), thus providing the magnetic moment (Mcell) of the analyzed cell,
which can be transformed into the mass of iron internalized via the volumic magnetization (50 emu/g for thefield B of 0.15 T). For each magnetophoretic measurement, the radius and velocity of 200 cells were measured using image processing (Image J). The cellular iron mass (in pg of iron per cell) obtained corresponds to the average value for the cell population (distribution of about 35%), itself averaged over at least 3 independent experiments.
Perls staining of intracellular iron. Perls’ Prussian blue staining was used to reveal iron-labeled cells in blue. The cells werefixed in 10% formalin solution in PBS then rinsed with PBS and incubated for 30 min at room temperature with 1% potassium ferrocyanide in 1% aqueous solution of hydrochloric acid. They were then rinsed with PBS and observed by optical transmission microscopy. Cell viability testing. The Alamar Blue metabolic test (Thermo Fisher Scientific) was used to assess the impact of the magnetic nanoparticles on ESC viability. The active ingredient, resazurin, becomes highlyfluorescent when metabolized. Fluorescence was quantified with a spectrophotometer (excitation 530 nm, emis-sion 590 nm), and the values were interpreted relative to control values (unlabeled cells in complete medium) obtained under similar conditions.
EB magnetophoresis for monitoring nanoparticles fate. To measure the magnetic moment (M) of the EBs, single EBs were immersed at each different time point after formation (days 1, 2, 4, and 7, n> 8 for each condition) in a glycerol solution (80%, room temperature 23–24 °C, viscosity η = 0.05 Pa.s) submitted to a magneticfield gradient (B = 150 mT, gradB = 17.5 T/m) generated by a permanent magnet (cylinder 25 mm in diameter, 10 mm height). Each EB thus experiences a magnetic velocity vmagtowards the magnet, by balancing the magnetic force
MgradB, and the Stokes drag force 6πηRvmag, where R is the EB radius. EB
migration was video-monitored every 0.1 s (×4 objective, Leica DMIRB micro-scope). The magnetic moment calculated (in A.m2, at 150 mT) can be converted to grams of (magnetic) iron (68 emu/g at 150 mT, 1 A.m2= 103emu).
Relative quantification of gene expression by real-time PCR. Total RNA was isolated using NucleoSpin RNA kit (Machery-Nagel) according to the manu-facturer’s instructions. To avoid genomic DNA contamination, RNA samples were incubated for 15 min with 10U of DNase. Complementary DNA (cDNA) was then synthesized using SuperScript II Reverse Transcriptase kit (Thermo Fisher
Scientific) with random hexamers according to the manufacturer’s instructions. Real-time PCR analysis was then carried out with SYBR green PCR technology using the StepOnePlus system (Thermo Fisher Scientific). The expression of 60S acidic ribosomal protein P0 (RPLP0) was used as a reference transcript. All sequences of primers used are presented in Supplementary Table1.
EB formation by the hanging drop method. Two days after passage, cells were detached, centrifuged and resuspended in differentiation medium (GMEM supplemented with 20% fetal calf serum, 2 mM glutamine, 1% nonessential amino acids, 0.1 mMβ-mercaptoethanol, 1 mM sodium pyruvate, 1% penicillin/strepto-mycin). Note that the LIF factor must be removed from culture medium since day 0 of EBs formation, resulting in initiation of differentiation. Drops containing 1000 or 10,000 cells in 30μl of medium were plated as hanging drops on a lid of 10 cm non-adherent Petri dish, which was then inverted over the bottom of the dishfilled with PBS to prevent drying. After 2 days (D0–D2), the aggregates thus formed were transferred to a Petri dish containing 10 ml of differentiation medium for a 3-day maturation period (D2-D5). Mature aggregates werefinally transferred to 0.1% gelatin-coated 24-well dishes. The medium was changed every 2–3 days. EB formation by magnetic attraction. Cells labeled with magnetic nanoparticles were detached, centrifuged and resuspended in differentiation medium. They were then placed in a glass-bottom Petri dish. To prevent cell adhesion, petri dish was previously incubated for 30 min with 10 mg/ml PLL-PEG (SuSos) diluted in 10 mM HEPES, then rinsed with sterile water, and placed on a magnetic device composed of several magnetic attractors. The magnetic device fabrication is straightforward. First make holes (typically 9 or 16, arranged in a square 3–4 mm lattice) with 0.8 mm drill through aluminum cylindrical plates (Dural) 8 mm thick and 35 mm diameter to match the size of small Petri dishes; Then take typical sewing pin, to be used as soft-iron cylinders with a diameter of 750μm. Insert the pins in the holes, and cut at the plate surface (use a drilling machine to level the surface; Place this magnetic pins array over a permanent magnet (typically disc neodymium magnet Ø 20 mm diameter, 8 mm height, strength about 10 kg, magneticfield created at the surface ~0.4 T). The device is ready to be used. Place it over a Petri dish with glass bottom, and deposit the ESCs in culture medium. The number of deposited cells was adjusted to obtain between 1000 and 30,000 cells per magnetic microtip. The magnetic device was subsequently removed between 5 min and 2 days, depending on the experiment.
Formation and stimulation of EBs in the magnetic stretcher. The magnetic stretcher is described in detail in the results section. It consists of a reservoir with two magnetic structures, onefixed and the other mobile, each comprising 3 magnetic microtips and the 3 magnets used to magnetize them. The principle is to form 3 EBs over the 3fixed magnetic microtips of the fixed structure, and then stretch them by the attractive force of the 3 matching microtips on the mobile structure. They could also be stimulated at will by subjecting the second structure to micro-controlled movements.
The reservoir wasfirst washed in 70% ethanol for 15 min, then dried and rinsed 3 times with sterile water before being exposed to UV for 30 min. The glass slides protecting the magnetized microtips were coated with PLL-PEG to prevent cell adhesion. Before use, the stretching device was sterilized by UV and placed in a sterile box, with a sterile cover placed over the reservoir.
Three EBs, each composed of 10,000 ESCs (labeled with 2 mM iron for 30 min), were formed on day 0 on thefixed set of magnetic microtips. One hour later they were stretched, at amplitude corresponding to 50% of their original size, by approaching the mobile set of magnetic tips (stretched condition). The whole assembly was then placed overnight in an incubator (37 °C, 5% CO2). In some cases
(cyclic condition), starting the following day (day 1), the EBs were stimulated twice daily for 2 h at a frequency of 1 Hz and an amplitude corresponding to 10% of the initial height of the aggregate. Stimulation was applied for the next 3 days (day 1–day 3). At the end of day 3, the microtips were demagnetized by removing the permanent magnets. This instantly released EBs were transferred to Petri dishes and again allowed to mature for 2 days (up to day 5) before analysis.
Fluorescence live imaging. Cell membranes were stained with a redfluorochrome Pkh26 from Sigma. Cell stimulation with a 10% strain applied at 1 Hz was observed in situ, on living cells, byfluorescence microscopy.
Velocity mapping: The PIV analysis was computed using the Matpiv software package (a GNU public license software) for MATLAB (The MathWorks, Natick, MA)69,70. We used 64 × 64-pixels (40 × 40µm) interrogation windows with 75% overlap. Calculation of the correlation between two successive subwindows was performed by fast Fourier transform (the single method). Aberrant vectors were filtered out from the velocity fields with a median Gaussian filter.
Immunohistology. 16-µm cryosections of EBs were fixed with 4% PFA (Interchim) during 5 min, washed with PBS, and then incubated 5 min with PBS-Triton X-100 (0.1% v/v). Nonspecific sites were blocked with 5% (w/v) bovine serum albumin (BSA) diluted in PBS during 1 hour and incubated with primary antibodies overnight at 4 °C. Anti-Brachyury T (Abcam, 1:200) and anti-Nkx2.5 (Santa Cruz Technologies, 1:100) primary antibodies were used. The binding of primary
antibodies was detected by incubation for 3 h with Alexa Fluor-conjugated anti-rabbit IgG (Cell Signaling, 1:1000). Finally, cells were washed in PBS and mounted with Prolong®Diamond Antifade Mounting Medium with DAPI (Life Technology) for nuclear staining. Cells were analyzed with an Olympus JX81/BX61 device/ Yokogawa CSU device spinning-disk microscope (Andor Technology), equipped with a 63X oil objective (Olympus).
Statistical analysis. All measurements were made at least three times, in inde-pendent conditions. All results are shown as the mean± standard error of the mean (SEM). Parametric student’s t test, two-sided, was used to compare the mean of two values obtained for two independent conditions; *p< 0.05 indicates a significant result, **p < 0.01 a very significant result, and ***p < 0.001 a highly significant result.
Data availability. Data supporting thefindings of this study are available within the article and its Supplementary informationfiles, and from the corresponding author upon reasonable request.
Received: 9 November 2016 Accepted: 6 July 2017
References
1. Pati, F. et al. Printing three-dimensional tissue analogues with decellularized extracellular matrix bioink. Nat. Commun. 5, 3935 (2014).
2. Giobbe, G. G. et al. Functional differentiation of human pluripotent stem cells on a chip. Nat. Meth. 12, 637–640 (2015).
3. Todhunter, M. E. et al. Programmed synthesis of three-dimensional tissues. Nat. Methods 12, 975–981 (2015).
4. Parmar, P. A. et al. Temporally degradable collagen–mimetic hydrogels tuned to chondrogenesis of human mesenchymal stem cells. Biomaterials 99, 56–71 (2016).
5. Discher, D. E., Mooney, D. J. & Zandstra, P. W. Growth factors, matrices, and forces combine and control stem cells. Science 324, 1673–1677 (2009). 6. Engler, A. J., Sen, S., Sweeney, H. L. & Discher, D. E. Matrix elasticity directs
stem cell lineage specification. Cell 126, 677–689 (2006).
7. Evans, N. D. et al. Substrate stiffness affects early differentiation events in embryonic stem cells. Eur. Cell. Mater. 18, e13 (2009).
8. Gobaa, S., Hoehnel, S. & Lutolf, M. Substrate elasticity modulates the responsiveness of mesenchymal stem cells to commitment cues. Int. Biol. 7, 1135–1142 (2015).
9. Sun, Y. et al. Hippo/YAP-mediated rigidity-dependent motor neuron differentiation of human pluripotent stem cells. Nat. Mater 13, 599–604 (2014). 10. Keung, A. J., Asuri, P., Kumar, S. & Schaffer, D. V. Soft microenvironments
promote the early neurogenic differentiation but not self-renewal of human pluripotent stem cells. Int. Biol. 4, 1049–1058 (2012).
11. Przybyla, L., Lakins, J. N. & Weaver, V. M. Tissue Mechanics Orchestrate Wnt-Dependent Human Embryonic Stem Cell Differentiation. Cell Stem Cell 19, 462–475 (2016).
12. Huang, Y. et al. Effect of cyclic strain on cardiomyogenic differentiation of rat bone marrow derived mesenchymal stem cells. PLoS ONE 7, e34960 (2012). 13. Adamo, L. et al. Biomechanical forces promote embryonic haematopoiesis.
Nature. 459, 1131–1135 (2009).
14. Yamamoto, K. et al. Fluid shear stress induces differentiation of Flk-1-positive embryonic stem cells into vascular endothelial cells in vitro. Am. J. Physiol. 288, H1915–H1924 (2005).
15. Geuss, L. R. & Suggs, L. J. Making cardiomyocytes: how mechanical stimulation can influence differentiation of pluripotent stem cells. Biotechnol. Prog. 29, 1089–1096 (2013).
16. Gwak, S.-J. et al. The effect of cyclic strain on embryonic stem cell-derived cardiomyocytes. Biomaterials 29, 844–856 (2008).
17. Kurpinski, K., Chu, J., Hashi, C. & Li, S. Anisotropic mechanosensing by mesenchymal stem cells. Proc. Natl Acad. Sci. USA 103, 16095–16100 (2006). 18. Chowdhury, F. et al. Material properties of the cell dictate stress-induced
spreading and differentiation in embryonic stem cells. Nat. Mater 9, 82–88 (2010).
19. Uda, Y. et al. Force via integrins but not E-cadherin decreases Oct3/4 expression in embryonic stem cells. Biochem. Biophys. Res. Commun. 415, 396–400 (2011).
20. Pelaez, D., Charles Huang, C.-Y. & Cheung, H. S. Cyclic compression maintains viability and induces chondrogenesis of human mesenchymal stem cells in fibrin gel scaffolds. Stem Cells Dev. 18, 93–102 (2009).
21. Henstock, J. & El Haj, A. Controlled mechanotransduction in therapeutic MSCs: can remotely controlled magnetic nanoparticles regenerate bones? Regen. Med. 10, 377–380 (2015).
22. Matthys, O. B., Hookway, T. A. & McDevitt, T. C. Design Principles for Engineering of Tissues from Human Pluripotent Stem Cells. Curr. Stem Cell Rep. 2, 43–51 (2016).
23. Poh, Y.-C. et al. Generation of organized germ layers from a single mouse embryonic stem cell. Nat. Commun. 5, 4000 (2014).
24. Bratt-Leal, A. M., Kepple, K. L., Carpenedo, R. L., Cooke, M. T. & McDevitt, T. C. Magnetic manipulation and spatial patterning of multi-cellular stem cell aggregates. Int. Biol. 3, 1224–1232 (2011).
25. Mironov, V. et al. Organ printing: tissue spheroids as building blocks. Biomaterials 30, 2164–2174 (2009).
26. Ahrens, E. T. & Bulte, J. W. Tracking immune cells in vivo using magnetic resonance imaging. Nat. Rev. Immunol. 13, 755–763 (2013).
27. Cromer Berman, S. M., Walczak, P. & Bulte, J. W. Tracking stem cells using magnetic nanoparticles. Wiley Interdiscip. Rev. Nanomed. Nanobiotechnol. 3, 343–355 (2011).
28. Harrison R. et al. Autonomous magnetic labelling of functional mesenchymal stem cells for improved traceability and spatial control in cell therapy applications. J. Tissue Eng. Regen. Med. doi:10.1002/term.2133(2016). 29. Tang, Y. et al. MRI/SPECT/fluorescent tri‐modal probe for evaluating the
homing and therapeutic efficacy of transplanted mesenchymal stem cells in a rat ischemic stroke model. Adv. Funct. Mater 25, 1024–1034 (2015). 30. El Haj, A. J. et al. An in vitro model of mesenchymal stem cell targeting using
magnetic particle labelling. J. Tissue Eng. Regen. Med. 9, 724–733 (2015). 31. Landázuri, N. et al. Magnetic targeting of human mesenchymal stem cells with
internalized superparamagnetic iron oxide nanoparticles. Small 9, 4017–4026 (2013).
32. Cheng, K. et al. Magnetic enhancement of cell retention, engraftment, and functional benefit after intracoronary delivery of cardiac-derived stem cells in a rat model of ischemia/reperfusion. Cell Transplant 21, 1121–1135 (2012). 33. Kim, J. A. et al. High-throughput generation of spheroids using magnetic nanoparticles for three-dimensional cell culture. Biomaterials 34, 8555–8563 (2013).
34. Mattix, B. et al. Biological magnetic cellular spheroids as building blocks for tissue engineering. Acta Biomater. 10, 623–629 (2014).
35. Souza, G. R. et al. Three-dimensional tissue culture based on magnetic cell levitation. Nat. Nanotech. 5, 291–296 (2010).
36. Lee J.-K., Ito A., Honda H. Construction of functional cardiovascular tissues using magnetic nanoparticles. Cardiac Regeneration Using Stem Cells, 221-228 (2013).
37. Kito, T. et al. iPS cell sheets created by a novel magnetite tissue engineering method for reparative angiogenesis. Sci. Rep. 3, 1418 (2013).
38. Arbab, A. S. et al. Labeling of cells with ferumoxides–protamine sulfate complexes does not inhibit function or differentiation capacity of
hematopoietic or mesenchymal stem cells. NMR Biomed. 18, 553–559 (2005). 39. Kostura, L., Kraitchman, D. L., Mackay, A. M., Pittenger, M. F. & Bulte, J. W. Feridex labeling of mesenchymal stem cells inhibits chondrogenesis but not adipogenesis or osteogenesis. NMR Biomed. 17, 513–517 (2004).
40. Fayol, D., Luciani, N., Lartigue, L., Gazeau, F. & Wilhelm, C. Managing magnetic nanoparticle aggregation and cellular uptake: a precondition for efficient stem‐cell differentiation and MRI tracking. Adv. Healthc. Mater 2, 313–325 (2013).
41. Han, J. et al. Iron oxide nanoparticle-mediated development of cellular gap junction crosstalk to improve mesenchymal stem cells’ therapeutic efficacy for myocardial infarction. ACS Nano 9, 2805–2819 (2015).
42. Cheng, K. et al. Magnetic antibody-linked nanomatchmakers for therapeutic cell targeting. Nat. Commun. 5, 4880 (2014).
43. Au, K.-W. et al. Effects of iron oxide nanoparticles on cardiac differentiation of embryonic stem cells. Biochem. Biophys. Res. Commun. 379, 898–903 (2009). 44. Parsa, H. et al. Effect of superparamagnetic iron oxide nanoparticles-labeling on
mouse embryonic stem cells. Cell J. 17, 221–230 (2016). 45. Mazuel, F. et al. Massive intracellular biodegradation of iron oxide
nanoparticles evidenced magnetically at single-endosome and tissue levels. ACS Nano 10, 7627–7638 (2016).
46. Mazuel, F. et al. Magneto-Thermal Metrics Can Mirror the Long‐Term Intracellular Fate of Magneto‐Plasmonic Nanohybrids and Reveal the Remarkable Shielding Effect of Gold. Adv. Funct. Mat 27, 1605997 (2017). 47. Zhao, R., Boudou, T., Wang, W. G., Chen, C. S. & Reich, D. H. Decoupling cell
and matrix mechanics in engineered microtissues using magnetically actuated microcantilevers. Adv. Mat 25, 1699–1705 (2013).
48. Trepat, X. et al. Physical forces during collective cell migration. Nat. Phys. 5, 426–430 (2009).
49. Frade, A. F. et al. Polymorphism in the alpha cardiac muscle actin 1 gene is associated to susceptibility to chronic inflammatory cardiomyopathy. PLoS ONE 8, e83446 (2013).
50. Chang, Y. K., Liu, Y. P., Ho, J. H., Hsu, S. C. & Lee, O. K. Amine‐surface‐ modified superparamagnetic iron oxide nanoparticles interfere with differentiation of human mesenchymal stem cells. J. Orthop. Res. 30, 1499–1506 (2012).