HAL Id: insu-01180185
https://hal-insu.archives-ouvertes.fr/insu-01180185
Submitted on 24 Jul 2015
HAL is a multi-disciplinary open access
archive for the deposit and dissemination of
sci-entific research documents, whether they are
pub-lished or not. The documents may come from
teaching and research institutions in France or
abroad, or from public or private research centers.
L’archive ouverte pluridisciplinaire HAL, est
destinée au dépôt et à la diffusion de documents
scientifiques de niveau recherche, publiés ou non,
émanant des établissements d’enseignement et de
recherche français ou étrangers, des laboratoires
publics ou privés.
On the simultaneity of substorm onset between two
hemispheres
A Morioka, Y Miyoshi, F Tsuchiya, H Misawa, Y Kasaba, T Asozu, S Okano,
A Kadokura, N Sato, H Miyaoka, et al.
To cite this version:
A Morioka, Y Miyoshi, F Tsuchiya, H Misawa, Y Kasaba, et al.. On the simultaneity of substorm onset
between two hemispheres. Journal of Geophysical Research Space Physics, American Geophysical
Union/Wiley, 2011, 116, A04211 (15 p.). �10.1029/2010JA016174�. �insu-01180185�
On the simultaneity of substorm onset between two hemispheres
A. Morioka,
1Y. Miyoshi,
2F. Tsuchiya,
1H. Misawa,
1Y. Kasaba,
3T. Asozu,
1,4S. Okano,
1A. Kadokura,
5N. Sato,
5H. Miyaoka,
5K. Yumoto,
6G. K. Parks,
7F. Honary,
8J. G. Trotignon,
9P. M. E. Décréau,
9and B. W. Reinisch
10Received 4 October 2010; revised 15 January 2011; accepted 21 January 2011; published 15 April 2011.
[1]
Simultaneous observations of auroral kilometric radiation from the Northern and
Southern Hemispheres showed some cases in which the buildup of field
‐aligned
acceleration occurred only in one hemisphere at the substorm onset. This indicates that a
substorm does not always complete the current system by connecting the cross
‐tail current
with both northern and southern ionospheric currents. Conjugate auroral observations
showed that in one case, the auroral breakup in the Northern and Southern Hemispheres
was not simultaneous; rather, they occurred a few minutes apart. This time difference in
the breakup between two hemispheres suggests that the local auroral ionosphere controls
auroral breakup in each hemisphere independently. The evidence in this study may
indicate that the buildup of the field
‐aligned acceleration region at the auroral breakup
does not result only from the magnetospheric process and that the auroral ionosphere
finally controls and/or ignites the substorm onset, that is, the auroral breakup.
Citation: Morioka, A., et al. (2011), On the simultaneity of substorm onset between two hemispheres, J. Geophys. Res., 116, A04211, doi:10.1029/2010JA016174.
1.
Introduction
[2] It has been established that the auroral breakup is
caused by electron beams driven by field‐aligned accelera-tion at the substorm onset (e.g., review paper by Meng [1978, and references therein]). Thus, a sudden formation of the field‐aligned acceleration region in the magnetosphere‐ ionosphere (M‐I) coupling system is essential to complete the magnetospheric substorm onset. The upward field‐ aligned current (FAC), which connects the auroral iono-sphere and magnetoiono-sphere, forms the substorm current system [Knight, 1973; McPherron et al., 1973; Lyons, 1981] and is suddenly reinforced at the substorm onset. From observations of the tail current disruption and its closure at a substorm onset, it is also well understood that the cross‐tail current diverges into the auroral ionosphere from the
dawnside near‐Earth plasma sheet and converges out of the duskside ionosphere to the near‐Earth plasma sheet, that is, the substorm current wedge [Akasofu, 1972; McPherron et al., 1973; Lui, 1996].
[3] It has been implicitly assumed that the FAC connects
the near‐Earth plasma sheet to both the northern and southern auroral ionospheres, and the intensity of field‐ aligned acceleration and current at the onset depends on the plasma state and conductivity in each M‐I coupling region and ionosphere [e.g., Kumamoto and Oya, 1998; Fujii and Iijima, 1987]. In this context, some questions arise. There may be cases in which an independent building‐up of the field‐aligned acceleration occurs at each ionosphere at a magnetospheric substorm onset. This would be the time difference in the auroral breakup between the two hemi-spheres. There may also be cases in which one ionosphere satisfies conditions for building‐up an acceleration region at a magnetospheric substorm onset, but the opposite hemi-sphere is not ready. In this case, the substorm current should link to only one hemisphere, which is a kind of one‐sided auroral breakup. If this is the case, it can be inferred that field‐aligned acceleration in the M‐I coupling region of each hemisphere does finally ignite the substorm when the magnetosphere is ready for a substorm.
[4] Conjugate auroras [e.g., Østgaard et al., 2004, and
references therein] have been studied using aircraft [e.g., Stenbaek‐Nielsen et al., 1972], ground‐based systems [e.g., Sato et al., 1986], and spacecraft [e.g., Zverev et al., 1992] observations. Conjugacy and nonconjugacy of auroral arcs during substorm were first studied on the basis of aircraft observations by Stenbaek‐Nielsen et al. [1972, 1973] and Stenbaek‐Nielsen and Otto [1997]. They showed
non-1Planetary Plasma and Atmospheric Research Center, Tohoku
University, Sendai, Japan.
2
Solar‐Terrestrial Environment Laboratory, Nagoya University, Nagoya, Japan.
3
Geophysical Institute, Tohoku University, Sendai, Japan.
4Japan Atomic Energy Agency, Ibaraki, Japan. 5
National Institute of Polar Research, Tokyo, Japan.
6Space Environment Research Center, Kyushu University, Fukuoka,
Japan.
7Space Sciences Laboratory, University of California, Berkeley,
California, USA.
8
Department of Physics, Lancaster University, Lancaster, UK.
9Laboratoire de Physique et Chimie de l’Environnement et de l’Espace,
Orléans, France.
10Center for Atmospheric Research, University of Massachusetts
Lowell, Lowell, Massachusetts, USA.
Copyright 2011 by the American Geophysical Union. 0148‐0227/11/2010JA016174
conjugacy of discrete arcs and suggested that the processes creating auroral forms operate independently in each hemisphere. The first simultaneous onset observation at Northern and Southern Hemispheres was reported by Sato et al. [1998a, 1998b] from ground‐based observation and by Frank and Sigwarth [2003] from the Polar spacecraft observation, and they showed events in which an aurora breakup was not simultaneous and was different in bright-ness between the Southern and Northern Hemispheres. It should be noted that substorm onset locations and auroral features are usually not symmetric owing to the interplan-etary magnetic field control [Østgaard et al., 2004]. The hemispheric asymmetry of the afternoon aurora was also reported by Fillingim et al. [2005], and the differences are attributed to differing ionospheric convection patterns in both hemispheres due to the By component of the inter-planetary magnetic field (IMF).
[5] Despite these pioneer and the following precise
observations of conjugate auroral substorms, few reports have been presented on detailed onset observations in order to prove interhemispheric substorm processes. This is partly because it has been very rare to observe the simultaneous conjugate substorm onset between two hemispheres.
[6] Auroral kilometric radiation (AKR) spectra provide
remote sensing of a field‐aligned acceleration region and its dynamics [e.g., Kaiser and Alexander, 1977] because AKR is the result of wave‐particle interaction with electron beams in the acceleration region [e.g., Gurnett, 1974; Ergun et al., 1998; Pottelette et al., 2001]. The altitude of the AKR source is regarded to be roughly equivalent to that of the field‐aligned acceleration region [e.g., Morioka et al., 1981; Liou et al., 2000; de Feraudy et al., 2001; Hanasz et al., 2001], and the altitude is estimated from AKR frequency considering that AKR emanates at the local electron cyclotron frequency along the auroral field line. Fairfield et al. [1999] utilized AKR as a proxy of auroral particle acceleration. The low‐frequency component of AKR (typically tens of kHz) has been studied in terms of isolated AKR (ITKR [Steinberg et al., 1988, 1990]), low‐frequency (LF) burst [Kaiser et al., 1996; Desch and Farrell, 2000], and LF‐AKR [Olsson et al., 2004]. In this paper we hereafter abbreviate low‐frequency/ high‐altitude AKR to LF‐AKR and midfrequency/low‐ altitude AKR to MF‐AKR for convenience.
[7] Recently, Morioka et al. [2010] showed that
enhance-ment of the MF‐AKR (more than 300 kHz/less than 5000 km of altitude) corresponds to the pseudo‐breakup or initial brightening of auroral substorm, and that the explosive development of LF‐AKR (less than 200 kHz/more than 6000 km of altitude) corresponds to the auroral breakup and subsequent poleward expansion, that is, substorm onset. The explosive LF‐AKR at onset is called AKR breakup [Morioka et al., 2007]. These intimate relationships between AKR and substorms suggest that the enhancement of low‐ altitude acceleration (inverted‐V type electric field) causes the pseudo‐substorm and initial brightening, and the breakout of the high‐altitude acceleration, that follows the low‐altitude acceleration, leads to the full substorm with poleward expansion (two‐step evolution of substorm onset). Thus, AKR observations above the auroral ionosphere can remotely define the timing and onset process of substorms. If AKR breakups are observed independently from both
hemispheres, it can provide an answer to question about the simultaneity of substorm onset between both hemispheres.
[8] The term “substorm” is, in the following, used to
indicate the state in which the magnetospheric tail‐current has linked to the auroral ionosphere forming the current wedge and building up the high‐altitude field‐aligned acceleration, and the“substorm onset” is completed through two steps; first, enhancement of low‐altitude acceleration (initial brightening, enhancement of MF‐AKR), and then subsequent breakout of high‐altitude acceleration (auroral breakup, AKR breakup).
[9] In this paper, we examine the timing of substorm
onset in the two auroral ionospheres using (1) remote AKR observations of substorm onset by multispacecraft and (2) simultaneous auroral observations between geomagnet-ically conjugate stations. We demonstrate that substorms do not always show simultaneous onset between the northern and southern auroral regions and that the AKR breakup, that is, the substorm onset, sometimes takes place only in one hemisphere.
2.
AKR Observations
2.1. Illumination Zone of AKR in the Magnetosphere [10] Simultaneity of AKR breakup in the northern and
southern magnetosphere was examined using radio observa-tions by Cluster, Imager for Magnetopause‐to‐Aurora Global Exploration (IMAGE), and Geotail spacecraft. The Waves of High frequency and Sounder for Probing of Electron density by Relaxation (WHISPER) instrument [Décréau et al., 1997; Trotignon et al., 2003] onboard the Cluster spacecraft has the capability to observe LF‐AKR below 80 kHz. The Radio Plasma Imager (RPI) instrument [Reinisch et al., 2000, 2004] onboard the IMAGE spacecraft observes natural radio waves in the frequency range from 3 kHz to 3 MHz, which includes the frequency range of AKR [Green et al., 2004]. The Plasma Wave Instrument (PWI) [Matsumoto et al., 1994] onboard Geotail observes a wide frequency range of plasma waves from 18 Hz to 800 kHz in the magnetosphere and interplanetary space.
[11] During the period from January to June in 2003, polar
orbiting Cluster and IMAGE spacecraft were near the noon‐ midnight meridian plane; the apogee of Cluster was around the dayside equator with a height of about 19.5 RE (RE:
Earth radii), and that of IMAGE was around the nightside equator with a height of about 8.2 RE. The orbit of the
Geotail spacecraft was near the equatorial plane with an apogee and perigee height of 30.8 and 8.8 RE, respectively.
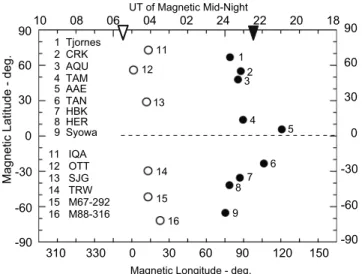
[12] To identify the source hemisphere of AKR observed
by satellite, the visible zone of AKR from space is first statistically surveyed using AKR observations by Cluster and IMAGE. Figure 1 shows the locations of AKR obser-vation at 70 kHz in the day‐night meridian plane from January–June 2003. The “day‐night meridian plane” is taken to be from 9 to 13 h to 21–01 h magnetic local time (MLT), which is rather thick and somewhat off the noon‐ midnight line, considering the offset occurrence of discrete auroras with respect to magnetic midnight [Newell et al., 1996]. Plotted red dots are the location of AKR detected by Cluster‐3, and blue dots are those detected by IMAGE. The black dots indicate locations where Cluster‐3 did not detect simultaneous AKR with that detected by IMAGE in
MORIOKA ET AL.: ON THE SIMULTANEITY OF SUBSTORM ONSET A04211 A04211
the nightside hemisphere. Thus, the distribution of black dots indicates the shadow zone of AKR. Note that the low‐ altitude cutoff of IMAGE observations (blue dots) above the polar ionospheres is not natural, but is the altitude limit to distinguish AKR from the intense local plasma waves below the altitude of 4 RE.
[13] The source locations of AKR at 70 kHz estimated to
be the altitude of 12,000 km on the L = 7 field line are shown by star symbols in the northern and southern auroral regions in Figure 1. The illumination zone of AKR at 70 kHz in the magnetosphere (colored light yellow) is determined by the demarcation boundaries that divide the red dots from the black dots in the dayside hemisphere and by the low‐altitude border of AKR observation in the nightside hemisphere. In the Southern Hemisphere, the demarcation boundary is not uniquely determined because red and black dots are merged in the dayside high latitude. This may indicate that the radiation cone‐angle of AKR changes from event to event. Some red dots in the shadow zone of AKR (shaded light blue) are considered to be Z‐mode AKR because Z‐mode AKR can propagate toward dayside from the nightside source region [Hashimoto and Calvert, 1990]. The experimentally obtained AKR illumination zone in this study is fairly consistent with the earlier ray‐ tracing studies on the angular distribution of AKR for the case of L‐O mode propagation [Green et al., 1977; Hashimoto, 1984], while many studies indicated that the intense AKR is almost R‐X mode. It should be noted that there exists a zone in the nightside magnetosphere beyond 7 REwhere an observer can see both AKRs radiated from
the northern and southern auroral regions.
2.2. Simultaneous AKR Spectrograms From Northern and Southern Hemispheres
[14] Figure 2 shows the simultaneous AKR spectrograms
from the three spacecraft on 20 August 2003. Figure 2a is the spectrogram in the frequency range of 20–600 kHz from the Geotail observation when the satellite was outside the equatorial afternoon magnetosphere (∼1430 MLT, radial distance∼28.7 RE, MLAT∼12.4°). Two line emissions at
about 35 and 65 kHz are fpand 2fpemissions ( fp: plasma
frequency) radiated upstream of the Earth’s bow shock [e.g., Gurnett, 1975; Kasaba et al., 2000]. Intense AKR was observed in the frequency band of 65–600 kHz during the period from 1540 to 1700 UT: the MF‐AKR in the range of 280 to 100 kHz, the LF‐AKR from 100 to 65 kHz, and second harmonic AKR [Benson, 1982; Wu and Qiu, 1983] above 300 kHz. The lower border of the LF‐AKR frequency seems to be roughly∼2fpin the solar wind, indicating that
the LF‐AKR propagated through the magnetosheath [Kaiser et al., 1996]. The observed AKR spectrogram can be con-cluded to be a mixture of AKR propagated from both northern and southern source regions, because Geotail was located near the afternoon equatorial plane where both AKR sources could illuminate the satellite.
[15] Figure 2b is the spectrogram from the IMAGE
sat-ellite in the frequency range from 3 to 80 kHz. The trajec-tory of the satellite during the observation is indicated by the pink trace with the label IM:8/20 in Figure 1. Note that the satellite can receive AKR only from the northern auroral region. Figure 2c is the spectrogram from Cluster‐3 in the same frequency range as IMAGE. The trajectory of Cluster‐3 during the observation is shown by the green Figure 1. Illumination zone (light yellow) and shadow area (light blue) of AKR in the magnetosphere in
the meridian of 9–13 h to 21–01 h MLT plane. The red and blue dots are the respective observation points of AKR from Cluster‐3 (CL) and IMAGE (IM) satellites during the period from January to June 2003. The black dots indicate locations where Cluster‐3 did not observe simultaneous AKR with that observed by IMAGE in the nightside. The two stars are the source regions of AKR at 70 kHz. The green and pink lines are trajectories of Cluster‐3 and IMAGE satellites (in SM coordinates) used in this study.
trace labeled CL:8/20 in Figure 1, where only the southern AKR can illuminate the spacecraft.
[16] Comparing these three spectrograms below 80 kHz,
we can find a distinctly common feature in which bursty LF‐AKRs with a wide frequency range (AKR breakup) appeared simultaneously and most of the bursty LF‐AKRs showed the sudden frequency expansion down to 50 kHz, which represents the AKR source expansion up to 14000 km of altitude along the auroral field line. This indicates that the abrupt buildup and expansion of field‐aligned acceleration, that is, substorm onset was synchronous between the northern and southern M‐I coupling regions within the lowest time resolution of the IMAGE spectrogram (about 2.5 min in this case).
[17] This field‐aligned sudden acceleration is considered
to be a consequence of current/current‐driven instabilities which is built up in the higher altitude above 6000 km [Morioka et al., 2008]. Another possible field‐aligned acceleration process is dispersive Alfven wave acceleration found in Freja, Polar, FAST and Cluster observations [e.g., Stasiewicz et al., 2000; Wygant et al., 2002; Chaston et al., 2005]. This process may work as the bursty acceleration at substorm onset. However, accelerated electrons by this process are superthermal and are not sufficient to generate AKR [e.g., Mende et al., 2003]. Thus, we consider that the
Alfvénic acceleration process is less essential for the onset‐ time bursty acceleration with AKR breakup.
[18] The next example in Figure 3 shows, in contrast, a
different feature of AKR breakup between the two hemi-spheres. The spectrograms in Figure 3 were obtained from the three spacecraft on 25 June 2003 with the same format as that in Figure 2. Trajectories of the IMAGE and Cluster spacecraft were in the northern and southern AKR illumi-nation zones, respectively, as shown in Figure 1 with IM:6/25 and CL:6/25 labels. The Geotail satellite was outside the equatorial duskside magnetosphere (∼1930 MLT, radial distance∼30.8 RE, MLAT∼−3.5°), where both hemispheric
AKR source regions were visible from the satellite. It should be noted that AKR spectra observed from IMAGE and Cluster‐3 were not always concurrent with each other but sometimes showed an alternate appearance. The blue tags in the Figure 3 indicate synchronous AKR. The red and yellow tags indicate the complementary AKR between the two hemispheres; the red tag is the period of northern AKR alone and yellow tags are the period of southern AKR alone. At Geotail, AKR spectra below 80 kHz (horizontal white line) showed a feature of the logical conjunction of AKR spectra from IMAGE and Cluster, that is, [AKR at Geotail] = [AKR at IMAGE] OR [AKR at Cluster‐3]. These observations would mean that AKR breakup is not always Figure 2. Simultaneous and identical AKR spectrograms observed by (a) Geotail (interplanetary space),
(b) IMAGE (Northern Hemisphere), and (c) Cluster‐3 (Southern Hemisphere) satellites on 20 August 2003. The horizontal white line in Figure 2a indicates 80 kHz, which is the upper frequency limit of IMAGE and Cluster spectrograms.
MORIOKA ET AL.: ON THE SIMULTANEITY OF SUBSTORM ONSET A04211 A04211
synchronized between two hemispheres, and that AKR breakup, that is, abrupt breakout of field‐aligned accelera-tion, sometimes takes place independently at one hemi-sphere. Note that the rather continuous emissions below 40 kHz observed at the three satellites could be continuum radiation [Gurnett, 1975; Décréau et al., 2001].
2.3. The 3 June 2003 Event
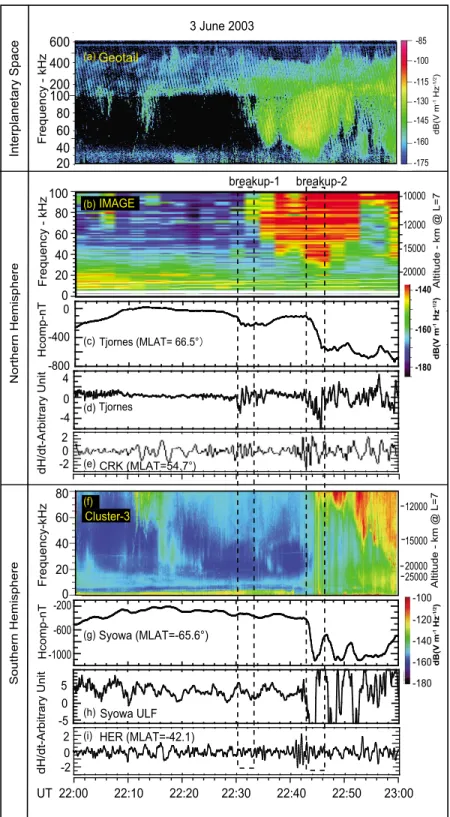
[19] Interhemispheric substorm events on 3 June 2003
were investigated in detail to verify the one‐sided substorm or delayed onset between the two hemispheres. Figure 4a is a spectrogram from Geotail in the frequency range from 20 to 600 kHz. LF‐AKR below 100 kHz appeared around 2230 UT and continued thereafter for at least 30 min, which indicates a series of substorm onsets. Figure 4b is a spec-trogram below 100 kHz observed by IMAGE. The observed AKR is attributed to be from the northern auroral regions because of the satellite location in the northern AKR illu-mination zone (see Figure 1). An AKR breakup happened around 2230 UT (labeled as breakup‐1 in Figure 4), indi-cating the substorm onset. The lowermost frequency of the AKR breakup was about 60 kHz at the onset, which became lower with time. The estimated AKR source altitude along the L = 7 field line is shown in the right ordinate of Figure 4b. The lowermost frequency of the expanded AKR (∼60 kHz) at the onset indicates that the field‐aligned acceleration region expanded up to 12000 km at the sub-storm onset. The H‐component magnetogram at the
pre-midnight station of Tjornes in Iceland (MLAT = 66.5°, MLONG = 72.0°, midnight(MLT) = 2347 UT) in Figure 4c showed a relatively small negative bay (∼200 nT) at breakup‐1. Figure 4d is the geomagnetic pulsation record (dH/dt) at Tjornes. At around 2230 UT, the dH/dt signal showed high‐latitude Pi 2 pulsation almost simultaneously with the AKR breakup within the accuracy of the time reso-lution of the IMAGE spectrogram. The midlatitude pulsa-tion data at Crooktree (CRK: MLAT = 54.7°, MLONG = 78.4°) also showed a Pi 2 onset at breakup‐1 (Figure 4e).
[20] About 12 min after breakup‐1, the second high‐
latitude Pi 2 (Figure 4d) appeared at 2242 UT (labeled as breakup‐2). This high‐latitude Pi 2 had a larger amplitude than the previous one with the gradually decreasing quasi‐ DC component, which is the typical signature of substorm Pi 2 at the onset site [Morioka et al., 2009]. The IMAGE spectrogram (Figure 4b) showed another sudden intensifi-cation at breakup‐2, extending its lowest frequency to a lower level, indicating the second buildup of the high‐ altitude acceleration region up to 18,000 km. This breakup‐2 also corresponded well with the Tjornes second negative bay (Figure 4c) as well as the second midlatitude Pi 2 at CRK (Figure 4e).
[21] From these coincidences between the AKR breakup,
high‐latitude Pi 2, and related magnetic variations in the Northern Hemisphere, one might conclude that the substorm happened twice at around 2230 (breakup‐1) and 2242 UT (breakup‐2). However, AKR and magnetic field data in the Figure 3. Simultaneous but unidentifiable AKR spectrograms observed by (a) Geotail (interplanetary
space), (b) IMAGE (Northern Hemisphere), and (c) Cluster‐3 (Southern Hemisphere) satellites on 25 June 2003. The blue, red, and yellow tags indicate AKR observations in both Northern and Southern Hemi-spheres, in only the Northern Hemisphere, and in only the Southern Hemisphere, respectively. The hor-izontal white line in Figure 3a indicates 80 kHz, which is the upper frequency limit of the IMAGE and Cluster‐3 spectrogram.
Figure 4. One‐sided substorm in the Northern Hemisphere (vertical dashed rectangle labeled “breakup‐1”) and interhemispheric substorms (vertical dashed rectangle labeled“breakup‐2”) on 3 June 2003. (a) Spec-trogram from Geotail. (b) SpecSpec-trogram from IMAGE in the Northern Hemisphere. Spectra above 30 kHz are AKR. The right ordinate shows the source altitude of AKR along the L = 7 field line. (c) H‐component magnetic field at Tjornes. (d) Geomagnetic pulsation at Tjornes. (e) Northern midlatitude geomagnetic pulsation at Crooktree (CRK). (f) Spectrogram from Cluster‐3 in the Southern Hemisphere. (g) H‐component magnetic field at Syowa. (h) Geomagnetic pulsation at Syowa. (i) Southern midlatitude geomagnetic pulsation at Hermanus (HER).
MORIOKA ET AL.: ON THE SIMULTANEITY OF SUBSTORM ONSET A04211 A04211
Southern Hemisphere showed rather complicated features. Figure 4f is a spectrogram from the Cluster‐3 satellite. The spacecraft location (see label CL:6/3 in Figure 1) was suit-able for sensing only southern AKR. It is, however, obvious that no AKR was observed in the Southern Hemisphere cor-responding to the first northern AKR breakup (breakup‐1). Magnetogram and dH/dt data at Syowa in Antarctica (MLAT = −66.3°, MLONG = 72.2°, midnight (MLT) = 2355 UT, very close to the nominal conjugate of Tjornes (DMLAT = 0.01°, DMLT = 0.1)) and at the midlatitude station Hermanus (HER: MLAT = −35.0°, MLONG = 84.0°) also showed no substorm signatures of negative bay and Pi 2 pulsations corresponding to breakup‐1, as seen in Figures 4g–4i. These imply a one‐sided substorm occurred at breakup‐1 in the Northern Hemisphere. On the other hand, at breakup‐2, AKR breakup, negative bay, and Pi 2 pulsations were observed simultaneously with those in the northern auroral region (Figures 4f–4i). The apparent time difference between the northern and southern AKR break-ups might be partly due to the relatively coarse time reso-lution of the IMAGE spectrogram and partly due to the time delayed breakups of themselves as will be demonstrated later. The low‐frequency component of the southern AKR seems to extend to the very low frequency range down to 10 kHz. This is due to the limited dynamic range of the on board spectrum analyzer [Décréau et al., 1997]. AKR signal is so strong that time samples are truncated when digitized and transformed to flat frequency spectra. The magnetic latitude and longitude of ground stations and those which will appear in the following are plotted by black circles in Figure 5. The black triangle in Figure 5 indicates the onset UT of the 3 June event.
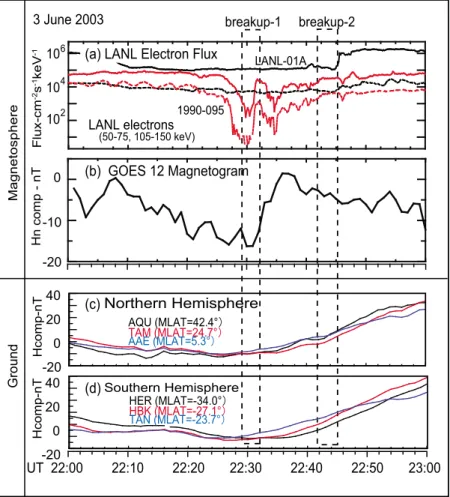
[22] It is very important to note that the magnetosphere
showed a substorm signature even at the one‐sided substorm
in the Northern Hemisphere (breakup‐1). Figure 6 shows energetic electron fluxes (Figure 6a) and radial component of the magnetic field at the synchronous orbit (Figure 6b), and middle‐ and low‐latitude magnetograms (Figures 6c and 6d) for the same period as in Figure 4. The black and red lines in Figure 6a are electron fluxes observed by the LANL‐01A (local midnight = ∼2310 UT) and 1990–095 (local midnight = ∼0220 UT) satellites, respectively. The energies of the fluxes are 50–75 (solid line) and 105–150 keV (dotted line). At the first substorm (breakup‐1), electron fluxes at the 1990–095 satellite showed a steep increase after a gradual decrease, suggesting that a substorm onset occurred in the midnight region around 2230 UT after the thinning of the plasma sheet [Baker and McPherron, 1990]. The magnetic variation at synchronous orbit also showed a signature of substorm onset around breakup‐1. The Hn component of the magnetic field (earthward component in the satellite orbital plane, Figure 6b) at GOES 12 (local midnight = ∼0500 UT) showed a sudden increase around 2230 (breakup‐1) after a gradual decrease starting from, at least, 2208 UT. This also suggests a magnetospheric sub-storm onset around breakup‐1 after the stretching of the Earth’s magnetic field.
[23] The dipolarization/magnetospheric substorm would
be manifested in the middle‐ and low‐latitude magneto-grams as a positive bay in both hemispheres, because the positive bay should be a result of tail‐current reduction. Magnetogram examination showed that the middle‐ and low‐latitude H component (Figure 6c) in the northern night hemisphere at L’Aquila (AQU: MLAT = 42.4°, MLONG = 85.5°), Tamanrasset (TAM: MLAT = 24.7°, MLONG = 81.8°), and Addis Ababa (AAE: MLAT = 5.3°, MLONG = 111.8°) began a positive excursion at around 2230 UT, indicating the positive bay at breakup‐1. Southern middle‐ and low‐ latitude magnetograms at HER, Hartebeesthoek (HBK: MLAT = −27.1°, MLONG = 99.4°), and Antananarivo (TAN: MLAT =−23.7°, MLONG = 115.8°) in Figure 6d also showed almost simultaneous positive excursions with the northern magnetograms at breakup‐1, although the southern polar magnetic variations (negative bay and Pi2) and AKR showed no response to the northern substorm (breakup‐1). These confirm that the magnetospheric sub-storm occurred at breakup‐1 with the one‐sided auroral breakup in the Northern Hemisphere.
2.4. The 29 April 2003 Event
[24] Another example in which northern and southern M‐I
coupling regions showed quite different responses to a substorm is illustrated in Figure 7. Figure 7a shows the spectrogram on 29 April 2003, observed by the Geotail satellite in the magnetotail (radial distance ∼ 30.6 RE,
MLAT =−6.9–−4.1°, MLT = ∼23.7 h,) where AKR source regions in both hemispheres were visible. The spectrogram demonstrates active AKR‐breakup events after an activation of MF‐AKR (low‐altitude AKR) from about 0520 UT; intense LF‐AKR below 100 kHz (high‐altitude AKR) broke out intermittently from about 0530 to 0608 UT, showing the onset of a substorm. Comparing this Geotail spectrogram with northern (IMAGE: Figure 7b) and southern (Cluster‐3: Figure 7f) ones, it can be proved that high‐altitude accelera-tion broke out and developed up to an altitude of 18000 km only in the northern auroral region. The southern AKR Figure 5. Magnetic latitude and longitude plot of
geomag-netic observatories for the event on 3 June 2003 (solid circles) and for the event on 29 April 2003 (open circles). The solid and open triangles indicate the start times of the 3 June 2003 event and the 29 April 2003 event in UT, respectively. AQU, L’Aquila; TAM, Tamanrasset; AAE, Addis Ababa; TAN, Antananarivo; HBK, Hartebeesthoek; IQA, Iqaluit; OTT, Ottawa; SJG, San Juan; TRW, Trelew; M67–292 and M88–316, Antarctica.
showed little activity, at least below 80 kHz, whereas the northern LF‐AKR was almost identical to that of Geotail. Only very weak and short AKR in the 80–50 kHz region was detected at Cluster around 0540 UT. Some spiky ver-tical spectra from 0554 to 0610 UT in the Cluster‐3 spec-trogram are attributed to be the instrumental modulation due to the intense VLF emissions.
[25] Geomagnetic responses in the Northern Hemisphere
almost corresponded to the northern AKR. At the acti-vation of MF‐AKR (around 0520 UT; blue rectangle), the H‐component magnetogram (Figure 7e; bold line) and geomagnetic pulsation (Figure 7c) at the auroral station Iqaluit (IQA; MLAT = 72.6°, MLONG = 14.5°, midnight (MLT) = 0408 UT) showed the signature of a pseudo‐ substorm. This is consistent with conclusion reached by Morioka et al. [2010], who claimed that the activation of low‐altitude acceleration corresponds to pseudo‐substorms. The midlatitude Pi 2 pulsation at Ottawa (OTT; MLAT = 55.7°, MLONG = 1.0°) in Figure 7d and the positive bay in the low‐latitude station San Juan (SJG; MLAT = 28.65°, MLONG = 6.1°) in Figure 7e (blue trace) were also con-current with the onset of this pseudo‐substorm (the magnetic
latitude and longitude of stations referred to this event are plotted with white circles in Figure 5). The sudden breakout of LF‐AKR (the high‐altitude acceleration) at 0530 UT (yellow rectangle) indicates the onset of a full substorm, accompanying the sharp negative bay and large amplitude Pi 2 pulsation at IQA (Figures 7c and 7e).
[26] In contrast, in the Southern Hemisphere, magnetic
variations at the nightside auroral station in Antarctica (M88–316; MLAT = −72.1°, MLONG = 19.6°, midnight (MLT) = 0330 UT) showed different variations from those of the Northern Hemisphere; gradual negative bay (Figure 7i, bold line) and long‐period (more than 300 s) pulsation (Figure 7g) appeared at around 0525 UT (red rectangle). Although the low‐altitude field‐aligned acceler-ation dynamics in the southern auroral region was not able to look at owing to the lack of AKR spectra above 80 kHz in the Cluster observation, it is possible to assume that the southern field‐aligned acceleration was not well activated and the resultant substorm did not develop into the breakup but developed into the delayed and gradual westward electrojet enhancement resulting in the broad negative bay.
Figure 6. Substorm signatures in the magnetosphere and on the ground on 3 June 2003. (a) Electron flux at 50–75 keV (solid curve) and 105–150 keV (dotted curve) observed at synchronous orbit. The black and red curves are fluxes from LANL‐01A and 1990–095 satellites, respectively. (b) Hn component of mag-netic field at GOES 12 satellite. (c) H‐component magmag-netic field at northern middle and low latitudes (AQU, TAM, and AAE). (d) H‐component magnetic field at southern middle and low latitudes (HER, HBK, and TAN).
MORIOKA ET AL.: ON THE SIMULTANEITY OF SUBSTORM ONSET A04211 A04211
[27] Note that only the low‐latitude positive bay at Trelew
(TRW; MLAT = −29.9, MLONG = 4.9) in Figure 7i showed a concurrent start with that of the Northern Hemi-sphere around 0520 UT. This strongly indicates that the tail current reduction in the magnetosphere began concurrently with the northern pseudo‐substorm (blue rectangle). These features of the 29 April event suggest that the substorm current wedge was linked much tightly through the northern
auroral ionosphere and caused a kind of one‐sided substorm onset.
3.
Conjugate Auroral Substorm: The 19
September 2006 Event
[28] A campaign observation of conjugate auroral
phe-nomena between the nearly conjugate pair stations of
Husafell in Iceland (MLAT = 65.3°, MLONG = 67.3°, midnight (MLT) = 0010 UT) and Syowa in Antarctica [Sato et al., 2005] was carried out around the autumnal equinox in 2006. The geographic distance between Husafell and the nominal conjugate point of Syowa is about 258 km which is inside the field of view of all‐sky cameras, and the differ-ence in magnetic latitude (DMLat) and magnetic local time
(DMLT) between two points are 1.1° and 0.4 h, respec-tively. The all‐sky cameras at both stations detected an auroral breakup at the two stations on 19 September 2006. Keograms (l = 427.8 nm) in Figures 8b and 8c derived from the all‐sky camera data, show a conjugate auroral breakup with poleward expansion around 2245 to 2250 UT, which suddenly appeared in the equatorward moving growth‐ Figure 8. Magnetograms and keograms for simultaneous substorm onset between northern and southern
conjugate stations on 19 September 2006. (a) H‐component magnetic field variation and geomagnetic pulsation at Husafell. (b) Keogram at Husafell. (c) Keogram at Syowa. (d) H‐component magnetic field variation and geomagnetic pulsation at Syowa.
Figure 7. One‐sided substorm in the Northern Hemisphere on 29 April 2003. (a) Spectrogram from Geotail in the mag-netotail. The right ordinate shows the source altitude of AKR along the L = 7 field line. The horizontal white line indicates 80 kHz, which is the upper frequency limit of the IMAGE and Cluster spectrograms. The color code of AKR intensity is the same as that in Figure 2a. (b) Spectrogram from IMAGE in the Northern Hemisphere. (c) Geomagnetic pulsation at IQA. (d) Northern midlatitude geomagnetic pulsation at OTT. (e) H‐component magnetic field at IQA (bold curve, left ordinate) and at low‐latitude station of SJG (blue curve, right ordinate). (f) Spectrogram from Cluster‐3 in the Southern Hemisphere. (g) Premidnight geomagnetic pulsation at M88–316. (h) Southern midlatitude geomagnetic pulsation at M67–292. (i) H‐component magnetic field at M88–316 (bold curve, left ordinate) and at low‐latitude station of TRW (blue curve, right ordinate). The blue, yellow, and green rectangles indicate the start of a pseudo‐substorm, full substorm in the Northern Hemisphere, and pseudo‐breakup in the Southern Hemisphere, respectively.
MORIOKA ET AL.: ON THE SIMULTANEITY OF SUBSTORM ONSET A04211 A04211
phase arcs at both the Husafell and Syowa stations. The magnetograms at both stations (Figures 8a and 8d) show that the amplitude of negative bay was rather small, but temporal conjugacy between the two stations was quite good because overall variations in the magnetograms and pulsation (dH/dt) records were almost in phase. AE indices
showed isolated small maximum of∼90 nT between 2220– 2240 UT.
[29] Østgaard et al. [2004, 2007] showed that the relative
displacement of geomagnetic conjugacy (DMLT) can be expressed by a linear function of the clock angle of IMF. In the case of the present observation, the IMF components of Figure 9. Conjugate observation of auroral breakup on the ground. (a) Light curves of breakup aurora
(l = 427.8 nm) at Husafell in Iceland (blue) and Syowa in Antarctica (yellow). (b) H‐component mag-netograms at Husafell (left ordinate) and Syowa (right ordinate). (c) Geomagnetic pulsation at Husafell (blue) and Syowa (black). (d and e) Short‐period Pi pulsations at Husafell and Syowa. (f and g) Midlat-itude magnetograms at Northern and Southern Hemispheres. The gray, yellow, and blue rectangles indi-cate the starts of initial brightening at both hemispheres, auroral breakup at Syowa, and auroral breakup at Husafell, respectively.
Bx, By, and Bz for 30 min before 2230 UT were about−2, 1, and −0.5 nT, respectively. Thus, the clock angle is obtained to be about 116°, and resultant displacement of conjugacy is derived, according to Østgaard et al.’s [2007] formula, to be DMLT∼1 h (Conjugate point of Syowa shifted dawnward of Husafell in magnetic longitude), while present observation showed better conjugacy between Syowa and Husafell. This may be partly because the Bx component was so dominant in IMF (4 times as large as Bz) that the Østgaard’s formula might not be applicable.
[30] The blue and yellow traces in Figure 9a show the area‐
integrated light curves of conjugate aurora (l = 427.8 nm) at Husafell and Syowa during the 20 min period around 2245 UT. The light curve at Syowa showed a sudden rise at 2245:00 UT, indicating an auroral breakup, while that at Husafell showed a rapid increase at 2247 UT. It is obvious that the auroral breakup in the Southern Hemisphere pre-ceded that of the Northern Hemisphere by about 2 min. This time difference is much longer than the possible difference of Alfvén transit time along the northern and southern auroral field lines even if the field‐aligned plasma density was considerably different between the two hemispheres owing to transient or seasonal effects. Thus, the delayed onset between the two hemispheres suggests the indepen-dent activation of auroral acceleration in each hemisphere at the substorm onset.
[31] This delayed onset is further confirmed by examining
Pi 1 pulsations between two hemispheres. Figures 9d and 9e are the filtered shorter‐period pulsation components; the filtered period band is 1 < T < 10 s. It should be noted that the shorter‐period component at each site showed sudden amplitude intensification almost simultaneously with each auroral breakup, as shown by the yellow and blue rec-tangles, which were consequently separated by 2 min. This is consistent with the second stage of the substorm onset (breakup) [Morioka et al., 2010] and with previous reports [Milling et al., 2008; Murphy et al., 2009] indicating that the shorter‐period pulsation is suddenly enhanced at the auroral breakup, that is, commencement of the poleward expansion. [32] The substorm of interest manifested, furthermore,
interesting prebreakup (initial brightening) features. Figures 9b and 9c are the magnetic field and dH/dt records from Figures 8a and 8d, indicating that a series of magnetic field variations and long‐period pulsations had started around 2240 UT (gray rectangle), about 5 min before the auroral breakup at Syowa (2245:00 UT). Note that these variations were almost concurrent and in phase between the two con-jugate stations. These perturbations of magnetic field prior to the auroral breakup correspond to the first stage of sub-storm onset accompanying the enhancement of low‐altitude acceleration region and FAC as claimed by Morioka et al. [2010]. This first stage of the substorm onset is also con-firmed by the light curves in Figure 9a, where faint activity of conjugate aurora had started at around 2240 UT, that is the initial brightening. Midlatitude magnetograms in the Northern (CRK; Figure 9f) and Southern (HER; Figure 9g) Hemispheres showed an almost simultaneous start of the positive bay with the magnetic perturbations in the auroral zone (pseudo‐substorm from about 2240 UT). The in‐phase positive‐bay perturbations at the midlatitudes indicate the tail current reduction in the plasma sheet.
[33] It is also interesting to note that long‐period
pulsa-tions (about 90 s of period) were in phase between two hemispheres prior to the auroral breakup (first stage; 2241– 2245 UT). The pulsations are considered to be generated in the inner plasma sheet possibly owing to the arrival of the fast flow bursts from the midtail region and the resultant intensification of FAC [Haerendel, 1992; Shiokawa et al., 1998] and/or low‐frequency plasma instability [Cheng, 2004; Saito et al., 2008].
4.
Summary and Conclusions
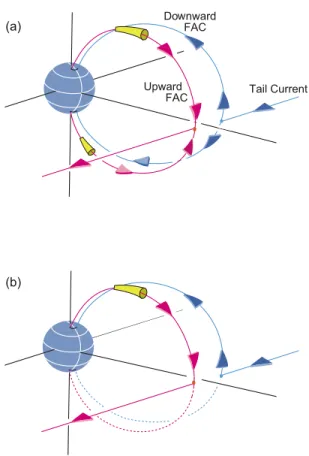
[34] The simultaneous observations of AKR from the
Northern and Southern Hemispheres showed that cases exist in which the buildup of field‐aligned acceleration occurs in one hemisphere and not in the other hemisphere (one‐sided auroral breakup). This indicates that a substorm does not always complete its current system by connecting the cross‐ tail current with both the northern and southern ionospheric currents (see Figure 10), and suggests that the buildup of the field‐aligned acceleration region does not result simply from the magnetospheric process at the substorm onset but is finally determined by the auroral upper ionosphere of each hemisphere independently. In other words, substorm, that is, the auroral breakup accompanied with the AKR breakup, is finally ignited in the M‐I coupling region.
Figure 10. Schematic illustration of the substorm current wedge for (a) simultaneous onset between two hemispheres and (b) one‐sided substorm in the Northern Hemisphere. The yellow tubes on the upward current indicate high‐ altitude field‐aligned acceleration regions.
MORIOKA ET AL.: ON THE SIMULTANEITY OF SUBSTORM ONSET A04211 A04211
[35] Conjugate auroral observation showed a case in which
the auroral breakup was not simultaneous between the two hemispheres by a few minutes, which is significantly longer than the possible difference due to the Alfvén transit time. This also suggests that the auroral ionosphere controls the auroral breakup in each hemisphere.
[36] The simultaneity of substorm onset between two
hemispheres would depend on the plasma state in the M‐I coupling region. Especially, the electron density profile in the M‐I coupling region, where plasma cavity develops with seasonal dependence [Sato, 1998; Kitamura et al., 2010], would play an important role, because the field‐aligned acceleration is sensitive to the electron density distribution along the auroral field line [Morooka and Mukai, 2003; Morioka et al., 2010]. Moreover, the difference of the iono-spheric conductivity profile between two hemispheres would be essential for development of the M‐I coupling process at the substorm onset [Green et al., 2004]. Thus, it is expected that simultaneity of substorm onset between two hemispheres shows the seasonal dependence [Kumamoto and Oya, 1998] or dipole tilt dependence [Green et al., 2004], such as the preferential occurrence of one‐sided substorm in winter solstice and the delayed substorm onset favored over the summer hemisphere.
[37] There are currently two scenarios for the triggering of
a substorm; the near‐Earth neutral line (NENL/outside‐in model [e.g., Baker et al., 1996; Shiokawa et al., 1998; Angelopoulos et al., 2008] and the current disruption (CD/ inside‐out) model [e.g., Lui et al., 1992; Erickson et al., 2000; Lui et al., 2008]. On the other hand, the evidence in this study indicates that the auroral upper ionosphere may finally control and/or ignite the auroral breakup to complete the substorm onset, which has been discussed by Lui [1996]. [38] Recently, a new substorm scenario was proposed by
Morioka et al. [2010] claiming that plasma flow burst drives FAC in the near‐Earth plasma sheet and that the FAC enhances the low‐altitude acceleration (and excites MF‐AKR) in the M‐I coupling region. Then the increasing field‐ aligned current induces a second acceleration at the higher altitude as a consequence of current/current‐driven instabilities (and excites LF‐AKR). This scenario suggests that a substorm is finally ignited in the auroral M‐I coupling region, and predicts that substorms can sometimes be ignited in one hemisphere or be delayed between two hemispheres depending on the ionospheric conditions in both hemi-spheres. The present observations seem to favor this scenario.
[39] Acknowledgments. We are grateful to Y. Miyashita for his helpful comments and discussions. The geomagnetic data at Antarctica (M67–292 and M88–316) were kindly provided by the British Antarctica Survey of the National Environment Research Council, UK. We thank the LANL SOPA team at the Los Alamos National Laboratory for the mag-netometer data. SAMNET is operated by Lancaster University and is funded by STFC. The authors are indebted to the Cluster Active Archive for publicly available WHISPER data. We also wish to thank the Geotail PWI team (Principal Investigator: H. Kojima). We are grateful to the INTERMAGNET and MAGDAS teams for their observations and database construction. We acknowledge the use of the UML BinBrowser for the IMAGE/RPI data. B.W.R. was supported by NASA grant NNX07AG38G. The GOES 12 data were provided by H. Singer at NOAA. This work was supported by Grant‐in‐Aid for Scientific Research (22340145) from the Ministry of Education Culture, Sports, Science, and Technology (MEXT), Japan.
[40] Robert Lysak thanks the reviewers for their assistance in evaluat-ing this paper.
References
Akasofu, S.‐I. (1972), Magnetospheric substorm: A model, in Solar Terres-trial Physics, Part III, edited by E. R. Dyer, p. 131, D. Reidel, Norwell, Mass.
Angelopoulos, V., et al. (2008), Tail reconnection triggering substorm onset, Science, 321, 931–935, doi:10.1126/science.1160495.
Baker, D. N., and R. L. McPherron (1990), Extreme energetic particle decrease near geostationary orbit: A manifestation of current diversion within the inner plasma sheet, J. Geophys. Res., 95, 6591–6599, doi:10.1029/JA095iA05p06591.
Baker, D. N., T. I. Pulkkinen, V. Angelopoulos, W. Baumjohann, and R. L. McPherron (1996), Neutral line model of substorms: Past results and present view, J. Geophys. Res., 101, 12,975–13,010, doi:10.1029/ 95JA03753.
Benson, R. F. (1982), Harmonic auroral kilometric radiation of natural ori-gin, Geophys. Res. Lett., 9, 1120–1123, doi:10.1029/GL009i009p01120. Chaston, C. C., et al. (2005), Energy deposition by Alfvén waves into the dayside auroral oval: Cluster and FAST observations, J. Geophys. Res., 110, A02211, doi:10.1029/2004JA010483.
Cheng, C. Z. (2004), Physics of substorm growth phase, onset and dipolarization, Space Sci. Rev., 113, 207–270, doi:10.1023/B:SPAC. 0000042943.59976.0e.
Décréau, P. M. E., et al. (1997), Whisper, a resonance sounder and wave analyser: Performances and perspectives for the Cluster mission, Space Sci. Rev., 79, 93–105, doi:10.1023/A:1004931326404.
Décréau, P. M. E., et al. (2001), Early results from the Whisper instrument on Cluster: An overview, Ann. Geophys., 19, 1241–1258, doi:10.5194/ angeo-19-1241-2001.
de Feraudy, H., J. Hanasz, R. Schreiber, G. Parks, M. Brittnacher, S. Perraut, J. A. Sauvaud, F. Lefeuvre, and M. M. Mogilevsky (2001), AKR bursts and substorm field line excitation, Phys. Chem. Earth, Part C, 26, 151–159.
Desch, M. D., and W. M. Farrell (2000), Terrestrial LF burst: Escape paths and wave intensification, in Radio Astronomy at Long Wavelengths, Geophys. Monogr. Ser., vol. 119, edited by R. G. Stone et al., pp. 205–211, AGU, Washington, D. C.
Ergun, R. E., et al. (1998), FAST satellite wave observations in the AKR source region, Geophys. Res. Lett., 25, 2061–2064, doi:10.1029/ 98GL00570.
Erickson, G. M., N. C. Maynard, W. J. Burke, G. R. Wilson, and M. A. Heinemann (2000), Electromagnetics of substorm onsets in the near‐ geosynchronous plasma sheet, J. Geophys. Res., 105, 25,265–25,290, doi:10.1029/1999JA000424.
Fairfield, D. H., et al. (1999), Earthward flow bursts in the inner magneto-tail and their relation to auroral brightening, AKR intensifications, geo-synchronous particle injections and magnetic activity, J. Geophys. Res., 104, 355–370, doi:10.1029/98JA02661.
Fillingim, M. O., G. K. Parks, H. U. Frey, T. J. Immel, and S. B. Mende (2005), Hemispheric asymmetry of the afternoon electron aurora, Geophys. Res. Lett., 32, L03113, doi:10.1029/2004GL021635. Frank, L. A., and J. B. Sigwarth (2003), Simultaneous images of the
north-ern and southnorth-ern auroras from the Polar spacecraft: An auroral substorm, J. Geophys. Res., 108(A4), 8015, doi:10.1029/2002JA009356. Fujii, R., and T. Iijima (1987), Control of the ionospheric conductivities on
large‐scale Birkeland current intensities under geomagnetic quiet condi-tions, J. Geophys. Res., 92, 4505–4513, doi:10.1029/JA092iA05p04505. Green, J. L., D. A. Gurnett, and S. D. Shawhan (1977), The angular distri-bution of auroral kilometric radiation, J. Geophys. Res., 82, 1825–1838, doi:10.1029/JA082i013p01825.
Green, J. L., S. Boardsen, L. Garcia, S. F. Fung, and B. W. Reinisch (2004), Seasonal and solar cycle dynamics of the auroral kilometric radi-ation source region, J. Geophys. Res., 109, A05223, doi:10.1029/ 2003JA010311.
Gurnett, D. (1974), The Earth as a radio source: Terrestrial kilometric radi-ation, J. Geophys. Res., 79, 4227–4238, doi:10.1029/JA079i028p04227. Gurnett, D. (1975), The Earth as a radio source: The nonthermal contin-uum, J. Geophys. Res., 80, 2751–2763, doi:10.1029/JA080i019p02751. Haerendel, G. (1992), Disruption, ballooning or auroral avalanche: On the cause of substorms, in Substorms 1: Proceedings of the First Interna-tional Conference on Substorms, Kiruna, Sweden, 23–27 March 1992, pp. 417–420, Eur. Space Agency, Paris.
Hanasz, J., H. de Feraudy, R. Schreiber, G. Parks, M. Brittnacher, M. M. Mogilevsky, and T. V. Romantsova (2001), Wideband bursts of auroral
kilometric radiation and their association with UV auroral bulges, J. Geo-phys. Res., 106, 3859–3871, doi:10.1029/2000JA900098.
Hashimoto, K. (1984), A reconciliation of propagation modes of auroral kilometric radiation, J. Geophys. Res., 89, 7459–7466, doi:10.1029/ JA089iA09p07459.
Hashimoto, K., and W. Calvert (1990), Observation of the Z mode with DE 1 and its analysis by three‐dimensional ray tracing, J. Geophys. Res., 95, 3933–3942, doi:10.1029/JA095iA04p03933.
Kaiser, M. L., and J. K. Alexander (1977), Relationship between auroral substorms and the occurrence of terrestrial kilometric radiation, J. Geo-phys. Res., 82, 5283–5286, doi:10.1029/JA082i032p05283.
Kaiser, M. L., M. D. Desch, W. M. Farrell, J.‐L. Steinberg, and M. J. Reiner (1996), LF band terrestrial radio bursts observed by Wind/ WAVES, Geophys. Res. Lett., 23, 1283–1286, doi:10.1029/95GL03664. Kasaba, Y., H. Matsumoto, Y. Omura, R. R. Anderson, T. Mukai, Y. Saito, T. Yamamoto, and S. Kokubun (2000), Statistical studies of plasma waves and backstreaming electrons in the terrestrial electron foreshock observed by Geotail, J. Geophys. Res., 105, 79–103, doi:10.1029/ 1999JA900408.
Kitamura, N., Y. Nishimura, T. Ono, A. Kumamoto, A. Ahinbori, A. Matsuoka, and M. R. Hairston (2010), Temporal variations and spatial extent of the electron density enhancements in the polar magneto-sphere during geomagnetic storms, J. Geophys. Res., 115, A00J02, doi:10.1029/2009JA014499.
Knight, S. (1973), Parallel electric fields, Planet. Space Sci., 21, 741–750, doi:10.1016/0032-0633(73)90093-7.
Kumamoto, A., and H. Oya (1998), Asymmetry of occurrence‐frequency and intensity of AKR between summer polar region and winter polar region sources, Geophys. Res. Lett., 25, 2369–2372, doi:10.1029/ 98GL01715.
Liou, K., C.‐I. Meng, A. T. Lui, and P. T. Newell (2000), Auroral kilometric radiation at substorm onset, J. Geophys. Res., 105, 25,325–25,331, doi:10.1029/2000JA000038.
Lui, A. T. Y. (1996), Current disruption in the Earth’s magnetosphere: Observations and models, J. Geophys. Res., 101, 13,067–13,088, doi:10.1029/96JA00079.
Lui, A. T. Y., et al. (1992), Current disruption in the near‐Earth neutral sheet region, J. Geophys. Res., 97, 1461–1480, doi:10.1029/91JA02401. Lui, A. T. Y., et al. (2008), Determination of the substorm initiation region from a major conjunction interval of THEMIS satellites, J. Geophys. Res., 113, A00C04, doi:10.1029/2008JA013424.
Lyons, L. R. (1981), The field‐aligned current versus electric potential rela-tion and auroral electrodynamics, in Physics of Auroral Arc Formarela-tion, Geophys. Monogr. Ser., vol. 25, edited by S.‐I. Akasofu and J. R. Kan, pp. 252–259, AGU, Washington, D. C.
Matsumoto, H., I. Nagano, R. R. Anderson, H. Kojima, K. Hashimoto, M. Tsutsui, T. Okada, I. Kimura, Y. Omura, and M. Okada (1994), Plasma wave observations with GEOTAIL spacecraft, J. Geomagn. Geoelectr., 46, 59–95.
McPherron, R. L., C. T. Russell, and M. P. Aubry (1973), Satellite studies of magnetospheric substorms on August 15, 1968: 9. Phenomenological model for substorms, J. Geophys. Res., 78, 3131–3149, doi:10.1029/ JA078i016p03131.
Mende, S. B., C. W. Carlson, H. U. Frey, L. M. Peticolas, and N. Ostgaard (2003), FAST and IMAGE‐FUV observations of a substorm onset, J. Geophys. Res., 108(A9), 1344, doi:10.1029/2002JA009787. Meng, C.‐I. (1978), Electron precipitations and polar auroras, Space Sci.
Rev., 22, 223–300, doi:10.1007/BF00239803.
Milling, D. K., I. J. Rae, I. R. Mann, K. R. Murphy, A. Kale, C. T. Russell, V. Angelopoulos, and S. Mende (2008), Ionospheric localization and expansion of long‐period Pi1 pulsations at substorm onset, Geophys. Res. Lett., 35, L17S20, doi:10.1029/2008GL033672.
Morioka, A., H. Oya, and S. Miyatake (1981), Terrestrial kilometric radia-tion observed by satellite Jikiken (Exos‐B), J. Geomagn. Geoelectr., 33, 37–62.
Morioka, A., Y. Miyoshi, F. Tsuchiya, H. Misawa, T. Sakanoi, K. Yumoto, R. R. Anderson, J. D. Menietti, and E. F. Donovan (2007), Dual structure of auroral acceleration regions at substorm onsets as derived from AKR spectra, J. Geophys. Res., 112, A06245, doi:10.1029/2006JA012186. Morioka, A., et al. (2008), AKR breakup and auroral particle acceleration
at substorm onset, J. Geophys. Res., 113, A09213, doi:10.1029/ 2008JA013322.
Morioka, A., Y. Miyoshi, F. Tsuchiya, H. Misawa, K. Yumoto, G. K. Parks, R. R. Anderson, J. D. Menietti, and F. Honary (2009), Vertical evolution of auroral acceleration at substorm onset, Ann. Geophys., 27, 525–535, doi:10.5194/angeo-27-525-2009.
Morioka, A., et al. (2010), Two‐step evolution of auroral acceleration at substorm onset, J. Geophys. Res., 115, A11213, doi:10.1029/ 2010JA015361.
Morooka, M., and T. Mukai (2003), Density as a controlling factor for sea-sonal and latitudinal variations of the auroral particle acceleration region, J. Geophys. Res., 108(A7), 1306, doi:10.1029/2002JA009786. Murphy, K. R., I. J. Rae, I. R. Mann, D. K. Milling, C. E. J. Watt, L. Ozeke,
H. U. Frey, V. Angelopoulos, and C. T. Russell (2009), Wavelet‐based ULF wave diagnosis of substorm expansion phase onset, J. Geophys. Res., 114, A00C16, doi:10.1029/2008JA013548.
Newell, P., C.‐I. Meng, and K. M. Lyons (1996), Suppression of discrete aurorae by sunlight, Nature, 381, 766–767, doi:10.1038/381766a0. Olsson, A., P. Janhunen, J. Hanasz, M. Mogilevsky, S. Perraut, and J. D.
Menietti (2004), Observational study of generation conditions of sub-storm‐associated low‐frequency AKR emissions, Ann. Geophys., 22, 3571–3582, doi:10.5194/angeo-22-3571-2004.
Østgaard, N., S. B. Mende, H. U. Frey, and T. J. Immel (2004), Interplan-etary magnetic field control of the location of substorm onset and auroral features in the conjugate hemispheres, J. Geophys. Res., 109, A07204, doi:10.1029/2003JA010370.
Østgaard, N., S. B. Mende, H. U. Frey, J. B. Sigwarth, A. Åsnes, and J. M. Weygand (2007), Auroral conjugacy studies based on global imaging, J. Atmos. Sol. Terr. Phys., 69, 249–255, doi:10.1016/j.jastp.2006.05.026. Pottelette, R., R. A. Treumann, and M. Berthomier (2001), Auroral plasma turbulence and cause of auroral kilometric radiation fine structure, J. Geophys. Res., 106, 8465–8476, doi:10.1029/2000JA000098. Reinisch, B. W., et al. (2000), The Radio Plasma Imager investigation on
the IMAGE spacecraft, Space Sci. Rev., 91, 319–359, doi:10.1023/ A:1005252602159.
Reinisch, B. W., X. Huang, P. Song, J. L. Green, S. F. Fung, V. M. Vasyliunas, D. L. Gallagher, and B. R. Sandel (2004), Plasmaspheric mass loss and refilling as a result of a magnetic storm, J. Geophys. Res., 109, A01202, doi:10.1029/2003JA009948.
Saito, M. H., et al. (2008), Ballooning mode waves prior to substorm‐ associated dipolarization: Geotail observations, Geophys. Res. Lett., 35, L07103, doi:10.1029/2008GL033269.
Sato, N., R. Fujii, T. Ono, H. Fukunishi, T. Araki, S. Kokubun, K. Makita, and T. Saemundsson (1986), Conjugacy of proton and electron auroras observed near l = 6.1, Geophys. Res. Lett., 13, 1368–1371, doi:10.1029/GL013i013p01368.
Sato, N., T. Nagaoka, K. Hashimoto, and T. Saemundsson (1998a), Conjugacy of isolated auroral arcs and nonconjugate auroral breakups, J. Geophys. Res., 103, 11,641–11,652, doi:10.1029/98JA00461. Sato, N., M. Morooka, K. Minatoya, and T. Saemundsson (1998b),
Non-conjugacy of pulsating auroral patches near L = 6, Geophys. Res. Lett., 25, 3755–3758, doi:10.1029/1998GL900002.
Sato, N., A. Kadokura, Y. Ebihara, H. Deguchi, and T. Saemundsson (2005), Tracing geomagnetic conjugate points using exceptionally similar synchronous auroras, Geophys. Res. Lett., 32, L17109, doi:10.1029/ 2005GL023710.
Sato, Y. (1998), A study on electron density distributions at high latitude, M.S. thesis, Tohoku Univ., Sendai, Japan.
Shiokawa, K., et al. (1998), High‐speed ion flow, substorm current wedge, and multiple Pi 2 pulsations, J. Geophys. Res., 103, 4491–4507, doi:10.1029/97JA01680.
Stasiewicz, K., et al. (2000), Small‐scale Alfvénic structure in the aurora, Space Sci. Rev., 92, 423–533, doi:10.1023/A:1005207202143. Steinberg, J.‐L., C. Lacombe, and S. Hang (1988), A new component of
terrestrial radio emission observed from ISEE‐3 and ISEE‐1 in the solar wind, Geophys. Res. Lett., 15, 176–179, doi:10.1029/GL015i002p00176. Steinberg, J.‐L., S. Hoang, and J.‐M. Bosqued (1990), Isotropic terrestrial kilometric radiation: A new component of the Earth’s radio emission, Ann. Geophys., 8, 671–685.
Stenbaek‐Nielsen, H. C., and A. Otto (1997), Conjugate auroras and the interplanetary magnetic field, J. Geophys. Res., 102, 2223–2232, doi:10.1029/96JA03563.
Stenbaek‐Nielsen, H. C., T. N. Davis, and N. W. Glass (1972), Relative motion of auroral conjugate points during substorm, J. Geophys. Res., 77, 1844–1858, doi:10.1029/JA077i010p01844.
Stenbaek‐Nielsen, E. M. W., and T. N. Davis (1973), Differences in auroral intensity at conjugate points, J. Geophys. Res., 78, 659–671, doi:10.1029/JA078i004p00659.
Trotignon, J. G., P. M. E. Décréau, J. L. Rauch, E. Le Guirriec, P. Canu, and F. Darrouzet (2003), The Whisper Relaxation Sounder onboard Cluster: A powerful tool for space plasma diagnosis around the Earth, Cosmic Res., Engl. Transl., 41, 345–348, doi:10.1023/A:1025045308666. Wu, C. S., and X. M. Qiu (1983), Emission of second‐harmonic auroral kilometric radiation, J. Geophys. Res., 88, 10,072–10,080, doi:10.1029/ JA088iA12p10072.
Wygant, J. R., et al. (2002), Evidence for kinetic Alfvén waves and parallel electron energization at 4–6 REaltitudes in the plasma sheet boundary
layer, J. Geophys. Res., 107(A8), 1201, doi:10.1029/2001JA900113.
MORIOKA ET AL.: ON THE SIMULTANEITY OF SUBSTORM ONSET A04211 A04211
Zverev, V. L., G. V. Starkov, V. G. Vorobjev, S. V. Leontyev, Y. I. Feldstein, R. D. Elphinstone, J. S. Murphree, and L. L. Cogger (1992), Simultaneous observations of the north and south polar cap aurorae, Geomagn. Aeron., 32, 640–646.
T. Asozu, H. Misawa, A. Morioka, S. Okano, and F. Tsuchiya, Planetary Plasma and Atmospheric Research Center, Tohoku University, Sendai 980‐ 8587, Japan. ([email protected])
P. M. E. Décréau and J. G. Trotignon, Laboratoire de Physique et Chimie de l’Environnement et de l’Espace, F‐45071 Orléans, France.
F. Honary, Department of Physics, Lancaster University, Lancaster LA1 4YW, UK.
A. Kadokura, H. Miyaoka, and N. Sato, National Institute of Polar Research, Tokyo 190‐8518, Japan.
Y. Kasaba, Geophysical Institute, Tohoku University, Sendai 980‐8576, Japan.
Y. Miyoshi, Solar‐Terrestrial Environment Laboratory, Nagoya University, Nagoya 464‐8601, Japan.
G. K. Parks, Space Sciences Laboratory, University of California, Berkeley, CA 94720, USA.
B. W. Reinisch, Center for Atmospheric Research, University of Massachusetts Lowell, Lowell, MA 01854, USA.
K. Yumoto, Space Environment Research Center, Kyushu University, Fukuoka 812‐8581, Japan.