HAL Id: hal-03090331
https://hal.archives-ouvertes.fr/hal-03090331
Submitted on 29 Dec 2020
HAL is a multi-disciplinary open access
archive for the deposit and dissemination of
sci-entific research documents, whether they are
pub-lished or not. The documents may come from
teaching and research institutions in France or
abroad, or from public or private research centers.
L’archive ouverte pluridisciplinaire HAL, est
destinée au dépôt et à la diffusion de documents
scientifiques de niveau recherche, publiés ou non,
émanant des établissements d’enseignement et de
recherche français ou étrangers, des laboratoires
publics ou privés.
To cite this version:
M. Labat, S. Bielawski, A. Loulergue, S. Corde, M-E Couprie, et al.. Interferometry for full temporal
reconstruction of laser-plasma accelerator-based seeded free electron lasers. New Journal of Physics,
Institute of Physics: Open Access Journals, 2020, 22 (1), pp.013051. �10.1088/1367-2630/ab6878�.
�hal-03090331�
PAPER
Interferometry for full temporal reconstruction of laser-plasma
accelerator-based seeded free electron lasers
M Labat1, S Bielawski2, A Loulergue1, S Corde3, M-E Couprie1and E Roussel2
1 Synchrotron SOLEIL, L’Orme des Merisiers, F-91 191, Gif-sur-Yvette, France
2 Univ. Lille, CNRS, UMR 8523—PhLAM—Physique des Lasers Atomes et Molécules, F-59000 Lille, France 3 Laboratoire d’Optique Appliquée, 181 chemin de la Hunière, F-91120, Palaiseau, France
E-mail:[email protected]
Keywords: free electron laser, plasma acceleration, photon diagnostic
Abstract
The spectacular development of Laser-Plasma Accelerators (LPA) appears very promising for a free electron laser application. The handling of the inherent properties of those LPA beams already allowed controlled production of LPA–based spontaneous undulator radiation. Stepping further, we here unveil that the forthcoming LPA–based seeded FELs will present distinctive spatio-spectral distributions. Relying on numerical simulations and simple analytical models, we show how those interferometric patterns can be exploited to retrieve, in single-shot, the spectro-temporal content and source point properties of the FEL pulses.
1. Introduction
Free Electron Lasers (FELs) [1,2] deliver ultrashort, narrow-band and ultrabright pulses down to the hard x-ray range [3–5], enabling breakthrough experiments in chemical, physical, and biological sciences. These light
sources rely on relativistic electron beams wiggling in the periodic magnetic field of an undulator as gain medium. Interacting with the spontaneous radiation of the undulator or an external seed, the electrons experience an energy modulation at the resonance wavelength which is further transformed into a density modulation by dispersive elements. After this ‘lethargy’ [6] phase, the beam density modulation allows the emission of a coherent radiation which can then be exponentially amplified. A saturation is reached when the electrons energy loss is such that the resonance condition is violated, causing a red spectral shift of the FEL line [7,8].
Chicanes as dispersive elements are used to speed up the electron beam energy to density modulation conversion [9,10]. Associated to electron beam energy chirping in the Radio-Frequency Accelerators (RFAs) structures producing those beams and then to frequency chirped seeds, they opened the door to FEL wavelength tunability [11], two-color operation [12], amplitude and phase control [13,14], spectro-temporal shaping [15],
chirped-pulse compression [16,17] and temporal reconstruction [18].
In high-gain FELs [6], the initial radiation can be amplified by several orders of magnitudes up to saturation in one single pass. The gain of those systems is mainly driven by the electron beam properties. This is the reason why first FELs were developed using classical RFAs which presently deliver the requisite high-quality beams. However since those accelerators are typically several hundreds of meters long for a lasing in the x-ray range, the new Laser Plasma Accelerators (LPAs) [19] have been proposed as an alternative towards miniaturized FELs [20].
However from proposal to demonstration, the path is tortuous. In LPAs, the intrinsic large divergence (≈few milliradians) and energy spread (≈few percent) of the electron beam [21,22] dramatically limit the FEL gain. Several techniques can be implemented to reach the mandatory Pierce parameter fel[6] qualifying the FEL gain: use plasma lenses [23–26] and/or high gradient quadrupoles in the immediate vicinity of the LPA source to handle the large divergence [27–29], use a chicane [30,31] or a transverse gradient undulator [32,33] to lower the slice energy spread, and/or use a chromatic matching [34] to synchronize the beam maximum density with the radiation pulse propagation inside the undulator. Few years after the first observation of LPA–based
OPEN ACCESS
RECEIVED 27 September 2019 REVISED 5 December 2019 ACCEPTED FOR PUBLICATION 7 January 2020 PUBLISHED 27 January 2020
Original content from this work may be used under the terms of theCreative Commons Attribution 3.0 licence.
Any further distribution of this work must maintain attribution to the author(s) and the title of the work, journal citation and DOI.
undulator radiation [35–38], significative achievements in terms of electron beam transport and manipulation [39] turned a corner, allowing for control of the synchrotron radiation spectral properties [40]. LPA–based FEL amplification is now within reach at least in the visible or ultra-violet range. To ease this next step, a seeded configuration should be considered, since it enables to speed up the lethargy phase, i.e. requires shorter
undulator lengths and relaxes the transport issues. Given the present LPAs performance, the first demonstration is more likely to be obtained in the low-gain [41] regime as proposed in [42].
The aim of this work is to reveal that those forthcoming LPA–based seeded FELs can present original spatio-spectral distributions that enable the full reconstruction of the temporal FEL pulse. Indeed, under simple conditions, the emitted radiation exhibits a clear red shift with respect to the input seed wavelength, leading to spectral interference fringes between this additional emitted radiation and the input seed. In the case of LPAs, the electron beam energy chirp, i.e. longitudinal sorting in energy, is not induced by the accelerating structure but by a dispersive transport of the high energy spread beam through a chicane. The resulting particles velocity gradient is so steep that the undulator dispersion drives the energy to density modulation conversion while simultaneously stretching the density modulation period (ahead traveling faster than tail particles). This effect is usually negligible on RFA based FELs, even though observed on a self-seeding configuration [43]. In the case of LPA beams however, the stretching is such that the final FEL wavelength can be red shifted by more than one seed linewidth. Due to the low-gain configuration, the red-shifted coherent emission is observed together with the seed, leading to strong interferences in the spectral domain. As in [18], this interferometric pattern can then
be used for temporal reconstruction of the FEL pulses.
This paper is organized as follows. The typical schematic of an LPA–based seeded FEL is recalled in section2
with the specific parameters considered in this study. The numerical simulation principle is also detailed. Section3describes the analytical model developed to explain the red-shift feature. The correlation between the FEL linewidth and the electron beam divergence is then investigated in section4. To reproduce the interference pattern observed in the simulations, we present a double pulse model in section5and use it to achieve a full temporal reconstruction of the FEL pulse in section6.
2. Experimental setup
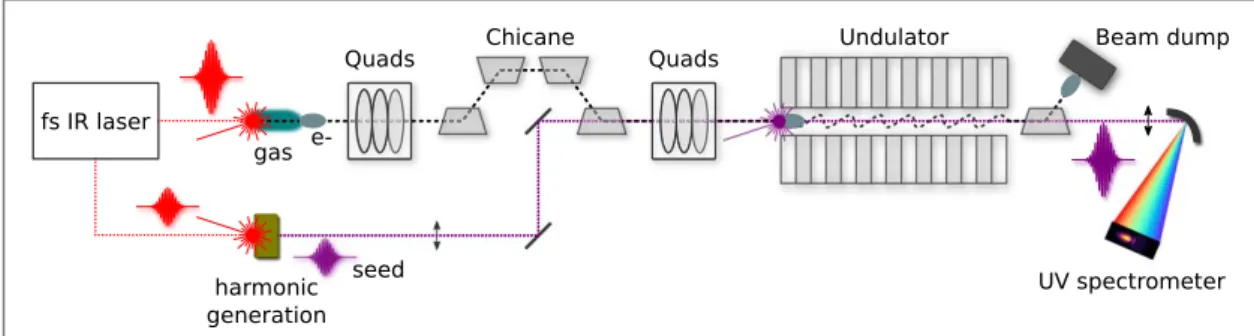
A typical setup for a LPA–based seeded FEL is shown in figure1. In state-of-the-art LPAs, nonlinear plasma waves are driven in a gas by femtosecond pulses of a multi-TW laser system, allowing for the trapping and further acceleration of electron bunches. The properties of the generated electron beams strongly depend on the LPA implementation. We choose a set of parameters (see table1) compatible with the most recent achievements
of the groups targeting both quality and reliability, mandatory for an FEL application [21,42,44–46]. With a short period undulator [47], these typical 200 MeV beams can be used to target the vacuum ultra-violet range. We therefore consider a seed at 160 nm (see table1) generated in gas [48,49] using a branch of the main laser [49]. The electron beam is transported along a dedicated line allowing for a three steps manipulation [34]: refocusing at the LPA exit using high gradient quadrupoles [50], longitudinal stretching and energy chirping
using a chicane and chromatic matching using standard quadrupoles. Locally driving the beam off-axis, the chicane is also used to insert a mirror for the seed injection on-axis. Experimentally, an imaging spectrometer can provide the spatio-spectral distribution of the FEL radiation. Combined with adequate focusing optics, one can observe either the near- or far-field spectral distribution.
Figure 1. Schematic of a LPA–based seeded FEL. From one main femtosecond infrared laser unit, two pulses centered at 800 nm are delivered with independent controls. The main laser branch is focused in a gas medium for electron beam generation. The second branch is used for seed generation. At the undulator exit, the radiation is observed using an imaging spectrometer while the electron beam is dumped.
Using parameters of table1, a 6D electron beam is generated with a flat top profile in energy and Gaussian profiles in other dimensions. The distribution is then transported to the undulator entrance using second order transport formalism [51]. The FEL amplification is simulated with GENESIS [52] using this 6D electron beam
distribution together with an amplitude and phase temporal description of the seed while the undulator magnetic field is defined by its period u, number of periods Nuand deflection parameter Ku(see table1). The
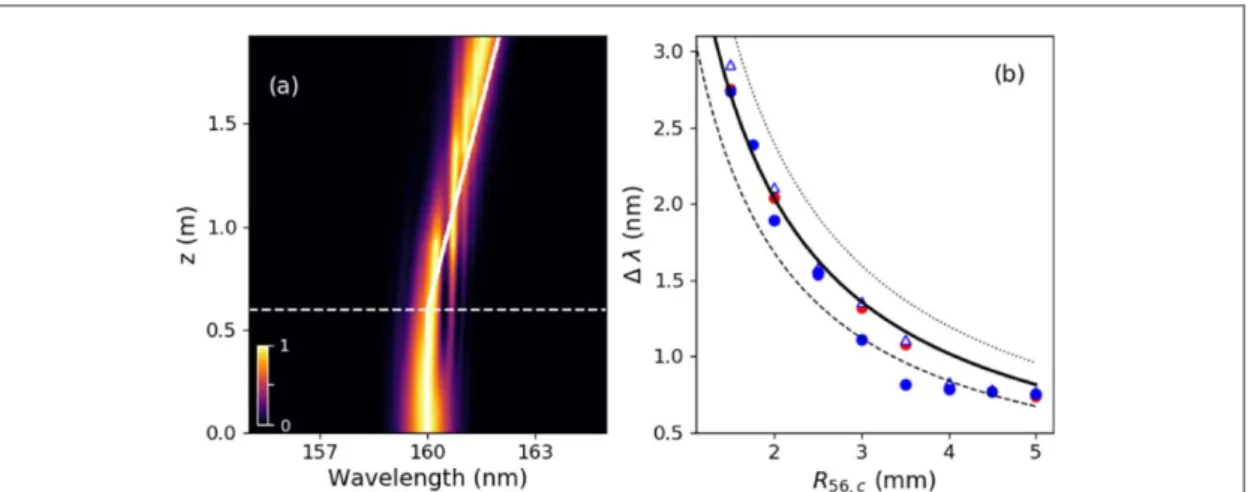
output radiation is then analyzed using Fourier optics to predict the observable near- and far-field spatio-spectral distributions. Typical simulation outputs are presented in figure2. To identify the seed contribution, the charge Q is first forced to zero. As expected, Gaussian distributions are obtained in the near- and far-fields (figures2(a) and (b)). The seed power Pseedis then forced to zero to distinguish the spontaneous emission
contribution (figures2(c) and (d)) expected at a resonance wavelength R u ( )(2 2 1 K2 2 2 2)for a mono-energetic beam with a Lorentz factor γ, θ being the observation angle. Hence the observed broad band emission results from the large energy spread (different γ) while the ‘moon shapes’ in the far-field result from the off-axis contribution in 2[53]. When the seed overlaps the electron beam, i.e. in the FEL case, a significant red
shift (≈1.5 nm) appears (figures2(e) and (f)), together with high contrast fringes.
3. Analytic modeling of the FEL red shift
The standard FEL red spectral shift due to beam energy loss can only be responsible here for sub-nanometer spectral shifts (0.002 nm in the case of table1). In order to understand the process underlying here, we reconsider the analytical treatment of the electron beam longitudinal motion along the undulator. For a relativistic electron of energy mc2traveling in a purely vertical undulator magnetic field, the Lorentz equation
in the horizontal direction can be integrated to derive the average longitudinal velocity [54]: ⎡ ⎣ ⎢ ⎛ ⎝ ⎜ ⎞ ⎠ ⎟⎤ ⎦ ⎥ ˜v c 1 1 K 2 1 2 . z 2 u 2
The time for an electron to travel the distance z in the undulator is simplyt z v˜zso that the difference of
travel time dt for electrons of different energiesd close to γ is: ⎛ ⎝⎜ ⎞ ⎠⎟ ⎛ ⎝ ⎜ ⎞ ⎠ ⎟ ˜ ( ) t z v z c K d d d 1 d 1 2 d . 1 z u2 3
Thus, electrons with different energies induce a chirp associated to a stretching of the beam due to the longitudinal dispersionR56,u( )z of the undulator:
⎛ ⎝ ⎜ ⎞ ⎠ ⎟ ( ) ( ) c t z 1 K R z 2 1 . 2 u u 2 2 56,
Table 1. Parameters for FEL simulation and modeling.
Parameter Value
Electron beam Energy 200 MeV Relative energy spread 4%
Charge Q 20pC Divergence x y0, 0 1mrad-rms Emittance x y0, 0 0.1mm mrad Chicane dispersionR56,c 2.5mm Undulator Period u 18mm Number of periods Nu 107 Deflection parameter Ku 1.864
Seed laser Central wavelength 160nm Quadratic phase 1.15 10 4fs−2
Duration 370fs-FWHM
Peak power 10kW
Waist position 0m Rayleigh length 0.7m
In a first approximation, the longitudinal energy sorting of the electrons introduced in the chicane is given by: ( )
s R56,c 3
withR56,cthe chicane strength or dispersion. Considering now a beam portion of one seed laser period, i.e. s seed, and inserting equation (3) into (2), we find that this beam portion is increased by:
( )
( )z R ( )z ( ) R z R 1 . 4 u c K c 56, 56, seed 2 0 2 56, seed u2The initial seeddensity modulation is stretched proportionnally to the undulator and chicane dispersion
ratio up to seed ( )z . Since the coherent radiation is emitted at the final density modulation period, the
FEL central wavelength is found shifted by . Because the density modulation is not present immediately at the undulator entrance, i.e. at z = 0, this model can be further refined replacing z in equation (4) by z zi,
where ziis the ‘effective’ starting point of the red shifting. Systematic analysis of the simulations reveals that zi
could be defined as the location for which the coherent emission intensity becomes 0.5 times the initial seed intensity.
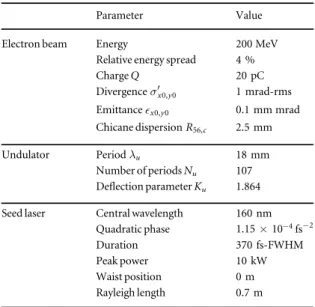
Figure3(a) shows a typical evolution of the FEL spectrum along the undulator. The FEL wavelength drifts away from the initial seed wavelength, following the analytical prediction of equation (4) (solid line). The horizontal dashed line corresponds to the starting point ziin the model. Figure3(b) summarizes the FEL central
wavelengths obtained in simulation as a function of the chicane strength for various electron beam charges and divergences. The final wavelengths are found well within the theoretical predictions.
Figure 2. Simulated spatio-spectral distribution of the radiation at the undulator exit in the near- (left) and far-field (right). (a) and (b) Seed only (Pseed 10kW, Q=0pC), (c) and (d) Spontaneous emission only (Pseed 0W, Q=20pC) and (e), (f) FEL case
4. Analytic modeling of the FEL linewidth
The analysis of the FEL spectral content can then be pushed further. In the case of standard spontaneous emission, i.e. synchrotron radiation, the on-axis linewidth is inversely proportional to the number of undulator periods Nu: 1 Nu. An additional inhomogeneous broadening can then result from the electron beam
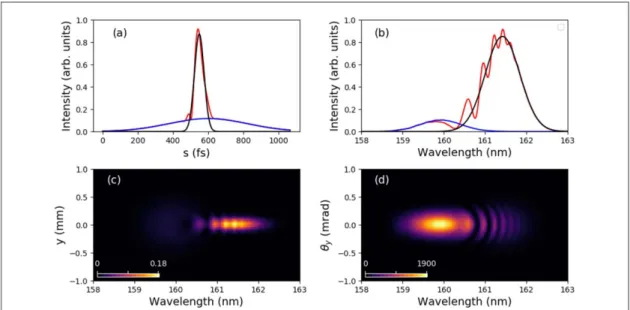
relative energy spread and/or divergence [55]. In the case of high-gain self-amplified FELs, the linewidth at saturation is essentially driven by felaccording to fel. This linewidth can be further reduced down to the Fourier limit in the case of high-gain seeded FELs. In the low-gain case presented here, the linewidth dependencies are expected to be in an intermediate state which is worth being investigated. As shown in figure4, varying the energy spread at the LPA source from±2 down to±0.5% (figure4(a)), the slice energy spread at the undulator entrance remains constant around 0.06% (figure4(d)). This results from the strong stretching in the chicane (figure4(b)) which cancels the contribution of the initial energy spread to the final slice energy spread. As a consequence, the final FEL linewidth is not sensitive to the initial energy spread for values above±0.5% (figure4(f)). For initial energy spread values below±0.5% however, the FEL spectrum starts being affected
Figure 3. (a) Normalized simulated spectrum along the undulator for a charge of 50 pC, with theoretical prediction of the peak wavelength evolution (solid white line) using a starting point zi(dashed line) where the FEL intensity reaches 0.5 times the seed
intensity. (b) Simulated spectral shift versus the chicane dispersionR56,cfor Q = 20 pC and x y0, 0 1mrad (blue dot),
Q = 40 pC and x y0, 0 1mrad (red dot), Q = 20 pC and x y0, 0 0.5mrad (blue triangle). Analytical prediction of the spectral
shift for various starting points: zi 0.25m (dashed line), zi 0.5m (solid line), zi 0.75m (dotted line).R56,cset to 1.5 mm
corresponding to a value compatible with the insertion of a seed mirror in the chicane.
Figure 4. Influence of the initial energy spread on the FEL spectrum. Longitudinal energy distribution (a) at the LPA source and (b)–(c) at the undulator entrance, (c) longitudinal energy spread and current at the undulator entrance, FEL temporal profile (e) and on-axis spectrum (f) at the undulator exit. The initial energy spread is varied from±2% (green),±1% (blue),±0.5% (red) and±0.3% (black). Other parameters from table1.
(figure4(f)). Since the slice energy spread is unchanged, it is not in cause. For low initial energy spread values, the
bunch duration, even after stretching in the chicane, is significantly decreased (figure4(c)). If this duration
becomes of the order of—or smaller—than the slippage lengthNu , the radiation slips ahead of the electronic
medium before reaching the end of the undulator, aborting the FEL process. The final spectrum corresponds to an FEL process with less effective undulator periods, in good agreement with the smaller red shift observed (figure4(f)). Finally, our FEL linewidth is not driven by the initial energy spread.
The FEL linewidth (figure5(a)) is then analyzed as a function of other initial beam parameters. It reveals strongly correlated to the initial beam divergence x y0, 0 while hardly sensitive to the initial beam emittance
(figure5(b)). Actually, it is the slice energy spread at the undulator entrance which is directly driven by the initial beam divergence (figure5(c)). This can be explained deriving analytically the electron beam slice energy spread [56] at the undulator entrance:
( ) R R R 1 2 2 5 c z x y 56, 0 2 5222 40 5442 40
with R522,544the transport matrix coefficients and z0the length of the initial beam (at the LPA source). This
simple formula properly fits the simulation results (figure5(c) with black line). Hence, in the case of LPA beams, because the initial beam duration is short (few microns) while the initial divergence is large (≈mrad), the dominant contribution after transport to the slice energy spread is the initial divergence. Following, the FEL linewidth is finally dominated by this initial divergence and turns out to be easily tunable with the chicane strengthR56,c(figure5(d)) as expected from (equation (5)). Such behaviors can be seen as a special feature of the
LPA–based FELs.
5. Double pulse modeling of the interferometric fringes
The on-axis FEL spectra (figures3(a) and5(a)) present fringes that are also visible in the 2D spatio-spectral distribution (figures2(e) and (f)). Most features of this interferometric pattern can be simply understood modeling the exit radiation as a superposition of two independent Gaussian light pulses: the seed laser Eseedand a
coherent contribution Ecoh. Each light pulse is described independently in 3D as a combination of a Gaussian
beam in the transverse planeEtrans(x y z, , )and a linearly chirped pulse in the temporal domainEtemp( ), where
(x, y) stand for the transverse plane perpendicular to the propagation axis z and t z c stands for the
retarded time with t the position in time and c the speed of light.
Figure 5. (a) Simulated on-axis spectrum of the seed at undulator entrance (dashed blue line) and exit (continuous blue line), and of the FEL at undulator exit (continuous black line). Dash lines: seed and FEL central wavelengths (maximum intensity location). (b) Simulated FEL linewidth versus beam initial divergence with x y0, 0= 0.1mm mrad (full dots) and x y0, 0 0.5mm mrad
(empty dots), using Q = 40 pC at R56,c 2.5mm. (c) Simulated electron beam slice energy spread inside the undulator versus beam initial divergence using same markers as for (b) with Q = 40 pC at R56,c 2.5mm and calculated using equation (5) (black line) withR522 R544 0.23m. (d) Simulated FEL linewidth versus chicane dispersion for x y0, 0 0.5mrad-rms (blue dots),
1.0
x y0, 0 mrad-rms (black dots), x y0, 0 2.0mrad-rms (red dots), x y0, 0 0.1mm mrad (full dots) and x y0, 0 0.5mm mrad
(empty dots) with Q = 40 pC. Fits (dashed lines) of the linewidth withf a( ) a R56,cwhere a = 1.7, 2.0 and 2.8 for respectively the
5.1. Temporal electric field
The electric field of a linearly chirped pulse is given by: ⎡ ⎣ ⎢ ⎤ ⎦ ⎥ ( ) [ ( )] ( ) E E exp i C 4 t exp 6 temp 0 2 2 0 1 2
with tthe rms pulse duration,f a phase offset, 0the optical carrier frequency and C1the quadratic phase, i.e.
the linear chirp, coefficient and E0the field amplitude.
5.2. Transverse electric field
Assuming a linear polarization and a propagation in the z direction, the transverse electric field of a Gaussian
beam is given by:
⎛ ⎝⎜ ⎞ ⎠⎟ ⎡ ⎣ ⎢⎛ ⎝⎜ ⎞ ⎠⎟ ⎤ ⎦ ⎥ ( ) ( ) ( ) ( ) ( ) ( ) E x y z E w w z r w z kz k r R z z , , exp exp i 2 , 7 trans 0 0 2 2 2
wherer x2 y2is the radial distance from the center axis of the beam, z is the propagation distance from
the beam’s focus (or ‘waist’), k 2 0is the wavenumber, E0the electric field amplitude (same as in
equation (6)), w(z) is the radius at the plane z,w0 w 0( )is the waist radius, R(z) is the radius of curvature of the
beam’s wavefront, and ( )z is the Gouy phase. At a propagation distance z, the spot size parameter w is given by:
⎛ ⎝⎜ ⎞ ⎠⎟ ( ) ( ) w z w z z 1 , 8 0 R 2
wherezR w02 is called the Rayleigh length. The curvature of the wavefront is zero at the beam waist. It is
equal to1 Rwhere R(z) is the radius of curvature as a function of position along the beam, given by:
⎜ ⎟ ⎡ ⎣ ⎢ ⎛⎝ ⎞⎠ ⎤ ⎦ ⎥ ( ) ( ) R z z z z 1 R 2 . 9
The Gouy phase of the beam is given by: ( )z arctan
( )
zzR .
5.3. Final 3D electric field
Using equations (6) and (7) to describe the separable longitudinal and transverse components, the 3D electric field of each pulse, seed Eseedand coherent contribution Ecoh, can be expressed as:
( ) ( ) ( ) ( )
E x y z E E x y z E
, , , , , . 10
seed coh temp trans
0
The pulses can have different properties such as wavelengths, chirps, waists, etc... Assuming that the FEL results from the superposition of these two fields, its electric field is given by:
( ) ( ) ( ) ( )
Efel x y z, , , Eseed x y z, , , Ecoh x y z, , z, 11 with z the difference between the seed and coherent contribution waist positions and τ the temporal delay between the seed and coherent emission. The amplitude ratio Ecoh Eseedcorresponds to the FEL ‘gain’.
5.4. Spatio-spectral distributions
The spatio-spectral distributions at the undulator exit, in the near- and far-field, are simply obtained using Fourier optics [57]. The near-field spatio-spectral distribution (in the vertical plane) is obtained by Fourier transforming the 3D electric field along the temporal axis for a given horizontal position x xswhile scanning
the vertical position y:
˜( ) ( ) ( )
E x y zs, , 0, EFEL x y z ts, , 0, e i2 td .t 12 The far-field, i.e. angular, distribution is the Fourier transform of EFELin the transverse plane and is given by:
( ) ( ) ( ) ( )
E x, y,t EFEL x y z t e, , , i2 xx yy d d ,x y 13 while the angular distribution is defined as:
( ) ( ) ( )
Eang x, y,t E x, y,t 14 with x y, x y, . The far-field spatio-spectral distribution (in the vertical plane) is then obtained by Fourier
( ) ( ) ( ) ( )
E y, E x s,, y, E x s,, y,t e i2 td .t 15 Finally, the intensity distributions in the near-field INFand far-field IFFfor a finite slit aperture2 xare
obtained as follows: ( ) ∣ ˜( )∣ ( ) I y, E x y, , dx 16 x x s s NF 2 ( ) ∣ ( )∣ ( ) IFF y, E x s,, y, 2d x s,. 17 x x
The double pulse model was first tested using a set of arbitrary input parameters. As shown for instance in figure6, the fringes features in both the near- and far-fields are successfully generated, together with the curvature of the fringes along the vertical axis.
6. Interferometry for robust FEL pulse reconstruction
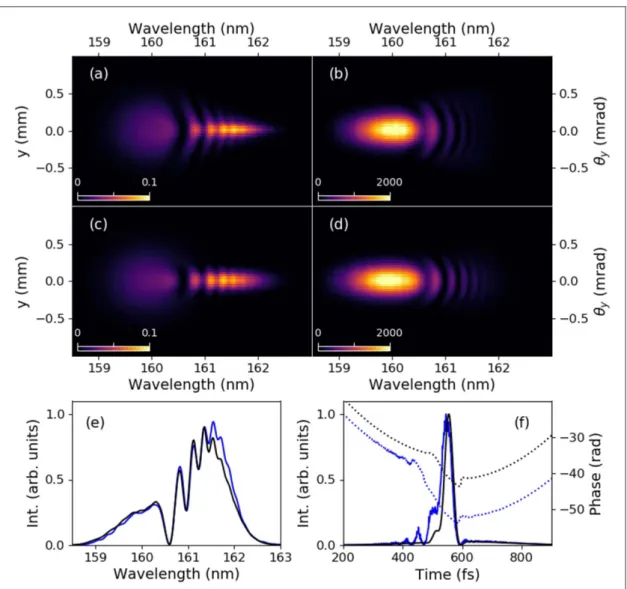
Assuming that the seed properties are known, the double pulse model (equation (11)) is used to fit the simulated near-field pattern (figures7(a) and (b)) using a standard least mean square method. The result of the fit is shown in figures7(c) and (d). Both near- and far-field distributions present a good agreement with the initial
simulations. The few percent fit accuracy is illustrated in figure7(e), comparing the near-field on-axis spectra (i.e. at y = 0 mm). Among the fitted parameters are found key features such as the FEL source point and Rayleigh length (respectively 0.23 m before the undulator exit and 0.25 m in the case of figures7(c) and (d)). Finally, the
reconstructed FEL intensity and phase in the time-domain are displayed in figure7(f), again in very good
agreement with the initial simulation.
Experimentally, the near-field intensity distribution is obtained placing a 2D imaging spectrometer in the image plane of a focussing lens at the undulator exit, while the far-field distribution is obtained moving the spectrometer to the focal plane of a focussing lens. Both distributions are therefore easy features to measure, meaning that combined with our double pulse model, an efficient tool for full FEL pulse reconstruction becomes available.
7. Conclusion
In conclusion, we presented simulation results of a feasible LPA–based seeded FEL. We showed that it presents original spatio-spectral distributions, with red shifted interference fringes. Those features were explained using simple considerations, allowing a deep understanding of the physical effects underlying. Moreover, we
Figure 6. Example of double pulse model calculation. On-axis intensity (a) and spectrum (b) of the seed contribution (blue), coherent contribution (black) and total FEL field (red). Near-field (c) and far-field (d) intensity distributions of the FEL field. Double pulse model withE0,coh E0,seed 3.1, t,coh 45fs, coh 8.238 106, 0,coh 2 c 161.5 nm, C1,coh 4.0 10 4fs−2, waist
demonstrated that our double pulse model can provide with key features on the FEL source point as well as the full temporal reconstruction of the FEL pulse on a single-shot basis. We verified that this work can be extended to FELs in the visible or XUV range. Fringes can be indeed obtained as long as the red shift amplitude is of the order of the seed linewidth, and as the gain remains below two orders of magnitude.
In the framework of LPA–based FEL experiments, the double pulse model tool could first be used to characterize the FEL pulse obtained in the time domain, i.e. beyond the standard spectral characterizations. Thanks to its 2D features, it could also be used to optimize the seed spectral and transverse properties, to enhance the FEL amplification. One could then finally hope to control, using this diagnostic, the spectral and temporal properties of the FEL pulse via electron beam and seed tuning.
Acknowledgments
This work was partially supported by the European Research Council for the Advanced Grants COXINEL (340015, PI: M.-E. Couprie), the LABEX CEMPI (ANR-11-LABX-0007), Ministry of Higher Education and Research, Hauts de France council and European Regional Development Fund (Contrat de Projets Etat-Region CPER Photonics for Society P4S). The authors acknowledge the SOLEIL team and the LPA team of Laboratoire d’Optique Appliquée for the collaboration on COXINEL.
Figure 7. Near- (a), (c) and far-field (b), (d) from (top) simulations and (bottom) analytical model fitting simulations with
E0,coh E0,seed 2.35, t,coh 17.3fs, coh 9.3 106, 0,coh 2 c 161.5 nm, C1,coh 3.6 10 4fs−2, waist position
0.23 m before undulator exit, zR coh, 0.25m and τ = 50 fs. Simulated (blue) and fitted (black) on-axis FEL spectral intensity (e) and field intensity and phase (f). Other parameters from table1with Q = 15 pC.
[4] Ishikawa T et al 2012 A compact x-ray free-electron laser emitting in the sub-Angström region Nat. Photon.6 540
[5] Weise H and Decking W 2017 Commissioning and first lasing of the European XFEL Proc. FEL2017 Conf. vol 1 (Santa Fe, NM, USA)
pp 9–13
[6] Bonifacio R, Pellegrini C and Narducci L M 1984 Collective instabilities and high-gain regime in a free electron laser Opt. Commun.50 373–8
[7] Wang X J, Freund H P, Harder D, Miner W H, Murphy J B, Qian H, Shen Y and Yang X 2009 Efficiency and spectrum enhancement in a tapered free-electron laser amplifier Phys. Rev. Lett.103 154801
[8] Schneidmiller E A and Yurkov M V 2015 Optimization of a high efficiency free electron laser amplifier Phys. Rev. Spec. Top. Accel. Beams.18 030705
[9] Csonka P L 1978 Enhancement of synchrotron radiation by beam modulation Part. Accel. 8 225 [10] Vinokurov N A and Skrinsky A N 1978 Preprint INP Novosibirsk, pp 78–88
[11] Shaftan T and Li Hua Yu 2005 High-gain harmonic generation free-electron laser with variable wavelength Phys. Rev. E71 046501
[12] De Ninno G, Mahieu B, Allaria E, Giannessi L and Spampinati S 2013 Chirped seeded free-electron lasers: self-standing light sources for two-color pump–probe experiments Phys. Rev. Lett.110 064801
[13] Wu J, Murphy J B, Emma P J, Wang X, Watanabe T and Zhong X 2007 Interplay of the chirps and chirped pulse compression in a high-gain seeded free-electron laser J. Opt. Soc. Am. B24 484–95
[14] Lutman A A, Penco G, Craievich P and Wu J 2009 Impact of an initial energy chirp and an initial energy curvature on a seeded free electron laser: free electron laser properties Math. Theor.42 085405
[15] Gauthier D et al 2015 Spectrotemporal shaping of seeded free-electron laser pulses Phys. Rev. Lett.115 114801
[16] Wu J, Bolton P R, Murphy J B and Wang K 2007 ABCD formalism and attosecond few-cycle pulse via chirp manipulation of a seeded free electron laser Opt. Express15 12749–54
[17] Gauthier D et al 2016 Chirped pulse amplification in an extreme-ultraviolet free-electron laser Nat. Commun.7 13688
[18] De Ninno G et al 2015 Single-shot spectro-temporal characterization of XUV pulses from a seeded free-electron laser Nat. Commun.
6 8075
[19] Tajima T and Dawson J M 1979 Laser electron accelerator Phys. Rev. Lett.43 267–70
[20] Grüner F et al 2007 Design considerations for table-top, laser-based VUV and x-ray free electron lasers Appl. Phys. B86 431–5
[21] Couperus J P et al 2017 Demonstration of a beam loaded nanocoulomb-class laser wakefield accelerator Nat. Commun.8 487
[22] Tsai H E et al 2018 Control of quasi-monoenergetic electron beams from laser–plasma accelerators with adjustable shock density profile Phys. Plasmas25 043107
[23] Kuschel S et al 2016 Demonstration of passive plasma lensing of a laser wakefield accelerated electron bunch Phys. Rev. Accel. Beams19 071301
[24] Thaury C et al 2015 Demonstration of relativistic electron beam focusing by a laser–plasma lens Nat. Commun.6 6860
[25] van Tilborg J et al 2015 Active plasma lensing for relativistic laser–plasma-accelerated electron beams Phys. Rev. Lett.115 184802
[26] Chiadroni E et al 2018 Overview of plasma lens experiments and recent results at SPARC_LAB 3rd European Advanced Accelerator Concepts Workshop (EAAC2017): Nucl. Instrum. Methods Phys. Res. A909 16–20
[27] Eichner T, Grüner F, Becker S, Fuchs M, Habs D, Weingartner R, Schramm U, Backe H, Kunz P and Lauth W 2007 Miniature magnetic devices for laser-based, table-top free-electron lasers Phys. Rev. Spec. Top. Accel. Beams10 082401
[28] Iwashita Y et al 2018 Super strong adjustable permanent magnet quadrupole for the final focus in a linear collider Proc. EPAC 2006 p 2550
[29] Ghaith A, Kitegi C, André T, Valléau M, Marteau F, Veteran J, Blache F, Benabderrahmane C, Cosson O and Forest F 2018 Tunable high gradient quadrupoles for a laser plasma acceleration based FEL Nucl. Instrum. Methods Phys. Res. A290–3
[30] Couprie M E, Loulergue A, Labat M, Lehe R and Malka V 2014 Towards a free electron laser based on laser plasma accelerators J. Phys. B: At. Mol. Opt. Phys.47 234001
[31] Maier A R, Meseck A, Reiche S, Schroeder C B, Seggebrock T and Grüner F 2012 Demonstration scheme for a laser-plasma-driven free-electron laser Phys. Rev. X2 031019
[32] Smith T I, Madey J M J, Elias L R and Deacon D A G 1979 Reducing the sensitivity of a free-electron laser to electron energy J. Appl. Phys.
50 4580–3
[33] Huang Z, Ding Y and Schroeder C B 2012 Compact x-ray free-electron laser from a laser-plasma accelerator using a transverse-gradient undulator Phys. Rev. Lett.109 204801
[34] Loulergue A, Labat M, Evain C, Benabderrahmane C, Malka V and Couprie M E 2015 Beam manipulation for compact laser wakefield accelerator based free-electron lasers New J. Phys.17 023028
[35] Schlenvoigt H-P et al 2008 A compact synchrotron radiation source driven by a laser-plasma wakefield accelerator Nat. Phys.4 130–3
[36] Fuchs M et al 2009 Laser-driven soft-X-ray undulator source Nat. Phys.5 826–9
[37] Lambert G et al 2012 Proc. 34th Int. Free-Electron Laser Conf. (FEL2012) (Nara, Japan, 26–31 August 2012)
[38] Anania M P et al 2014 An ultrashort pulse ultra-violet radiation undulator source driven by a laser plasma wakefield accelerator Appl. Phys. Lett.104 264102
[39] André T et al 2018 Control of laser plasma accelerated electrons for light sources Nat. Commun.9 1334
[40] Ghaith A et al 2019 Transportation and manipulation of a laser plasma acceleration beam Proc. FLS’2018 Conf. (Shanghai, China)
pp 56–61
[41] Elias L R, Fairbank W M, Madey J M J, Schwettman H A and Smith T I 1976 Observation of stimulated emission of radiation by relativistic electrons in a spatially periodic transverse magnetic field Phys. Rev. Lett.36 717–20
[42] Liu T, Feng C, Xiang D, Liu J and Wang D 2019 Generation of ultrashort coherent radiation based on a laser plasma accelerator J. Synchrotron Radiat.26 311–9
[43] Inoue I et al 2019 Generation of narrow-band x-ray free-electron laser via reflection self-seeding Nat. Photon.13 319–22
[44] Weingartner R et al 2012 Ultralow emittance electron beams from a laser-wakefield accelerator Phys. Rev. Spec. Top. Accel Beams15 111302
[45] Buck A et al 2013 Shock-front injector for high-quality laser-plasma acceleration Phys. Rev. Lett.110 185006
[46] Wang W T et al 2016 High-brightness high-energy electron beams from a laser wakefield accelerator via energy chirp control Phys. Rev. Lett.117 124801
[47] Benabderrahmane C et al 2017 Development and operation of a pr fe B2 14 based cryogenic permanent magnet undulator for a high spatial resolution x-ray beam line Phys. Rev. Accel. Beams20 033201
[48] Salières P, L’Huillier A and Lewenstein M 1995 Coherence control of high-order harmonics Phys. Rev. Lett.74 3776–9
[49] Lambert G et al 2008 Injection of harmonics generated in gas in a free-electron laser providing intense and coherent extreme-ultraviolet light Nat. Phys.4 296–300
[50] Marteau F et al 2017 Variable high gradient permanent magnet quadrupole (quapeva) Appl. Phys. Lett.111 253503
[51] Brown K L 1972 A first-and second-order matrix theory for the design of beam transport systems and charged particle spectrometers SLAC Technical Report No. SLAC-R-075
[52] Reiche S 1999 Genesis 1.3: a fully 3d time-dependent FEL simulation code Nucl. Instrum. Methods Phys. Res. A429 243–8
[53] Giannessi L et al 2013 Superradiant cascade in a seeded free-electron laser Phys. Rev. Lett.110 044801
[54] Huang Z and Kim K-J 2007 Review of x-ray free-electron laser theory Phys. Rev. Spec. Top. Accel. Beams10 034801
[55] Hofmann A 1986 SSRL ACD-NOTE 38, Stanford Synchrotron Radiation Lab Theory of synchrotron radiation [56] Labat M et al 2018 Robustness of a plasma acceleration based free electron laser Phys. Rev. Accel. Beams21 114802
[57] Goodman J W 2005 Introduction to Fourier optics Introduction to Fourier Optics ed J W Goodman 3rd edn (Englewood, CO: Roberts & Co.)