HAL Id: inserm-00425464
https://www.hal.inserm.fr/inserm-00425464
Submitted on 21 Oct 2009HAL is a multi-disciplinary open access
archive for the deposit and dissemination of sci-entific research documents, whether they are pub-lished or not. The documents may come from teaching and research institutions in France or abroad, or from public or private research centers.
L’archive ouverte pluridisciplinaire HAL, est destinée au dépôt et à la diffusion de documents scientifiques de niveau recherche, publiés ou non, émanant des établissements d’enseignement et de recherche français ou étrangers, des laboratoires publics ou privés.
Occupational exposures contribute to educational
inequalities in lung cancer incidence among men:
Evidence from the EPIC prospective cohort study.
Gwenn Menvielle, Hendriek Boshuizen, Anton Kunst, Paolo Vineis, Susanne
Dalton, Manuela Bergmann, Silke Hermann, Fabrizio Veglia, Pietro Ferrari,
Kim Overvad, et al.
To cite this version:
Gwenn Menvielle, Hendriek Boshuizen, Anton Kunst, Paolo Vineis, Susanne Dalton, et al.. Occupa-tional exposures contribute to educaOccupa-tional inequalities in lung cancer incidence among men: Evidence from the EPIC prospective cohort study.: Occupation and educational inequalities in lung cancer. International Journal of Cancer, Wiley, 2010, 126 (8), pp.1928-35. �10.1002/ijc.24924�. �inserm-00425464�
Research article
Journal category: Epidemiology
OCCUPATIONAL EXPOSURES CONTRIBUTE TO EDUCATIONAL INEQUALITIES IN
LUNG CANCER INCIDENCE AMONG MEN. EVIDENCE FROM THE EPIC
PROSPECTIVE COHORT STUDY.
Short title: Occupation and educational inequalities in lung cancer
Gwenn Menvielle (1,2,3), Hendriek Boshuizen (1), Anton E Kunst (2), Paolo Vineis (4)(23), Susanne
O Dalton (5), Manuela M Bergmann (6), Silke Hermann (7), Fabrizio Veglia (8), Pietro Ferrari (9)
Kim Overvad (10),Ole Raaschou-Nielsen (5), Anne Tjønneland (5), Rudolf Kaaks (7), Jakob Linseisen
(7)(11), Domenico Palli (12), Vittorio Krogh (13), Rosario Tumino (14), Laudina Rodriguez (15),
Antonio Agudo (16), Maria-José Sánchez (17)(18), Jone Miren Altzibar Arozena (19)(18), Lluis Cirera
(20)(18), Eva Ardanaz (21)(18), Sheila Bingham (22), Kay-Tee Khaw (22), Paolo Boffetta (9), Eric
Duell (9), Nadia Slimani (9), Valentina Gallo (23), Elio Riboli (23), H Bas Bueno-de-Mesquita (1).
1 The National Institute for Public Health and the Environment (RIVM), Bilthoven, The Netherlands
2. Department of Public Health, ErasmusMC, Rotterdam, The Netherlands
3. Inserm U687, Villejuif, France
4 University of Torino, Torino, Italy
5 Institute of Cancer Epidemiology, Danish Cancer Society, Copenhagen, Denmark
6 Dept of Epidemiology, German Institute of Human Nutrition, Postdam Rehbücke, Germany
7 Division of Cancer Epidemiology, German Cancer Research Center, Heidelberg, Germany
8 ISI Foundation, Torino, Italy
9 International Agency for Research on Cancer, Lyon, France
10 Dept of Clinical Epidemiology, Aarhus University Hospital, Aalborg, Denmark
12 Molecular and Nutritional Epidemiology Unit, Cancer Research and Prevention Institute (ISPO),
Florence, Italy
13 Department of Preventive & Predictive Medicine, Nutritional Epidemiology Unit, Italian National
Center Institute, Milan, Italy
14 Cancer registry Azienda, Ospedaliera “Civile M.P. Arezzo”, Ragusa, Italy
15 Public Health and Participation Directorate (Health and Health Care Service Council), Asturias,
Spain
16 Unit of Nutrition, Environment, and Cancer, Catalan Institute of Oncology, Barcelona, Spain
17 Andalusian School of Public Health, Granada, Spain
18 CIBER Epidemiología y Salud Pública (CIBERESP), Spain
19 Public Health Division of Guipuzcoa, Basque Government, Spain
20 Department of Epidemiology, Murcia Health Council, Murcia, Spain
21 Public Health Institute of Navarra, Pamplona, Spain.
22 MRC Center for Nutritional Epidemiology and Cancer Prevention and Survival, Dept of Public
Health and Primary Care, University of Cambridge, Cambridge, UK
23 Dept of Epidemiology and Public Health, Imperial College, London, UK
Corresponding author
Gwenn Menvielle
Inserm U687, Hôpital Paul Brousse. Bat 15/16
16 ave Paul Vaillant Couturier. 94807 Villejuif Cedex. France
Gwenn.Menvielle@inserm.fr
Tel: +33-1-77-74-74-20
Fax: +33-1-77-74-74-03
Keywords: Lung cancer incidence, education, men, occupational exposure
Our study revealed that the impact of occupational exposures on educational inequalities in lung cancer
incidence exists while of modest magnitude. Occupational exposures explained about 14% of
remaining inequalities, when smoking and diet are already adjusted for.
Public and occupational health policies that aim at decreasing occupational exposure to carcinogens
ABSTRACT
The aim of this study is to investigate to what extent occupational exposures may explain
socioeconomic inequalities in lung cancer incidence after adjusting for smoking and dietary factors.
Analyses were based on a subsample of the European Prospective Investigation into Cancer and
Nutrition (EPIC study), a prospective cohort. Analyses included 703 incident lung cancer cases among
men in Denmark, the UK, Germany, Italy, Spain and Greece. Socioeconomic position was measured
using the highest level of education. Estimates of relative indices of inequality (RII) were computed
with Cox regression models. We first adjusted for smoking (with detailed information on duration and
quantity) and dietary factors (fruits and vegetables consumption) and then for occupational exposures.
Exposure to three carcinogens (asbestos, heavy metals and polycyclic aromatic hydrocarbons) was
analyzed. Occupational exposures explained 14% of the socioeconomic inequalities remaining after
adjustment for smoking and fruits and vegetables consumption. Inequalities remained nevertheless
statistically significant. The RII decreased from 1.87 (95% CI: 1.36-2.56) to 1.75 (1.27-2.41). The
decrease was more pronounced when adjusting for asbestos than for heavy metals or PAH. Analyses by
birth cohort suggested an effect of occupational exposures among older men, while due to small
number of endpoints no conclusion could be drawn about the role of occupational exposures in
educational inequalities among younger men. Our study revealed that the impact of occupational
exposures on socioeconomic inequalities in cancer incidence, rarely studied until now, exists while of
INTRODUCTION
Socioeconomic inequalities are observed in lung cancer incidence. Using various socioeconomic
indicators such as education, occupational class, income or deprivation index, studies generally
reported a higher risk among subjects with a lower socioeconomic position 1-4. To explain these inequalities, a common hypothesis is that a higher exposure to risk factors explains the higher
incidence of lung cancer in low socioeconomic groups. In other words, the risk factors are seen as
intermediate variables or mediators between education and the onset of lung cancer 5, 6. Smoking is the major risk factor for lung cancer, with a population attributable fraction around 85% 7. Consequently, this risk factor should be considered first when investigating the mechanisms leading to socioeconomic
inequalities in lung cancer incidence. However, studies found that smoking only partly explained these
inequalities 8-10. This suggests that other mediators may account for part of residual inequalities. Occupational exposures may be one of those. Indeed, exposure to several substances including
asbestos, arsenic compounds, heavy metals, polycyclic aromatic hydrocarbons (PAH), silica, radon or
welding fumes have been associated with lung cancer incidence 11. In addition, these exposures are more prevalent among subjects with lower socioeconomic position. To our knowledge, only one study
tried to estimate the contribution of occupational exposures to socioeconomic inequalities in lung
cancer incidence and showed that occupational exposures did not explain any additional socioeconomic
inequalities – when already adjusted for smoking 12. This study was, however, based on a highly selected cohort. In addition to this fragmentary evidence, one tentative estimate suggested that around
50% of socioeconomic inequalities in lung cancer mortality could be attributable to occupational
exposures, but this estimate did not adjust for tobacco consumption 13. The role of occupational exposures in socioeconomic inequalities in lung cancer incidence remains thus largely unknown.
We already investigated the role of smoking in educational inequalities in lung cancer incidence in the
European Prospective Investigation into Cancer and Nutrition (EPIC study) and found that tobacco
consumption partly explained these inequalities. Adjustment for smoking decreased educational
differences in lung cancer incidence by 50 to 65% 14. Fruits and vegetables consumption hardly explained any additional inequalities. In the EPIC study, occupational exposures to several carcinogens
were available for a subsample. In this paper, we aim to investigate the role of occupational exposures
in explaining the remaining educational differences in lung cancer incidence after adjustment for
smoking and dietary factors among men in Europe using the EPIC cohort.
METHODS
The EPIC cohort is a multi center prospective cohort conducted in 23 centers in 10 European countries.
The EPIC cohort has been extensively described elsewhere 15, 16. More than 500,000 men and women were recruited during the 1990s. In this analysis, the end of the follow-up period occurred between
December 2002 and December 2006. The mean follow-up was 8.4 years. At recruitment, all subjects
filled in a questionnaire providing detailed information on many risk factors including smoking history
and dietary factors. In 15 of the 23 centers (Spain (Asturias, Granada, Murcia, Navarra, and San
Sebastian), Greece, Denmark (Copenhagen, Aarhus), Germany (Heidelberg and Postdam), Italy (Turin,
Varese, Florence, Ragusa) and the UK (Cambridge)), the questionnaire included several questions on
the occupational history of the participants, focusing on 52 selected occupations (or industries) that
have been previously linked to developing cancer. In an earlier analysis on occupational exposures and
lung cancer incidence in the EPIC cohort 17, the authors developed exposure ‘scores’ for each of the following carcinogenic exposures: asbestos, heavy metals, PAH, environmental tobacco smoke (ETS),
and silica. For each exposure, a group of experts selected all occupations (from the list of 52) exposing
to this carcinogen. The exhaustive list can be found elsewhere 17. The exposure ‘score’ was computed as the sum of the reported jobs (or employments) included in the list selected for each carcinogenic
exposure. This score was then coded categorically in 4 classes: never exposed (reference category),
exposed in 1 job, 2 jobs, 3 jobs and more regardless of length of employment. This crude score was
developed because no information was available in the EPIC cohort regarding the duration or the level
of the occupational exposure. However, previous analyses have shown a consistent association between
this score and lung cancer incidence in the EPIC cohort 17.
The outcome variable was first primary lung cancer (ICD 10: C33-C34). We measured socioeconomic
vocational secondary education, other secondary education, university or vocational post-secondary
education. Subjects with prevalent cancer at baseline (except non-melanoma skin cancer) or with
length of follow-up equal to zero (4%) were excluded from the analysis. We also excluded subjects
with a ratio of energy intake to energy expenditure in the top and bottom 1%, subjects with missing
information on smoking status, diet or education and subjects with missing information on date of
diagnosis for an incident cancer prior to the incident lung cancer because we could not define their
censor date (n=16,139). The date of diagnosis was available for all primary lung cancer cases. We
restricted the analyses to men because of the low number of cases occurring among women exposed to
any carcinogen (5 in Germany, 11 in the UK, 40 in Denmark, 4 in Spain and 1 in Greece, and no
information on occupational exposures among women in Italy) (n=131,505). The analysis was finally
based on 88,265 men and included 703 incident lung cancer cases.
Analyses were conducted with Cox regression models. Analyses were stratified on center and age at
baseline (in 1 year age categories). We computed hazard ratios (HR). To overcome problems due to
differences in educational distributions between different countries or generations, we computed
relative indices of inequality (RII) to quantify socioeconomic inequalities 18. The calculation of the RII is based on a relative measure of education. This is a ranked variable that equals, for each educational
group, to the mean proportion of the population with a higher level of education and is computed as
follows. If the highest educational group comprises 20% of the population, this ranked variable is
assigned a value of 0.20/2=0.10. If the next highest educational group comprises 30% of the
population, it is assigned a value of 0.20+0.30/2=0.35, etc. We computed this ranked variable by center
and age categories. We then regressed the cancer incidence on this ranked variable using a Cox
regression model. The RII corresponds to the estimate obtained for this ranked variable and quantifies
the linear effect of the relative level of education on lung cancer risk. Thus, the RII expresses
inequality within the whole socioeconomic continuum and can be interpreted as the ratio of lung cancer
incidence between the lowest educated (0th percentile) and the highest educated (100th percentile). As the measure of the socioeconomic position takes into account the size and relative position of each
educational group, it is well adapted to compare populations with different educational distributions
and thus fits well with the design of this study.
We considered several models, all stratified on age at baseline and center: 1) a crude model including
education only, 2) a reference model adjusted for smoking and dietary factors, 3) a full model adjusted
for smoking, dietary factors and occupational exposures.
The reference model was developed in a previous analysis 14 and included smoking status (never, current and former smoker), three continuous variables related to tobacco consumption (age at start,
current quantity smoked (number of cigarettes/day), duration of smoking) and several combinations of
these variables (a quadratic term for current quantity smoked, two interaction terms between duration
and quantity and between age at start and duration), as well as a dummy variable for missing values for
the current quantity smoked (for duration of smoking and age at start, missing values were rare and
replaced by the median). We also introduced total fruits and vegetables consumption as a continuous
variable and the interaction between smoking status and this dietary variable.
The full model included, in addition to the smoking and dietary variables, the score developed for
exposure to asbestos, to PAH and to heavy metals. We first introduced each score separately and then
the three scores simultaneously. We did not analyze exposure to ETS or silica because of the too small
number of cases occurring among exposed men (ETS: 36; silica: 27).
We conducted analyses by birth cohort as some occupational exposures may have been more prevalent
in the past. This allowed indirectly accounting for time-varying aspects of occupational exposures. As
there was no a priori hypothesis to define the birth cohort, we used the median of years of birth, 1941,
as cut-off point and conducted analyses among men born before or after 1941.
We tested the decrease in RII when adjusting for occupational exposures. We used a method developed
in a paper from Lunn and McNeil to analyze competing risks in survival analysis using readily
available standard programs for fitting Cox’s 19, 20. We adapted this method for our purpose, which was the comparison of the RII estimates from a model with and without adjustment for occupational
exposures. We used the Cochran’s Q test to examine the heterogeneity between birth cohorts in
educational inequalities (measured with RII). The test statistic is computed by summing the squared
difference between each birth cohort specific-RII and the overall RII, weighted by the inverse of the
estimated variance of each country specific-RII.
RESULTS
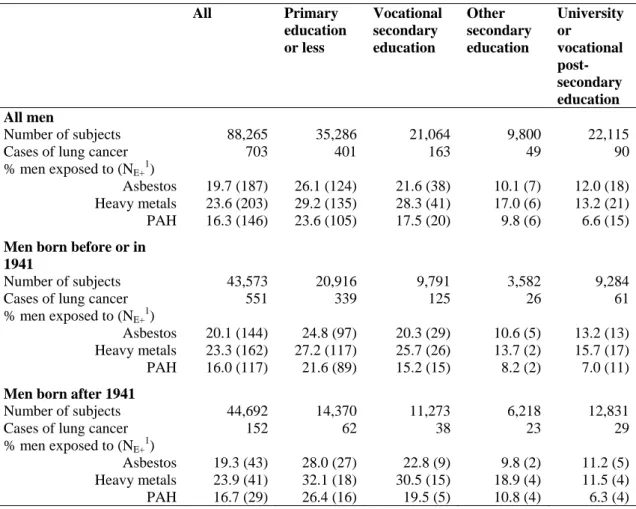
The proportion of men ever employed in a job involving exposure to one of these three carcinogens,
asbestos, PAH or heavy metal, was higher among men with primary education or less or with
vocational secondary education (Table 1). This proportion showed a marked non linear gradient with
education, with an important gap between the two upper and the two lower categories of education.
Having jobs involving exposure to PAH was less frequent than having jobs involving exposure to
asbestos or heavy metals, especially among men with university or vocational post-secondary
education. This pattern was found among all men and in both birth cohorts. We found a clear
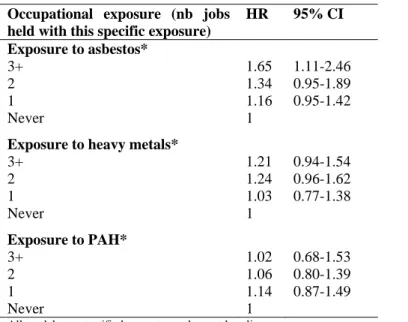
association between number of jobs involving exposure to asbestos and lung cancer incidence. This
association was weaker and statistically nonsignificant for exposure to heavy metals and absent for
exposure to PAH (Table 2).
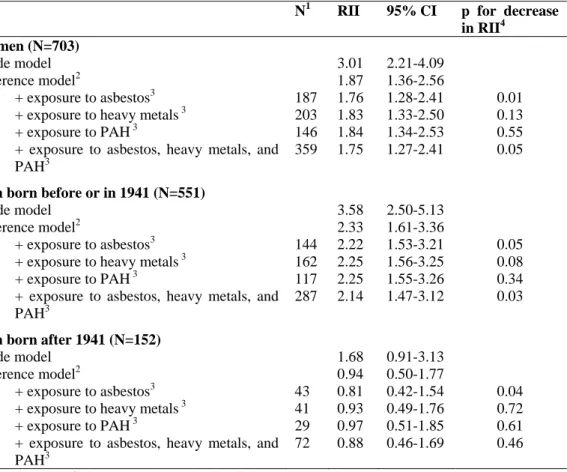
Table 3 presents the relative indices of inequality for education in the different models. Adjustment for
number of jobs involving occupational exposure to each carcinogen separately reduced the magnitude
of inequality – already adjusted for smoking and fruits and vegetables consumption – in male lung
cancer incidence. The decrease was larger and statistically significant for asbestos (p=0.01). When the
three carcinogens were introduced simultaneously into the model, the RII decreased from 1.87 to 1.75.
We observed a significant decrease (p=0.05) in the excess risk by 14%, from 87% to 75%. The residual
RII remained significant when adjusting for number of jobs involving occupational exposure to
asbestos, PAH or heavy metals.
The interaction with birth cohort was significant in all models (test for heterogeneity: p=0.03 in crude
exposures). Among men born before 1941, we observed large inequalities that were reduced when
adjusting for smoking and dietary factors and further reduced when additionally adjusting for number
of jobs involving occupational exposures. The decrease in inequalities when adjusting for all
occupational exposures was statistically significant, but the RII remained statistically significant
(RII=2.14; 95% CI 1.47-3.12). Estimates were smaller among men born after 1941. The risk estimates
were close to 1 and confidence intervals were wide and no longer statistically significant once smoking
and dietary factors were adjusted for.
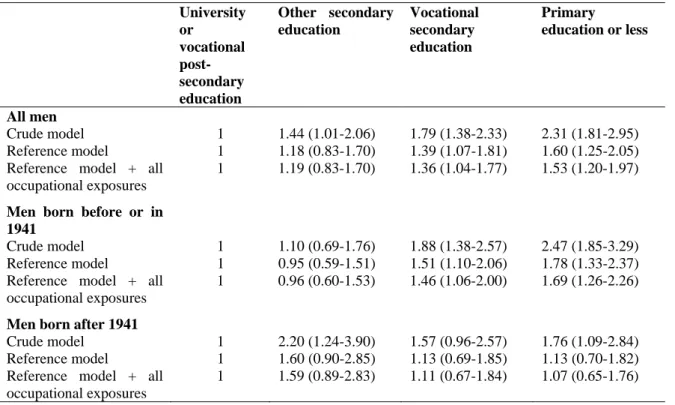
In addition to RII, we also computed HR by education (Table 4). Among all men, occupational
exposures, as measured by the number of jobs involving such exposures, explained part of the higher
lung cancer incidence found among men with vocational secondary education and especially among
men with primary education or less. The same applies to men born before or in 1941. Even after
adjustment for occupational exposures, lung cancer risks remained statistically significantly elevated
for men with vocational secondary education or primary education or less when compared with men
with university or vocational post-secondary education. A different pattern of inequalities was
observed among younger men. The highest lung cancer risk was found among men with other
secondary education. This excess risk was not reduced when occupational exposures were introduced
in the model. The risk estimate was however based on small numbers and did not reach statistical
significance. As the RII quantifies the linear relationship between the outcome and the independent
variable, it is thus not well adapted to measure inequalities in this case. However, the HRs are
consistent with the RII and show a larger effect of occupational exposures in educational inequalities in
lung cancer incidence among older men.
DISCUSSION
We investigated the role of occupational exposures in educational inequalities in male lung cancer
incidence and found that they explained about 14% of inequalities that remained when smoking and
Occupational exposures were quantified as the number of jobs held involving exposure to specific
carcinogens. This information, although imprecise, was however the best available information in the
EPIC cohort. Moreover a consistent association has been found in the cohort between this score and
lung cancer risk 17. Some limitations related to the assessment of occupational exposures should nevertheless be addressed. The classification for occupational exposures was based on job titles. Error
and misclassification in measurement may have occurred especially because of insufficient
information. At least three limitations can be cited: the method used was based on an a priori list of
hazardous occupations which is not exhaustive; the classification of jobs according to common
exposures may be somewhat inaccurate; no information on duration, level or intensity of exposure was
available. Because we selected all potentially hazardous occupations, we may have considered as
exposed many subjects who are in reality not exposed to any carcinogen. Conversely, part of the
subjects classified as non exposed are probably to some extent truly exposed. This misclassification is
unlikely to differ by vital status but may differ by education. In particular it could be that we missed the
exposure more among high educated people, because the hazardous occupations are more widespread
among low educated men. It is unfortunately not possible to say to what extent this misclassification
biased our estimates of educational inequalities 21. In addition, the level of misclassification may differ by carcinogen. It is for instance certainly easier to detect and select occupations exposing to asbestos
than to PAH. There is also a low background exposure to PAH in many occupations, which is not
observed for the other carcinogens.
Imprecision in measurement of occupational exposures and confounding due to smoking should also be
considered. Previous analyses based on the whole EPIC cohort suggested that residual confounding by
smoking could not totally account for the residual educational inequalities observed in lung cancer
incidence when adjusting for smoking and dietary factors 14 and that other factors were likely to be involved. Information about exposure to several carcinogens such as welding fumes was not available
in our study and our estimates may be conservative. However, adjusting for exposure to ETS and silica
The association found in this study between occupational exposures and lung cancer incidence reflects
the situation in job employment several years ago. Occupational exposures at work may have
decreased in Europe during the last decades and characteristics of occupational exposure (substance,
intensity, duration) may therefore differ by birth cohort. For instance, many countries have now
prohibited exposure to asbestos 22. This was done during the 1980s in some countries like the Nordic countries or Germany but later in France or Spain. We conducted analyses by birth cohort to
investigate possible cohort differences in occupational exposures. Our findings are not totally
conclusive. They nevertheless suggest a clear effect of occupational exposures in educational
inequalities in lung cancer incidence among older men, which may be due to a high exposure to
occupational carcinogens in the past. We considered smoking, fruits and vegetables consumption and
occupational exposures as mediators between education and the onset of lung cancer 5. Educational inequalities in lung cancer incidence nevertheless remained large and statistically significant among
older men after adjusting for these factors. In addition to residual confounding by smoking, diet and
occupational exposures, other factors may also explain an additional part of inequalities. The literature
does not support any effect of psychosocial factors 25. Conversely, environmental exposures to pollution or ETS at home 26 as well as other risk factors such as physical activity 27 may play a role in socioeconomic inequalities.
Among younger men, as the analyses are based on small numbers, we cannot totally rule out that
chance fluctuations have caused some of the observed observations. Therefore, we cannot draw firm
conclusions based on our results. Moreover, the lag time between exposure to carcinogen and the onset
of lung cancer should be taken into account. The mean age at diagnosis among men born after 1941
was 55. Because of the potentially long lag times between exposure to carcinogen and cancer
incidence, this generation may not be old enough to see any clear effect of exposure to carcinogens on
lung cancer incidence, and consequently on educational inequalities in lung cancer incidence. Finally,
it should be noted that these results relate to relative inequalities. Because the baseline hazards strongly
We used education as a marker of the socioeconomic position 23, 24. Education is an individual measure of socioeconomic position and allows classification of all individuals, including those who do not work
and are retired. Higher education may be associated with health through different pathways: subjects
with higher education may be more receptive to prevention messages, and may have a higher ability to
change their health behaviour and to better utilize the health care system 24. As in all studies including data from different countries, we cannot rule out possible inconsistencies between centres in the
educational classification. However, we dedicated special effort to minimize these problems and used a
common classification in all centres for education.
Our study revealed that the impact of occupational exposures on educational inequalities in lung cancer
incidence, rarely studied until now, exists but is of modest magnitude. Public and occupational health
policies that aim at decreasing exposure to carcinogens at work would probably help to reduce
socioeconomic inequalities in the cancer field. However, tobacco control is and remains the key
element of any strategy aiming at reducing socioeconomic inequalities in cancer incidence in general
FUNDING
G Menvielle received a funding from the Fondation pour la Recherche Médicale for this analysis. GM
is financed by a grant from InCA (Convention n°0607-3D1514-06). The project was in part funded by
the European Commission, through the Eurocadet project (from the commission of the European
communities research directorate-general, grant No EUROCADET:SP23-CT-2005-006528). EPIC was
supported by the European Commission: Public Health and Consumer Protection Directorate
1993-2004 and the Research Directorate-General 2005-2008.
European Commission FP5 project (QLG1-CT-2001-01049).The EPIC study was funded by "Europe
Against Cancer" Programmeof the European Commission (SANCO); Ligue contre le Cancer (France);
Société 3M (France); Mutuelle Généralede l'Education Nationale; Institut National de la Santéet de la
Recherche Médicale; German Cancer Aid; GermanCancer Research Center; German Federal Ministry
of Educationand Research; Danish Cancer Society; Red Temática de Investigación Cooperativa de
Centros de Cáncer (C03/10); the participating regional governments and institutions of Murcia,
Navarra, Asturias, Pais Vasco y Andalucia, Spain; Cancer Research UK; Medical Research Council,
United Kingdom; Stroke Association, United Kingdom; British Heart Foundation; Department of
Health, United Kingdom; Food Standards Agency, United Kingdom; The Wellcome Trust, United
Kingdom; Greek Ministry of Education; Greek Ministry of Health and Social Solidarity; Hellenic
Health Foundation; Italian Association for Research on Cancer; Dutch Ministry of Public Health,
Welfareand Sports; Dutch Ministry of Health; Dutch Prevention Funds;LK Research Funds; Dutch
Zorg Onderzoek Nederland; World Cancer Research Fund; Swedish Cancer Society; Swedish
Scientific Council; Regional Government of Vasterbotten and Skane, Sweden; Norwegian Cancer
Society;and Foundation to Promote Research into Functional Vitamin B12Deficiency, Norway. Some
authors are partners of EnvironmentalCancer Risk, Nutrition and Individual Susceptibility, a network
of excellence of the European Commission (6FP contract 513943). Antonio Agudo and Paolo Vineis
References
1. Faggiano F, Partanen T, Kogevinas M, Boffetta P. Socioeconomic differences in cancer incidence and mortality. IARC Sci Publ 1997;138:65-176.
2. Dalton S, Steding-Jessen M, Engholm G, Schüz J, Olsen J. Social inequality and incidence of and survival from lung cancer in a population-based study in Denmark, 1994-2003. Eur J Cancer 2008;44:1989-95.
3. Krieger N, Quesenberry C, Jr., Peng T, Horn-Ross P, Stewart S, Brown S, Swallen K, Guillermo T, Suh D, Alvarez-Martinez L, Ward F. Social class, race/ethnicity, and incidence of breast, cervix, colon, lung, and prostate cancer among Asian, Black, Hispanic, and White residents of the San Francisco Bay Area, 1988-92 (United States). Cancer Causes Control 1999;10:525-37.
4. Clegg LX, Reichman ME, Miller BA, Hankey BF, Singh GK, Lin YD, Goodman MT, Lynch CF, Schwartz SM, Chen VW, Bernstein L, Gomez SL, et al. Impact of socioeconomic status on cancer incidence and stage at diagnosis: selected findings from the surveillance, epidemiology, and end results: National Longitudinal Mortality Study. Cancer Causes Control ahead of print.
5. Bauman AE, Sallis JF, Dzewaltowski DA, Owen N. Toward a better understanding of the influences on physical activity: the role of determinants, correlates, causal variables, mediators, moderators, and confounders. Am J Prev Med 2002;23:5-14.
6. Thrane C. Explaining educational-related inequalities in health: Mediation and moderator models. Soc Sci Med 2006;62:467-78.
7. Danaei G, Vander Hoorn S, Lopez AD, Murray CJ, Ezzati M. Causes of cancer in the world: comparative risk assessment of nine behavioural and environmental risk factors. Lancet 2005;366:1784-93.
8. van Loon AJ, Goldbohm RA, van den Brandt PA. Lung cancer: is there an association with socioeconomic status in The Netherlands? J Epidemiol Community Health 1995;49:65-9.
9. Mao Y, Hu J, Ugnat AM, Semenciw R, Fincham S. Socioeconomic status and lung cancer risk in Canada. Int J Epidemiol 2001;30:809-17.
10. Hart CL, Hole DJ, Gillis CR, Davey Smith G, Watt GC, Hawthorne VM. Social class differences in lung cancer mortality: risk factor explanations using two Scottish cohort studies. Int J Epidemiol 2001;30:268-74.
11. Blot WJ, Fraumeni JF, Jr. Cancers of the lung and pleura. In: Schottenfeld D, Fraumeni JF, Jr. Cancer epidemiology and preventioned. New York: Oxford University Press, 1996:637-65.
12. van Loon AJ, Goldbohm RA, Kant IJ, Swaen GM, Kremer AM, van den Brandt PA. Socioeconomic status and lung cancer incidence in men in The Netherlands: is there a role for occupational exposure? J Epidemiol Community Health 1997;51:24-9.
13. Boffetta P, Kogevinas M, Westerholm P, Saracci R. Exposure to occupational carcinogens and social class differences in cancer occurence. IARC Sci Publ 1997;138:331-41.
14. Menvielle G, Boshuizen H, Kunst AE, Dalton SO, Vineis P, Bergmann MM, Hermann S, Ferrari P, Raaschou-Nielsen O, Tjonneland A, Kaaks R, Linseisen J, et al. The role of smoking and diet in explaining educational inequalities in lung cancer incidence. J Natl Cancer Inst 2009;101:321-30.
15. Riboli E, Kaaks R. The EPIC Project: rationale and study design. European Prospective Investigation into Cancer and Nutrition. Int J Epidemiol 1997;26 Suppl 1:S6-14.
16. Riboli E, Hunt KJ, Slimani N, Ferrari P, Norat T, Fahey M, Charrondiere UR, Hemon B, Casagrande C, Vignat J, Overvad K, Tjonneland A, et al. European Prospective Investigation into Cancer and Nutrition (EPIC): study populations and data collection. Public Health Nutr 2002;5:1113-24.
17. Veglia F, Vineis P, Overvad K, Boeing H, Bergmann M, Trichopoulou A, Trichopoulos D, Palli D, Krogh V, Tumino R, Linseisen J, Steindorf K, et al. Occupational exposures, environmental tobacco smoke, and lung cancer. Epidemiology 2007;18:769-75.
18. Mackenbach JP, Kunst AE. Measuring the magnitude of socio-economic inequalities in health: an overview of available measures illustrated with two examples from Europe. Soc Sci Med 1997;44:757-71.
19. Lunn M, McNeil D. Applying Cox regression to competing risks. Biometrics 1995;51:524-32.
20. Hoffmann K, Pischon T, Schulz M, Schulze MB, Ray J, Boeing H. A statistical test for the equality of differently adjusted incidence rate ratios. Am J Epidemiol 2008;167:517-22.
21. Jurek AM, Greenland S, Maldonado G, Church TR. Proper interpretation of non-differential misclassification effects: expectations vs observations. Int J Epidemiol 2005;34:680-7.
22. Kazan-Allen L. National asbestos bans. 2002 [cited 2009 31/03]; available from
http://www.ibas.btinternet.co.uk/index.htm
23. Berkman LF, Macintyre S. The measurement of social class in health studies:old measures and new formulations. IARC Sci Publ 1997;138:51-64.
24. Galobardes B, Shaw M, Lawlor DA, Lynch JW, Davey Smith G. Indicators of socioeconomic position (part 1). J Epidemiol Community Health 2006;60:7-12.
25. Sampson W. Controversies in cancer and the mind: effects of psychosocial support. Semin Oncol 2002;29:595-600.
26. Vineis P, Hoek G, Krzyzanowski M, Vigna-Taglianti F, Veglia F, Airoldi L, Overvad K, Raaschou-Nielsen O, Clavel-Chapelon F, Linseisen J, Boeing H, Trichopoulou A, et al. Lung cancers attributable to environmental tobacco smoke and air pollution in non-smokers in different European countries: a prospective study. Environ Health 2007;6:7.
27. Steindorf K, Friedenreich C, Linseisen J, Rohrmann S, Rundle A, Veglia F, Vineis P, Johnsen NF, Tjonneland A, Overvad K, Raaschou-Nielsen O, Clavel-Chapelon F, et al. Physical activity and lung cancer risk in the European Prospective Investigation into Cancer and Nutrition Cohort. Int J Cancer 2006;119:2389-97.
Table 1: Number of lung cancer cases and prevalence of different occupational exposures by education.
Men. EPIC cohort
All Primary education or less Vocational secondary education Other secondary education University or vocational post-secondary education All men Number of subjects 88,265 35,286 21,064 9,800 22,115
Cases of lung cancer 703 401 163 49 90
% men exposed to (NE+1)
Asbestos 19.7 (187) 26.1 (124) 21.6 (38) 10.1 (7) 12.0 (18) Heavy metals 23.6 (203) 29.2 (135) 28.3 (41) 17.0 (6) 13.2 (21) PAH 16.3 (146) 23.6 (105) 17.5 (20) 9.8 (6) 6.6 (15)
Men born before or in 1941
Number of subjects 43,573 20,916 9,791 3,582 9,284
Cases of lung cancer 551 339 125 26 61
% men exposed to (NE+1)
Asbestos 20.1 (144) 24.8 (97) 20.3 (29) 10.6 (5) 13.2 (13) Heavy metals 23.3 (162) 27.2 (117) 25.7 (26) 13.7 (2) 15.7 (17) PAH 16.0 (117) 21.6 (89) 15.2 (15) 8.2 (2) 7.0 (11)
Men born after 1941
Number of subjects 44,692 14,370 11,273 6,218 12,831
Cases of lung cancer 152 62 38 23 29
% men exposed to (NE+1)
Asbestos 19.3 (43) 28.0 (27) 22.8 (9) 9.8 (2) 11.2 (5) Heavy metals 23.9 (41) 32.1 (18) 30.5 (15) 18.9 (4) 11.5 (4) PAH 16.7 (29) 26.4 (16) 19.5 (5) 10.8 (4) 6.3 (4) 1: Number of lung cancer cases among exposed men
Table 2: Hazard ratios associated with occupational exposure to different carcinogens. Men. EPIC
cohort
Occupational exposure (nb jobs held with this specific exposure)
HR 95% CI Exposure to asbestos* 3+ 1.65 1.11-2.46 2 1.34 0.95-1.89 1 1.16 0.95-1.42 Never 1
Exposure to heavy metals*
3+ 1.21 0.94-1.54 2 1.24 0.96-1.62 1 1.03 0.77-1.38 Never 1 Exposure to PAH* 3+ 1.02 0.68-1.53 2 1.06 0.80-1.39 1 1.14 0.87-1.49 Never 1
All models are stratified on centre and age at baseline.
*The model includes each occupational exposure separately and smoking status (never smoker
(reference category), current smoker, former smoker), age at starting (continuous, for ever smoker),
duration of smoking (continuous, for ever smoker), current quantity (continuous, among current
smokers), a quadratic term for current quantity, two interaction terms (quantity*duration and age at
starting*duration), a dummy variable for missing variables for current quantity, fruits and vegetables
consumption (continuous variable, per 100g) and an interaction term between smoking status and fruits
Table 3: Relative indices of inequality (RII) for education and their corresponding 95% confidence
intervals (95% CI) for lung cancer among all men and by birth cohort. EPIC cohort.
N1 RII 95% CI p for decrease
in RII4 All men (N=703)
Crude model 3.01 2.21-4.09
Reference model2 1.87 1.36-2.56
+ exposure to asbestos3 187 1.76 1.28-2.41 0.01 + exposure to heavy metals 3 203 1.83 1.33-2.50 0.13
+ exposure to PAH3 146 1.84 1.34-2.53 0.55
+ exposure to asbestos, heavy metals, and PAH3
359 1.75 1.27-2.41 0.05
Men born before or in 1941 (N=551)
Crude model 3.58 2.50-5.13
Reference model2 2.33 1.61-3.36
+ exposure to asbestos3 144 2.22 1.53-3.21 0.05 + exposure to heavy metals 3 162 2.25 1.56-3.25 0.08
+ exposure to PAH3 117 2.25 1.55-3.26 0.34
+ exposure to asbestos, heavy metals, and PAH3
287 2.14 1.47-3.12 0.03
Men born after 1941 (N=152)
Crude model 1.68 0.91-3.13
Reference model2 0.94 0.50-1.77
+ exposure to asbestos3 43 0.81 0.42-1.54 0.04 + exposure to heavy metals 3 41 0.93 0.49-1.76 0.72
+ exposure to PAH3 29 0.97 0.51-1.85 0.61
+ exposure to asbestos, heavy metals, and PAH3
72 0.88 0.46-1.69 0.46
All models are stratified on centre and age at baseline (in 1 year age categories). 1: Number of cases exposed to the carcinogen
2: The reference model includes smoking status (never smoker (reference category), current smoker, former smoker), age at starting (continuous, for ever smoker), duration of smoking (continuous, for ever smoker), current quantity (continuous, among current smokers), a quadratic term for current quantity, two interaction terms (quantity*duration and age at starting*duration), a dummy variable for missing variables for current quantity, fruits and vegetables consumption (continuous variable, per 100g) and an interaction term between smoking status and fruits and vegetables consumption.
3: Occupational exposures are coded into four categories: never exposed, exposed during in one job, exposed in two jobs, exposed in three jobs or more.
Table 4: Hazard ratios (HR) for education and their corresponding 95% confidence intervals for lung
cancer among all men and by birth cohort. EPIC cohort.
University or vocational post-secondary education Other secondary education Vocational secondary education Primary education or less All men Crude model 1 1.44 (1.01-2.06) 1.79 (1.38-2.33) 2.31 (1.81-2.95) Reference model 1 1.18 (0.83-1.70) 1.39 (1.07-1.81) 1.60 (1.25-2.05) Reference model + all
occupational exposures
1 1.19 (0.83-1.70) 1.36 (1.04-1.77) 1.53 (1.20-1.97)
Men born before or in 1941
Crude model 1 1.10 (0.69-1.76) 1.88 (1.38-2.57) 2.47 (1.85-3.29) Reference model 1 0.95 (0.59-1.51) 1.51 (1.10-2.06) 1.78 (1.33-2.37) Reference model + all
occupational exposures
1 0.96 (0.60-1.53) 1.46 (1.06-2.00) 1.69 (1.26-2.26)
Men born after 1941
Crude model 1 2.20 (1.24-3.90) 1.57 (0.96-2.57) 1.76 (1.09-2.84) Reference model 1 1.60 (0.90-2.85) 1.13 (0.69-1.85) 1.13 (0.70-1.82) Reference model + all
occupational exposures