HAL Id: hal-01225333
https://hal.archives-ouvertes.fr/hal-01225333
Submitted on 9 Nov 2015
HAL is a multi-disciplinary open access
archive for the deposit and dissemination of
sci-entific research documents, whether they are
pub-lished or not. The documents may come from
teaching and research institutions in France or
abroad, or from public or private research centers.
L’archive ouverte pluridisciplinaire HAL, est
destinée au dépôt et à la diffusion de documents
scientifiques de niveau recherche, publiés ou non,
émanant des établissements d’enseignement et de
recherche français ou étrangers, des laboratoires
publics ou privés.
Analysis and modeling of passive device degradation for
a long-term electromagnetic emission study of a DC–DC
converter
He Huang, Alexandre Boyer, Sonia Ben Dhia
To cite this version:
He Huang, Alexandre Boyer, Sonia Ben Dhia. Analysis and modeling of passive device degradation
for a long-term electromagnetic emission study of a DC–DC converter. Microelectronics Reliability,
Elsevier, 2015, 55 (9-10), pp. 2061-2066. �10.1016/j.microrel.2015.06.058�. �hal-01225333�
Analysis and Modelling of Passive device degradation for a long-term
electromagnetic emission study of a DC-DC converter
H. Huang
a,b, A. Boyer
a,b, S. Ben Dhia
a,ba CNRS, LAAS, 7 avenue du colonel Roche, F-31400 Toulouse, France
b
Univ de Toulouse, INSA, LAAS, F-31400 Toulouse, France
Abstract
Past works showed that the degradation of the passive components caused by aging could induce failures of electronic system, including a harmful evolution of electromagnetic compatibility. This paper presents the impact of the accelerated thermal aging on the electromagnetic emission (EME) of a buck DC-DC converter. The experimental analysis indicates that the aging degradation of several passive components (electrolytic capacitor and powder iron inductor) is the main source of EME evolution. Based on experimental measurement and physical analysis, the empirical degradation models of related passive devices are proposed. The overall objective of this study is to predict the electromagnetic emission evolution of a buck DC-DC converter under a thermal aging, by using these passive device degradation models.
Corresponding author.
he.huang@laas.fr
Analysis and modelling of passive device degradation for a long-term
electromagnetic emission study of a DC-DC converter
H. Huang
a,b, A. Boyer
a,b, S. Ben Dhia
a,b1. Introduction
The consideration of the electromagnetic robustness (EMR) of integrated circuits (IC) appeared in these last years, i.e. the evolution of parasitic emission and susceptibility to electromagnetic interferences with time for electronic devices working in harsh environments. Publications such as [1] have demonstrated that the electromagnetic emission (EME) of digital circuits and I/O buffers changes with time because of the activation of intrinsic degradation mechanisms. As presented in a few works, the simulation can be utilized to predict the long-term EMC behavior. For example, in [2], the simulation results confirmed the evolution of the electromagnetic susceptibility of a phase-locked loop before and after aging stress.
A switch-mode power supply (SMPS) is selected as the device under test in this study. Because of their high power efficiency, switch-mode power supplies are widely used in electronic applications [3]. However, one main drawback of SMPS is the noise delivered by the switching activity, responsible for conducted and radiated electromagnetic emission. In this way, the management of the parasitic emission of SMPS is a frequent topic in the literature on electromagnetic compatibility (EMC). Various papers dealt with the origin and the modeling of electromagnetic emission, and also the development of design guidelines to improve these issues [4] [5]. Several recent studies presented the long-term behavior of SMPS. Due to the degradation of the electrolytic capacitor which is used to filter the output voltage of SMPS, an increase of the ripple of the output voltage of SMPS was illustrated in [6] [7]. Another consequence is the increase of electromagnetic emission, as shown in [8], where the increase of the EME of a DC-DC converter after thermal stress is associated with the degradation of output filtering passive devices, not only the capacitor but also the inductor in the output side.
As a following study of [8], this paper focuses on
the construction of passive components degradation models, especially the degradation model of powder iron inductors which has been little discussed before, and the application of these degradation models in the long-term EME study of a buck DC-DC converter.
2. Device under test and experimental set-up
2.1. DC-DC converter
The studied SMPS is based on the NCP3163 switching regulator from On Semiconductor. It is configured in step-down operation, in order to convert the voltage 12 V provided by a battery into a regulated voltage 3.3 V for a constant resistive load equal to 3.4 Ω. The switching frequency is set to 237 kHz. A simplified schematic of the converter is presented in Fig. 1. The test board has been designed to characterize conducted emissions. The output conducted EME of the converter is measured through a 150 Ω probe [9]. The output voltage is also monitored with an oscilloscope to measure its ripple.
12 V + + Load Feedback Gnd Spectrum analyzer 24.9 KΩ 15 KΩ R1 R2 120 Ω 51 Ω 6.8 nF NCP3163
Cin1 Cin2 Cout1 Cout2
L
D
150 Ω probe
Out 3.3 V
Fig. 1. Schematic of the studied buck DC-DC converter
According to the identification test of degraded devices in [8], all the components (including the NCP3163 switching regulator) embedded in the converter have slight impact on the EME evolution except Cout1 and L. The degradation of output filtering
capacitor Cout1 effects on the output voltage ripple
amplitude and on the low-frequency range of the emission spectrum (from 200 KHz up to about 1.8 MHz), and the degradation of the inductor L induces
the emission increase by a few dB above 2 MHz.. For this reason, in this paper, we focus especially on these two output filtering passive components of the converter (Cout1 and L in Table 1). In order to test and
compare more samples, two references are selected for each output filtering passive component (Cout1 of two
kinds of capacitor, and L of two different manufacturers: L1 from Vishay and L2 from Coiltronics). Besides, the different combinations of these two passive devices are employed in 8 test cards.
Table 1
Passive device characteristics
Name Reference ID Type Value
Cout1
EEEHBA101UAP C1 Aluminum capacitor 100
µF
T491D107K010AT C2 Tantalum capacitor
L IHLP4040DZ11 L1 Shield powder iron
inductor 22 µH
HCM1103220R L2
2.2. Accelerated aging
The accelerated aging test is always applied to obtain reliability data of electronic components in a brief period. In order to accelerate the converter aging, 8 converter test boards are placed 200 hours in a thermal oven, which regulates the ambient temperature at 150 °C. The stress temperature in this test could ensure a relative short aging time without damaging the tested devices definitively. During the accelerated aging process, the converters keep on running, and they are powered by an external power supply which is placed outside the oven.
The stress condition is interrupted each 20 hours in order to measure the evolution of the passive impedance and the output emission level while the converters operate under a nominal environment temperature of about 25 °C.
2.3. Passive impedance measurement
In this test, S-parameter measurements are performed using a vector network analyzer (VNA) to extract the impedance profile of passive devices between 9 kHz and 2 GHz. As explained in [10], in order to obtain better accuracy, the measurement configuration (one port or two port measurement, serial or parallel configuration) is selected according to the impedance value to be measured.
3. Experimental result and analysis
3.1. Aging impact on different capacitors
Two kinds of output filtering capacitors: aluminum capacitors and tantalum capacitors suffer the thermal stress. As illustrated in Fig. 2, the comparison of impedance before and after aging shows that a
significant degradation is observed only with aluminum electrolytic capacitors. Besides, a gradual increase of ESR of electrolytic capacitors is shown in Fig. 3. The figures illustrate only one sample of each type, but the plotted data are representative of all the tested components of the same type.
0,1 1 10 100 1000
1E+4 1E+5 1E+6 1E+7 1E+8 1E+9
M ag n itu d e o f i m p ed an ce ( Ω ) Frequency (Hz) C1_1_Fresh C1_1_200H 0,01 0,1 1 10 100
1E+4 1E+5 1E+6 1E+7 1E+8 1E+9
M ag n itu d e o f i m p ed an ce ( Ω ) Frequency (Hz) C2_1_Fresh C2_1_200H
Fig. 2. Impedance evolution of aluminum electrolytic capacitor C1 (top) and tantalum capacitor C2 (bottom) before and after thermal aging
0 1 2 3 4 5 0 50 100 150 200 ES R ( Ω )
Time of aging (hour)
ESR_10 kHz ESR_100 kHz ESR_1 MHz ESR_10 MHz
Fig. 3. ESR evolution of C1_1 at different frequencies
-15% -12% -9% -6% -3% 0% 0 50 100 150 200 Cap ac itan ce var iation ( % )
Time of aging (hour)
C1 C2
Fig. 4. Mean variation of capacitances for aluminum capacitors C1 and tantalum capacitors C2
The capacitance values are measured with a multimeter, the capacitance variation in Fig. 4 shows that both capacitors go through a gradual decrease in capacitance over time. The variation is more important for the aluminum capacitors. According to the former analysis of aluminum electrolytic capacitors, the vaporization of the electrolyte accelerated by heat, and
the degradation of electrolyte caused by ion exchange during charging/discharging are two major reasons of the degradation [11]. The degradation consequence of aluminum capacitor is the drift of two important electrical parameters: the ESR increases after aging while the terminal capacitance decreases. However, few studies discussed the aging impact on tantalum capacitors, which are known to have a good reliability [12]. The slight degradation of capacitance shown in Fig.4 confirms the results presented in [13].
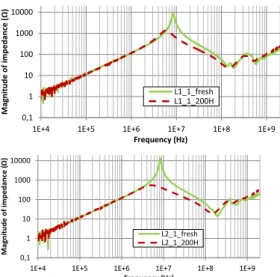
3.2. Aging impact on powder iron inductor
0,1 1 10 100 1000 10000
1E+4 1E+5 1E+6 1E+7 1E+8 1E+9
M ag n itu d e o f i m p e d an ce ( Ω ) Frequency (Hz) L1_1_fresh L1_1_200H 0,1 1 10 100 1000 10000
1E+4 1E+5 1E+6 1E+7 1E+8 1E+9
M agn itu d e o f im p e d an ce (Ω ) Frequency (Hz) L2_1_fresh L2_1_200H
Fig. 5. Impedance evolution of powder iron inductors L1 (top) and L2 (bottom) before and after thermal
The tested powder iron inductors are produced by two different manufacturers, but they have similar characteristics. As illustrated in Fig. 5, both inductor references have similar degradation trend after aging. The self-resonant frequencies of inductors decline and the impedance reduce between the resonant frequency and 150 MHz. Moreover, the quality factors decrease in this frequency range. As shown in Fig. 6, the impedance peak values at the resonant frequency decrease gradually with aging time.
0 5000 10000 15000 0 50 100 150 200 Im p ed an ce ( Ω )
Time of aging (hour)
L1_1 L2_1
Fig. 6. Evolution of impedance at the resonant frequency
The degradation of powder iron inductors can be explained by an increase of core loss [14]. The source
of the aging is the organic binding material of the powder, such as epoxy. Due to the organic material's low resistance at high temperature, this environment accelerates the core loss.
3.3. Evolution of output ripple
After the thermal stress, all the tested converters remain operational, but for the converters which employ aluminum capacitor as the output filtering capacitor (Card6 for example), the output voltage ripple has strongly increased (bottom in Fig. 7). In this article, the results of Card3 and Card6 are presented, since they are representative of all the tested convertor samples. The biggest difference between the two cards is the type of output filtering capacitor: contrary to Card6, Card3 embeds a tantalum capacitor. According to the impedance measurements, the tantalum capacitors have no great changes after aging, so the ripple of the converters which embed the tantalum output filtering capacitor, like Card3, stays on the same amplitude level (top in Fig.7). The output ripple measurement of converters confirms the impact of output filtering capacitor revealed in former studies.
3,2 3,3 3,4 3,5 0 5 10 15 20 Vo u t (V) Time (µSec) Card3_Fresh Card3_200H 2,9 3,1 3,3 3,5 3,7 0 5 10 15 20 Vo u t (V) Time (µSec) Card6_Fresh Card6_200H
Fig. 7. Evolution of the output voltage ripples of Card3 (top) and Card6 (bottom)
3.4. Evolution of conducted EME of converters
The variation of output conducted EME envelope before and after aging measured of two cards is shown in Fig. 8. The output conducted EME of all converters increases over a large frequency range. As the tantalum capacitor has very small ESR value, the output ripple amplitude and the emission in the low frequency range of Card3 are much smaller than that of Card6. Besides, as the tantalum capacitor does not have great degradation, the conducted emission level of the
converters with this kind of capacitor does not demonstrate a significant rise in the low frequency range until 1.4 MHz. -40 -20 0 20 40
1E+05 1E+06 1E+07 1E+08 1E+09
Em issi o n le ve l (d B m V) Frequency (Hz) Card3_Fresh Card3_Aged 200H Card6_Fresh Card6_Aged 200H
Fig. 8. Variation of conducted emission envolope
The same identification test in [8] is also applied, and the results confirm the role of the passive devices in different frequency ranges: Cout1 degradation has an
impact on the low frequency range while the inductor degradation increases the emission above 2 MHz.
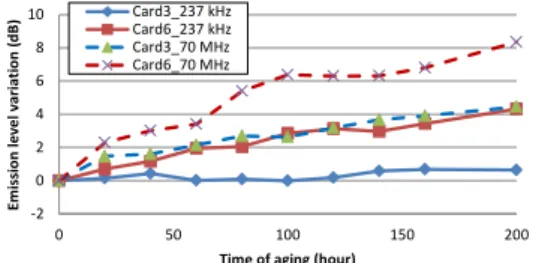
-2 0 2 4 6 8 10 0 50 100 150 200 Em issi o n le ve l var iat io n ( dB)
Time of aging (hour)
Card3_237 kHz Card6_237 kHz Card3_70 MHz Card6_70 MHz
Fig. 9. Evolution of conducted emission variation at 237 kHz and 70 MHz
Like the degradation of the passive devices, the evolution of conducted emission over the aging time is also gradual except for converters which embed tantalum capacitor at low frequency. Here the evolution of the emission level at two frequencies is illustrated in Fig. 9, where 237 kHz is the fundamental frequency, and 70 MHz is the frequency which has the highest emission level above 20 MHz.
4. Degradation models of passive devices
Electrical models of the aluminum capacitor and the powder iron inductor have already been proposed in [8]. In this study, the modeling of passive devices focuses on the degradation evolution over aging time.
4.1. Modeling of aluminum capacitor
The electrical model of the aluminum capacitor is presented in Fig. 10, where the ESR is not a constant, but a resistor which varies with the frequency, which can be presented by a series of parallel RC pairs as mentioned in [8]. In this model, ESR and C0 are two
parameters affected by thermal aging. According to several degradation predictive models of aluminum capacitor [11] [16] and the experimental results, the
degradation model up to 3 MHz is proposed by:
ESR(t) = ESR(0) / (1 − k1∙t) (1)
C0(t) = C0(0) / (1 + k2∙t) (2)
ESR(0), C0(0) is the initial value of ESR and C0; ESR(t), C0(t) is ESR and C0 value at aging time t; k1, k2 are two constants which depend on the
design of the capacitor and the aging condition. The values extracted from measurements are listed in Table 2. Though the aging condition is the same, a small dispersion of degradation coefficients could be observed. However, the proportion between k1 and k2 is
nearly constant. Besides, the coefficients of determination R2 between the models and the experimental results are also resumed in Table 2. Owing to the random aging impact [15] and the measurement errors of impedance, the degradation models cannot represent perfectly the aging effect but a relatively accurate global trend.
ESR Lesl
Resl
C0
C0: Terminal Capacitance (F)
Lesl: Inductance of ESL (H) Resl: Resistance of ESL (Ω) ESR: Equivalent series resistance (Ω)
4.8 nH
50 Ω
100.5 µF
Fig. 10. Electrical model of the electrolytic capacitor Cout1(value of fresh C1_4)
Table 2
Parameter value of degradation model of C1
ID k1 R2_ESR(t) k2 R2_C0(t) k1/k2
C1_1 3.68e-3 0.979 9.16e-4 0.93 4.01e3
C1_2 3.61e-3 0.975 9.05e-4 0.968 3.99e3
C1_3 3.36e-3 0.975 8.09e-4 0.967 4.15e3
C1_4 3.32e-3 0.796 8.11e-4 0.753 4.09e3
100% 200% 300% 400% 0 50 100 150 200 ES R(t ) / ES R(0)
Aging time (hour)
Measurement Degradation model 84% 88% 92% 96% 100% 0 50 100 150 200 C 0 (t ) / C 0 (0)
Aging time (hour)
Measurement Degradation model
Fig. 11. Degradation parameters of aluminum capacitor C1_1 with time: ESR(t)/ESR(0) (top) and C0(t)/C0(0) (bottom)
The comparison between degradation models and experimental results of a sample is shown in Fig. 11.
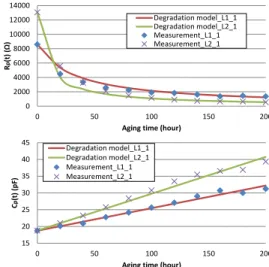
4.2. Modeling of powder iron inductor
The model of the powder iron inductor is illustrated in Fig. 12. The RCL combination is related to the impedance above 200 MHz, which does not change after accelerated aging. The thermal aging affects two parameters: Rp and Cp. We have not found
former studies about the degradation modeling of powder iron inductor. According to the experimental results, an empirical model of degradation parameters is given by:
Rp(t) = Rp(0) / (1 + k3∙t) (3)
Cp(t) = Cp(0) ∙ (1 + k4∙t) (4)
Rp(0), Cp(0) is the Rp and Cp initial value; Rp(t), Cp(t) is the Rp and Cp value at aging time t; k3, k4 are two constants which depend on the
design of the inductor and the aging condition. Unlike the aging degradation of aluminum capacitors, the degradation of inductor demonstrates a great dispersion, as resumed in Table 3. Besides, it seems that there is no constant relation between k3 and k4.
RCL L0 Rp Cp DCR L0: Terminal inductance (H) DCR: DC resistance (Ω) Cp: Parallel capacitance (F) Rp: Parallel resistance (Ω) RLC: Combination of resistances,
inductances and capacitances
22.4 µH 0.06 Ω
8650 Ω
24.2 pF
Fig. 12. Electrical model of the inductor L (value of fresh L1_3)
Table 3
Parameter value of degradation model of inductors
ID k3 R2_Rp(t) k4 R2_Cp(t) k3/k4 L1_1 0.03 0.943 3.6e-3 0.979 8.33 L1_2 0.064 0.916 4.4e-3 0.972 14.55 L1_3 0.142 0.921 7.53e-3 0.935 18.86 L1_4 0.056 0.892 5.54e-3 0.912 10.11 L2_1 0.112 0.983 5.86e-3 0.978 19.11 L2_2 0.371 0.764 21.02e-3 0.914 17.65 L2_3 0.095 0.969 5.85e-3 0.996 16.24 L2_4 0.33 0.905 26.95e-3 0.812 12.24
The proposed empirical degradation model of inductors fits well with the experimental measurement results, as illustrated in Fig.13.
0 2000 4000 6000 8000 10000 12000 14000 0 50 100 150 200 R p (t ) (Ω )
Aging time (hour)
Degradation model_L1_1 Degradation model_L2_1 Measurement_L1_1 Measurement_L2_1 15 20 25 30 35 40 45 0 50 100 150 200 C p (t ) (p F)
Aging time (hour)
Degradation model_L1_1 Degradation model_L2_1 Measurement_L1_1 Measurement_L2_1
Fig. 13. Degradation parameters of inductors with time: Rp(t); Cp(t)
5. Modeling of the evolution of condutcted emission Fig. 14 details the preliminary model of the output side of converter. The converter is modeled by an ideal switch which is controlled by a rectangular voltage source. Besides, the models of passive devices are added to the output side of the switch. The transient simulations are performed with Agilent’s Advanced Designed System (ADS), and the emission level in frequency domain is obtained by the Fast Fourier transform (FFT) of the output voltage. To model the long term behavior of the converter, the degradation models of filtering capacitor and inductor are injected in the simulation. As shown in Fig. 15, the simulation results of output conducted emission envelop fit well with the measurement.
Switch D : R ec tifier L: Model of 22 µH inductor C out2 : Mod el of 100 nF capa cit or Load C out1 : Model of 100 µ F capa cit or 12V 120 Ω 51 Ω 6.8 nF 150 probe Spec trum analyse r 50 Ω
Fig. 14. Output conducted emission modeling of the DC-DC buck converter -40 -20 0 20 40
1E+05 1E+06 1E+07 1E+08 1E+09
Em issi o n le ve l (d B m V) Frequency (Hz) Measurement_Fresh Measurement_Aged 200H Simulation_Fresh Simualation_Aged 200H
-40 -20 0 20 40
1E+05 1E+06 1E+07 1E+08 1E+09
Em issi o n le ve l (d B m V) Frequency (Hz) Measurement_Fresh Measurement_Aged 200H Simulation_Fresh Simualation_Aged 200H
Fig. 15. Output conducted emission envelop simulation results of Card3 (top) and Card6 (bottom)
The simulations of emission variation at two chosen frequencies of Card3 and Card6 are presented in Fig. 15, where the gradual evolution of the conducted emission level with time is also well modeled. The differences between the simulation and measurement can be explained by the accuracy limit of degradation models of passive components due to the randomness of aging impacts [15]. Besides, the temperature increase of components during the operation and the emission measurement error are not taken into account.
-1 0 1 2 3 4 5 6 7 8 9 0 50 100 150 200 Em issi o n le ve l v ar iation (d B )
Time of aging (hour)
Measurement_237 kHz Measurement_70 MHz Simulation_237 kHz Simulation_70 MHz -1 0 1 2 3 4 5 6 7 8 9 0 50 100 150 200 Em issi o n le ve l v ar iation (d B )
Time of aging (hour)
Measurement_237 kHz Measurement_70 MHz Simulation_237 kHz Simulation_70 MHz
Fig. 16. Simulation results of output conducted emission varition with time: Card3 (top) and Card6 (bottom)
6. Conclusion
This paper aims at modelling the thermal aging impact on passive devices and its application for the long-term EME study of a buck DC-DC converter.
Different references of passive devices are tested and compared. The experimental results demonstrate that the aluminum capacitor and the powder iron inductor have a gradual evolution over the aging time. According to the former studies and experimental measurements, the degradation models of aluminum
electrolytic capacitor and powder iron inductor are constructed. Finally, an electrical model of the converter output side is built, where the degradation models of passive components are injected. The simulation results prove that the evolution of the output conducted emission of converter over aging time could be predicted with a good accuracy.
In future studies, more passive samples should be tested to verify and improve the preliminary passive models proposed in this paper. Besides, the dispersions of aging impact are observed, so the statistical analysis should be led in the future study to consider the evolution of EMC safety margins.
References
[1] A. Boyer, S. Ben Dhia, B. Li, N. Berbel, R. Fernandez-Garcia, “Experimental Investigations on electrical Stress Impact on Integrated Circuit Electromagnetic Emission”, IEEE Trans. on EMC, vol. PP, no 99, Feb. 2013.
[2] A. Boyer , S. B. Dhia , B. Li , C. Lemoine and B. Vrignon, "Prediction of long-term immunity of a phase-locked loop", Proc. IEEE 12th Latin-Amer. Test Workshop, pp.1 -6, 2011.
[3] C. Basso, Switch-Mode Power Supplies SPICE Simulations and Practical Designs, McGraw Hill Professional, 2008.
[4] K. Kam, D. Pommerenke, A. Bhargava, C. Lam, R. Steinfeld, F. Centola, “Analysis and Mitigation Techniques for Broadband EMI from Synchronous Buck Converter”, IEEE Electromagnetic Compatibility Magazine, Vol. 1, Quarter 3, 2012.
[5] K. Mainali, R. Oruganti, “Conducted EMI Mitigation Techniques for Switch-Mode Power Converters: A Survey”, IEEE Transactions on Power Electronics, Vol. 25, No 9, September 2010.
[6] Y. Chen. “Electrolytic capacitor failure prediction of lc filter for switching-mode power converters”, Industry Applications Conference, 2005. Fortieth IAS Annual Meeting, 2(2):1464 – 1469, Oct 2005.
[7] A. Lahyani, P. Venet, G. Grellet, P.J. Viverge, “Failure Prediction of Electrolytic Capacitors During Operation of a Switchmode Power Supply,” IEEE Trans. Power Electr., vol. 13, no 6, Nov. 1998.
[8] A. Boyer, H. Huang, S. Ben Dhia, “Impact of thermal aging on emission of a buck DC-DC converter”, 2014
International Symposium on Electromagnetic
compatibility, May 12-16, 2014, Tokyo, Japan. [9] IEC61967-4 Ed. 1.1, “Integrated circuits –
Measurement of electromagnetic emissions, 150 kHz to 1 GHz – Part 4:Measurement of conducted emissions – 1 Ω/150 Ω direct coupling method,” International Electrotechnical Commission, 2006.
[10] Agilent. “Advanced impedance measurement capability of the RF I-V method compared to the network analysis method,” Technical report, 2001
[11] C. Kulkarni, J. Celaya, K. Goebel, and G. Biswas, “Physics based electrolytic capacitor degradation models for prognostic studies under thermal overstress”, European Conference of the Prognostics and Health Management Society, July 2012.
[12] A. Teverovsky, “Reliability of High-Voltage Tantalum Capacitors”, NASA, 2010
[13] J. Huang, L. Mei, and C. Gao, "Life Prediction of
Tantalum Capacitor Based on Gray Theory
Optimization Model,", IEEE Int'l Conf. on Quality and Reliability, Sept. 2011, pp. 166-171.
[14] J.Kindmark and F. Rosen, “Powder Material for Inductor Cores, Evaluation of MPP, Sendust and High flux core characteristics”, Master of Science Thesis, Chalmers University of Technology, Geoteborg, Sweden, 2013
[15] J. Loman, A. Arrao, R. Wyrick, “Long term aging of electronics systems & maintainability strategy for critical applications”, Annual Reliability and Maintainability Symposium, 2003.
[16] F. Periss, P. Venet, G. Rojat and J. M. Refif, “Simple model of an electrolytic capacitor taking into account the temperature and aging time,” Electrical Engineering, Volume 88, Issue 2 , pp 89-95, Sep 2004
![Fig. 1. Schematic of the studied buck DC-DC converter According to the identification test of degraded devices in [8], all the components (including the NCP3163 switching regulator) embedded in the converter have slight impact on](https://thumb-eu.123doks.com/thumbv2/123doknet/14415180.512524/3.892.471.780.753.896/schematic-converter-according-identification-components-including-switching-regulator.webp)