Vous avez des questions? Nous pouvons vous aider. Pour communiquer directement avec un auteur, consultez la
première page de la revue dans laquelle son article a été publié afin de trouver ses coordonnées. Si vous n’arrivez pas à les repérer, communiquez avec nous à PublicationsArchive-ArchivesPublications@nrc-cnrc.gc.ca.
Questions? Contact the NRC Publications Archive team at
PublicationsArchive-ArchivesPublications@nrc-cnrc.gc.ca. If you wish to email the authors directly, please see the first page of the publication for their contact information.
https://publications-cnrc.canada.ca/fra/droits
L’accès à ce site Web et l’utilisation de son contenu sont assujettis aux conditions présentées dans le site LISEZ CES CONDITIONS ATTENTIVEMENT AVANT D’UTILISER CE SITE WEB.
READ THESE TERMS AND CONDITIONS CAREFULLY BEFORE USING THIS WEBSITE.
https://nrc-publications.canada.ca/eng/copyright
NRC Publications Archive Record / Notice des Archives des publications du CNRC : https://nrc-publications.canada.ca/eng/view/object/?id=319c22ff-b36b-402b-a67d-b05d5171f3a7 https://publications-cnrc.canada.ca/fra/voir/objet/?id=319c22ff-b36b-402b-a67d-b05d5171f3a7
Archives des publications du CNRC
Access and use of this website and the material on it are subject to the Terms and Conditions set forth at
Towards estimating the economic burden of waterborne illness in
Canada : what do we know, where do we go?
©National Research Council, Canada, 2012 N A T I O N A L R E S E A R C H C O U N C I L C A N A D A
Towards Estimating the Economic
Burden of Waterborne Illness in
Canada: What Do We Know, Where
Do We Go?
Norman G. Vinson
Poster presented at The Ontario Public Health
April 12, 2012 Norman G. Vinson 2
Copyright Notice
Copyright National Research Council of Canada, 2012.
This document can be copied or distributed under the following conditions:
1- Prior to the distribution, the author is notified via email (at norm.vinson@acm.org) of the people or organizations to which the article will be distributed.
2- Clear attribution is given to the author and the National Research Council of Canada.
Errata
The poster listed the medical costs of treating a GI illness at 517.15 CDN$ (2012) per case. An
adjustment to a denominator reduced the cost to 430.96 CDN$ (2012) per case, leading to a downward revision of total cost from 2.88B to 2.7B CDN$ (2012).
April 12, 2012 Norman G. Vinson 3
ABSTRACT
The economic burden of waterborne illness in Canada is estimated by combining data from a variety of sources. The cost is estimated at 2.7B$ in 2012 CDN$. However, the variability of the data, and the lack of data, both in general and particularly from Canada, introduces great uncertainty into the estimate. Efforts to increase data collection in Canada are recommended to improve the precision of the estimate.
INTRODUCTION
This work represents an initial attempt to estimate the economic burden of waterborne illness in Canada. Such an estimate is needed to inform public policy on water quality management, standards and regulations, cost/benefit estimates for standards and regulations, as well as public water
infrastructure investments.
There are several challenges in calculating such an estimate: Data is scarce
The burden changes over time
It is unclear how to best measure the economic burden
Moreover, the literature on waterborne illness is fragmented into many sub areas, many without reference to economic burden or to each other.
Outbreaks vs. endemic illness
Drinking water vs. water for recreational uses GI vs. legionellosis vs. other illnesses.
To produce an overall estimate, data from these various sources must be combined as best as possible. Unfortunately, much of the data comes from the US and is not readily applicable to Canada due to differences in health care costs and differences in water quality standards and treatment practices. The Method section describes how the data was found, adjusted and combined to produce an estimate for Canada. Limitations of these methods are presented following the results discussion. Finally, we present suggestions about how we can obtain a better, more precise estimate.
METHOD
A literature search focusing specifically on review articles related to the incidence and costs of waterborne illnesses was performed on Google Scholar and Google to retrieve published articles and grey literature. Snowballing led to the retrieval of additional material. As the information in the review articles was insufficient, non-review articles were also examined. Article exclusion criteria, and the application of case number, incidence and costs to Canada are discussed below.
Several illnesses produced by waterborne pathogens were identified. For each of these illnesses, the expected costs to Canada in 2012 were calculated. The sum of these costs represents the Canadian economic burden of waterborne illness. Costs included direct medical spending and productivity losses,
April 12, 2012 Norman G. Vinson 4 represented by wages for the period of time the patient was absent from work. For each illness, a cost per case was computed and then multiplied by the expected number of cases in Canada in 2012. The expected number of cases was computed by multiplying the illness incidence rates by the estimated population of Canada in 2012: 34744847 (Statistics Canada, 2012a). In some cases, incidence rates had to be computed from reported case numbers by dividing them with the relevant population size.
Legionellosis Incidence
Several articles were examined to determine the proportion of hospitalized Community Acquired Pneumonia (CAP) caused by Legionella. Yu and Stout (2008) note that detecting Legionella infection requires Legionella-specific cultures that are not often used, even in prospective studies. Consequently, only the rate of CAP legionellosis of 14% from Vergis et al. (2000) was retained for use in the analyses, as they performed specimen cultures on all cases. Note that this rate is almost 4 times higher than those reported by Marston et al. (1997), Jones (2010), von Baum et al. (2008), and Marrie et al. (2003), which were all in the 3% to 4% range, but in these latter studies, not all case samples were cultured.
Expressing the incidence of legionellosis as a proportion of CAP cases requires us to first determine the incidence of CAP to then determine the number of cases of community acquired legionellosis in Canada. Unfortunately, studies on the incidence of CAP vary enormously in their case definitions and populations considered (e.g. all residents, hospitalized only, adults only). Moreover, the hospitalization criteria for CAP patients differ across countries (Woodhead, 2002). Because our legionellosis rate was limited to hospitalized patients, we focused our attention on studies providing rates of CAP hospitalization with the population as a whole as denominator. The resulting calculation would exclude children and teens hospitalized with legionellosis. However, Fisman et al. (2005) report that 99% of legionellosis cases in their sample were adults (see also Ng et al., 2009). Our rate also ignores legionellosis treated in an ambulatory setting. However, the vast majority of legionellosis patients are hospitalized (Woodhead, 2002). Consequently, despite these limitations, our approach appears to capture most cases of community acquired legionellosis.
To determine the number of hospital-acquired cases of legionellosis in Canada, we averaged several reported ratios of hospital acquired to total cases of legionellosis. This allowed us to add an appropriate number of hospital acquired legionellosis cases to our estimate for community acquired legionellosis cases.
Outbreak Incidence
Outbreak case numbers for 2007 and 2008 were provided by the US Waterborne Disease and Outbreak Surveillance System (WBDOSS) passive surveillance system (Brunkard, et al., 2011; Hlavsa, et al., 2011). Only legionellosis and GI cases were included in our analysis as they accounted for over 90% of the outbreak cases.
Endemic GI Incidence
Incidence rates for endemic GI from public drinking water systems were provided by models developed by Messner et al. (2006) and Colford et al. (2006). These models are based on tap water cohort studies and the risk profiles of US public drinking water systems.
April 12, 2012 Norman G. Vinson 5 GI illness from recreational natural water use was estimated with target GI rates, of 1% to 2% from Health Canada (2009), and a US recreational survey suggesting that 60% of Americans swim in natural waters (United States Department of Agriculture (USDA) Forest Service, National Oceanic and
Atmospheric Administration (NOAA), 2000). This is an underestimate since people most likely swim more than once per season, resulting in multiple exposures. The resulting case estimate for Canada was then doubled to account for GI cases from recreational use of treated waters (such as pools). The doubling is suggested by studies indicating that about half of the recreational waterborne outbreaks are caused by treated water (Hlavsa, et al., 2011; Sinclair, Jones, & Gerba, 2009). Note that there will be some double counting of recreational water GI cases due to the confounding of endemic and outbreak-related GI cases in this estimate.
Otitis Externa Incidence
The incidence of hospitalization for otitis externa was derived from case numbers provided by Collier et al. (2012) who reviewed US data on hospitalizations. The incidence of ambulatory treatment for otitis was provided by a review of US data (Piercefield, Collier, Hlavsa, & Beach, 2011).
Mycoplasma Pneumonia Incidence
Collier et al. (2012) also provided the case numbers from which the Canadian incidence of
hospitalization for mycoplasma pneumonia was calculated. The incidence of mycoplasma pneumonia treated in an ambulatory setting was not considered.
Toxoplasmosis Incidence
Scallan et al. (2011) attributed 50% of toxoplasmosis cases to food, the remaining we assumed to be from water. This is an overestimate as there are certainly zoonotic infections (Heymann, 2008). The incidence of toxoplasmosis treated in an ambulatory setting was not considered.
Costs
Two types of costs were considered: direct medical costs and productivity loss. All costs per case were adjusted for inflation in local currency (pounds, or USD) to 2009 (Bank of England; Bureau of Labor Statistics (US)). Productivity costs were converted to Canadian dollars at the 2009 market exchange rate (of 1.16 for one USD) (Bank of Canada, 2012a), and adjusted for Canadian inflation from 2009 to 2012 (Bank of Canada, 2012b). For medical costs, where applicable, Pounds were converted to USD at the 2009 market exchange rate of 1.6474 (Yahoo!, 2012). 2009 medical costs (expressed in USD) were then applied to a Canadian context by adjusting for differences in 2009 per capita health expenditures (OECD, 2011). This adjustment resulted in US health care costs being multiplied by 0.548, and UK health care costs being multiplied by 1.25. The resulting figure was converted to Canadian dollars at the 2009 market exchange rate (of 1.16), and adjusted for Canadian inflation from 2009 to 2012 (Bank of Canada, 2012b). Costs from Canadian studies (Henson, et al., 2008; Majowicz, et al., 2006) were only adjusted for Canadian inflation (Bank of Canada, 2012b).
Productivity costs resulting from hospitalization for legionellosis, otitis externa, mycoplasma pneumonia, and toxoplasmosis were calculated based on the reported length of stay (Collier, Stockman, Hicks, Garrison, Zhou, & Beach, 2012), and, from 2011, the average Canadian hourly wage, the average weekly hours worked, and the labour participation rate (Statistics Canada, 2012b). Costs for patients treated in
April 12, 2012 Norman G. Vinson 6 the community for legionellosis, mycoplasma pneumonia, and toxoplasmosis were not included. Collier et al. (2012) also provided hospitalization costs for these illnesses.
Medical costs for ambulatory otitis externa cases were provided by Piercefield et al. (2011). Medical and productivity costs for both ambulatory and hospitalized GI cases were provided by several studies (Corso, Kramer, Blair, Addiss, Davis, & Haddix, 2003; Henson, et al., 2008; Majowicz, et al., 2006; Roberts, et al., 2003). After converting these GI costs to 2012 Canadian dollars as described above, the costs from each study were averaged, with the Canadian studies (Henson, et al., 2008; Majowicz, et al., 2006) weighted by 2 since their data did not require conversion to a Canadian context.
RESULTS AND DISCUSSION
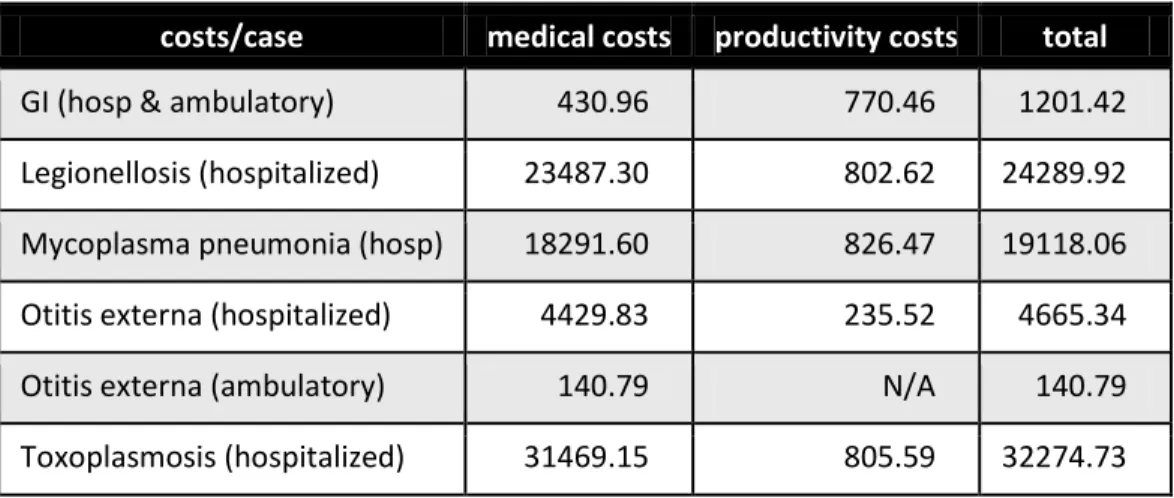
Table 1 Estimated Costs Per Case for Each Illness
costs/case medical costs productivity costs total
GI (hosp & ambulatory) 430.96 770.46 1201.42 Legionellosis (hospitalized) 23487.30 802.62 24289.92 Mycoplasma pneumonia (hosp) 18291.60 826.47 19118.06 Otitis externa (hospitalized) 4429.83 235.52 4665.34 Otitis externa (ambulatory) 140.79 N/A 140.79 Toxoplasmosis (hospitalized) 31469.15 805.59 32274.73
Costs in 2012 Canadian dollars.
Table 1 shows that productivity costs are larger than medical costs for GI. The reason is that many GI cases do not require hospitalization. This highlights the importance of accounting for productivity costs, particularly for GI cases. Most legionellosis cases are assumed to be hospitalized (Woodhead, 2002). Consequently, all costs for non-hospitalized cases would be very low compared to costs for hospitalized cases. Nonetheless, this assumption should be empirically verified. Moreover, future estimates should endeavour to obtain costs for ambulatory mycoplasma and toxoplasmosis cases.
Note also that the pneumonia and toxoplasmosis costs are an order of magnitude greater than the cost of GI illness.
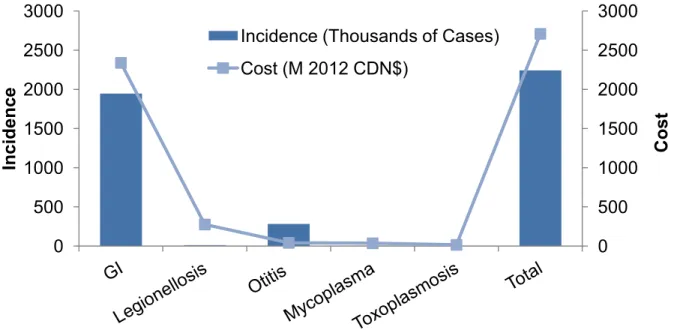
While the costs per case for GI are lower than for most of the other illnesses, the incidence is so much higher that the total cost (cases X cost/case) of waterborne GI illness far exceeds the costs of all other waterborne illnesses (Figure 2). The total cost of waterborne illness in Canada, in 2012, is estimated at 2.7B dollars.
April 12, 2012 Norman G. Vinson 7
Figure 2 Estimated Incidence and Cost by Illness in 2012 Canadian Millions of Dollars
The total cost of waterborne illness in Canada, in 2012, is estimated at 2.7B dollars.
The data shown in Figure 3 (below) indicate that endemic illness is a much more important source of GI illness than outbreaks. Similarly, legionellosis outbreaks are estimated to be responsible for less than a dozen cases, while total Canadian incidence is expected to exceed 10 thousand cases.
Figure 3 Estimated GI Incidence by Exposure
224
721
1,320,304
625,407
drinking water
recreational water
drinking water
recreational water
Estimated Number of Cases
e
n
d
e
m
ic
o
u
tb
rea
ks
0
500
1000
1500
2000
2500
3000
0
500
1000
1500
2000
2500
3000
Cost
Inc
ide
nce
Incidence (Thousands of Cases)
Cost (M 2012 CDN$)
April 12, 2012 Norman G. Vinson 8
LIMITATIONS AND RECOMMENDATIONS
It is important to note that this estimate suffers from a number of very serious limitations. Generally, the estimates are based on very little epidemiological data. In addition, the cost data for every illness but GI is from the US. While the US health care costs were converted to Canadian health care costs using PPP-adjusted health spending, it is not clear that this provides an accurate result. As general
conclusions, we can say that much more Canadian epidemiological data is needed, including the identification of the pathogens, reservoirs, vectors, and sources relating to each type of illness.
Considering specifically GI, the estimate for endemic illness from drinking water is based on two models that i corporate risk factors for the US’ dri ki g ater syste s. Gi e the differe t regulatory regi es in Canada and the US, it seems unlikely that these models would generalize well to Canada. Moreover the models are based on less than a handful of epidemiological drinking water studies. The variation in source water quality and treatment practices suggests that more than a few studies would be needed to get an accurate estimate of incidence. The estimate for endemic GI illness from recreational water exposure is even less certain. Again, there is very little epidemiological data (Dorevitch, et al., 2010), the water quality variation in natural waters should be even greater than that for treated drinking water, and the recreation water use survey (United States Department of Agriculture (USDA) Forest Service, National Oceanic and Atmospheric Administration (NOAA), 2000) does not provide adequate exposure information. It may be possible to leverage our Canadian seasons to better estimate the attributable rate of illness from exposure to natural waters, and perhaps also to treated recreational waters, as there will be much less exposure in winter.
The critical question regarding legionellosis incidence is whether culture data will confirm a much higher incidence of community acquired legionellosis (of about 14% of hospitalized cases (Vergis, et al., 2000)) or whether the rate is nearer to 3.5%, as many other studies have indicated (Jones, 2010; Marrie, De Carolis, Yu, & Stout, 2003; Marston, et al., 1997; von Baum, et al., 2008). Moreover, a prospective study, using Legionella-specific cultures, that includes ambulatory cases could also find a larger proportion of ambulatory legionellosis than has previously been believed. Nosocomial incidence should also be verified with culture use.
It is also unclear how to characterize the economic aspects of waterborne illness. GI illnesses are not expected to have much impact on measures incorporating mortality and disability (Kwong, et al., 2010) as hospitalization rates are low (Henson, et al., 2008). Consequently, for waterborne GI illnesses, measuring direct medical costs and indirect costs of productivity loss probably provides the most reasonable metric of economic burden. However, this is not the case for legionellosis. Indeed, the Ontario Burden of Infectious Disease study determined legionellosis to be responsible for 17th highest loss in health adjusted life years among infectious disease in Ontario (Kwong, et al., 2010). von Baum et al. (2008) estimated the mortality rate of legionnaire's disease to be 12.8% in Germany. Consequently, the costs of legionellosis may best expressed by a measure that takes mortality into account, such as the measures used by Kwong et al. (2010). Future studies could perhaps express the cost of measures to reduce waterborne illness in net dollars per Quality-Adjusted Life Year (QALY) (National Health Service
April 12, 2012 Norman G. Vinson 9 (NHS) National Institute for Health and Clinical Excellence, 2010), thus taking into account direct medical costs, indirect productivity costs, mortality, and the costs to reduce incidence.
REFERENCES
Bank of Canada. (2012a). 10-Year Currency Converter. Retrieved March 20, 2012, from Bank of Canada: http://www.bankofcanada.ca/rates/exchange/10-year-converter/
Bank of Canada. (2012b). Inflation Calculator. Retrieved March 20, 2012, from Bank of Canada: http://www.bankofcanada.ca/rates/related/inflation-calculator/
Bank of England. (n.d.). Inflation Calculator. Retrieved March 20, 2012, from Bank of England: http://www.bankofengland.co.uk/education/Pages/inflation/calculator/flash/default.aspx Brunkard, J., Ailes, E., Roberts, V., Hill, V., Hilborn, E., Craun, G., et al. (2011). Surveillance for
waterborne disease outbreaks associated with drinking water—United States, 2007–2008. Morbidity
and Mortality Weekly Report Surveillance Summaries , 60 (12).
Bureau of Labor Statistics (US). (n.d.). CPI Inflation Calculator. Retrieved March 20, 2012, from Bureau of Labor Statistics: http://www.bls.gov/data/inflation_calculator.htm
Colford, J., Roy, S., Beach, M., Hightower, A., Shaw, S., & Wade, T. (2006). A review of household drinking water intervention trials and an approach to the estimation of endemic waterborne gastroenteritis in the United States. Journal of Water and Health , 4 (2 suppl.), 71-88. Collier, S. A., Stockman, L. J., Hicks, L. A., Garrison, L. E., Zhou, F. J., & Beach, M. J. (2012). Direct
healthcare costs of selected diseases primarily or partially transmitted by water. Epidemiology &
Infection .
Corso, P., Kramer, M., Blair, K., Addiss, D., Davis, J., & Haddix, A. (2003). Cost of illness in the 1993 waterborne cryptosporidium outbreak, Milwaukee, Wisconsin. Emerging Infectious Diseases , 9 (4), 426-431.
Dorevitch, S., Ashbolt, N., Ferguson, C., Fujioka, R., McGee, C., Soller, J., et al. (2010). Meeting report: knowledge and gaps in developing microbial criteria for inland recreational waters. Environmental
Health Perspectives , 118 (6), 871-876.
Fis a , D., Li , S., Welle ius, G., Joh so , C., Britz, P., Gaski s, M., et al. 2005 . It’s ot the heat, it’s the humidity: wet weather increases legionellosis risk in the greater Philadelphia metropolitain area.
Journal of Infectious Diseases , 192 (12), 2066-2073.
Health Canada, Federal-Provincial-Territorial Working Group on Recreational Water Quality of the Federal-Provincial-Territorial Committee on Health and the Environment. (2009). Guidelines for
April 12, 2012 Norman G. Vinson 10 Henson, S., Majowicz, S., Masakure, O., Sockett, P., MacDougall, L., Edge, V., et al. (2008). Estimation of
the costs of acute gastrointestinal illness in British Columbia, Canada. International Journal of Food
Microbiology , 127 (1-2), 43-52.
Heymann, D. (2008). Control of Communicable Diseases Manual, 19th Ed. American Public Health Association.
Hlavsa, M., Roberts, V., Anderson, A., Hill, V., Kahler, A., Orr, M., et al. (2011). Surveillance for
waterborne disease outbreaks and other health events associated with recreational water — United States, 2007–2008. Morbidity and Mortality Weekly Report Surveillance Summaries , 60 (12).
Jones, R. (2010). Microbial etiologies of hospital-acquired bacterial pneumonia and ventilator-associated bacterial pneumonia. Clinical Infectious Diseases , 51 (S1), S81-S87.
Kwong, J., Crowcroft, N., Campitelli, M., Ratnasingham, S., Daneman, N., Deeks, S., et al. (2010). Ontario
Burden of Infectious Disease Study (ONBOIDS): An OAHPP/ICES Report. Toronto: Ontario Agency for
Health Protection and Promotion, Institute for Clinical Evaluative Sciences.
Majowicz, S., McNab, W., Sockett, P., Henson, T., Doré, K., Edge, V., et al. (2006). Burden and cost of gastroenteritis in a Canadian community. Journal of Food Protection , 69 (3), 651-659.
Marrie, T., De Carolis, E., Yu, V., & Stout, J. (2003). Legionnaires' disease - Results of a multicentre Canadian study. Canadian Journal Infectious Diseases. , 14 (3), 154-158.
Marston, B., Plouffe, J., File, T., Hackman, B., Salstrom, S.-J., Lipman, H., et al. (1997). Incidence of community-acquired pneumonia requiring hospitalization: results of a population-based active surveillance study in Ohio. Archives of Internal Medicine , 157 (15), 1709-1718.
Messner, M., Shaw, S., Regli, S., Rotert, K., Blank, V., & Soller, J. (2006). An approach for developing a national estimate of waterborne disease due to drinking water and a national estimate model application. Journal of Water and Health , 4 (2 suppl.), 201-240.
National Health Service (NHS) National Institute for Health and Clinical Excellence. (2010). Measuring
effectiveness and cost effectiveness: the QALY. Retrieved March 20, 2012, from
http://www.nice.org.uk/newsroom/features/measuringeffectivenessandcosteffectivenesstheqaly.js p
Ng, V., Tang, P., Jamieson, F., Guyard, C., Low, D., & Fisman, D. (2009). Laboratory-based evaluation of legionellosis epidemiology in Ontario, Canada, 1978 to 2006. BMC Infectious Diseases , 9 (68). OECD. (2011). OECD Health Data 2011 - Frequently Requested Data. Retrieved March 20, 2012, from
OECD Directorate for Employment, Labour and Social Affairs:
http://www.oecd.org/document/16/0,3746,en_2649_33929_2085200_1_1_1_1,00.html
Piercefield, E., Collier, S., Hlavsa, M., & Beach, M. (2011). Estimated Burden of Acute Otitis Externa --- United States, 2003--2007. Morbidity and Mortality Weekly Report (MMWR) , 60 (19), 605-609.
April 12, 2012 Norman G. Vinson 11 Roberts, J., Cumberland, P., Sockett, P., Wheeler, J., Rodrigues, L., Sethi, D., et al. (2003). The study of
infectious intestinal disease in England: socio-economic impact. Epidemiology and Infection , 130 (1), 1-11.
Scallan, E., Hoekstra, R., Angulo, F., Tauxe, R., Widdowson, M., Roy, S., et al. (2011). Foodborne illness acquired in the United States—major pathogens. Emerging Infectious Diseases , 17 (1), 7-15. Sinclair, R., Jones, E., & Gerba, C. (2009). Viruses in recreational water-borne disease outbreaks: a
review. Journal of Applied Microbiology , 107 (6), 1365-2672.
Statistics Canada. (2012a). Canada's Population Clock. Retrieved March 27, 2012, from Statistics Canada: http://www.statcan.gc.ca/ig-gi/pop-ca-eng.htm
Statistics Canada. (2012b). Average Hourly Wages of Employees by Selected Characteristics and
Profession, Unadjusted Data, by Province (Monthly). Retrieved March 20, 2012, from Statistics
Canada: http://www40.statcan.gc.ca/cbin/ze/w40re.cgi/l01/cst01/labr69a-eng.htm
United States Department of Agriculture (USDA) Forest Service, National Oceanic and Atmospheric Administration (NOAA). (2000). National Survey on Recreation and the Environment (NSRE 2000),
Summary 1: Outdoor Recreation Participation in the United States. USDA & NOAA.
Vergis, E., Indorf, A., File, T., Phillips, J., Bates, J., et al. (2000). Azithromycin vs Cefuroxime plus
Erythromycin for empirical treatment of community-acquired pneumonia in hospitalized patients: a prospective, randomized, multicenter trial. Archives of Internal Medicine , 160 (9), 1294-1300. von Baum, H., Ewig, S., Marre, R., Suttorp, N., Gonschior, S., Welte, T., et al. (2008). Community-acquired
legionella pneumonia: new insights from the German competence network for community acquired pneumonia. Clinical Infectious Diseases , 46 (9), 1356-1364.
Woodhead, M. (2002). Community-acquired pneumonia in Europe: causative pathogens and resistance patterns. European Respiratory Journal , 20 (36, suppl), 20s-27s.
Yahoo! (2012). Currency Converter. Retrieved March 20, 2012, from Yahoo! Finance Canada: http://ca.finance.yahoo.com/currencies/converter/#from=GBP;to=USD;amt=1
Yu, V., & Stout, J. (2008). Community-Acquired Legionnaires Disease: Implications for Underdiagnosis and Laboratory Testing. Clinical Infectious Diseases , 1365-1367.