HAL Id: cea-02388996
https://hal-cea.archives-ouvertes.fr/cea-02388996
Submitted on 2 Dec 2019
HAL is a multi-disciplinary open access
archive for the deposit and dissemination of sci-entific research documents, whether they are pub-lished or not. The documents may come from teaching and research institutions in France or abroad, or from public or private research centers.
L’archive ouverte pluridisciplinaire HAL, est destinée au dépôt et à la diffusion de documents scientifiques de niveau recherche, publiés ou non, émanant des établissements d’enseignement et de recherche français ou étrangers, des laboratoires publics ou privés.
Hafnium solubility determination in soda-lime
aluminosilicate glass
Pierrick Chevreux, Annabelle Laplace, Etienne Deloule, Laurent Tissandier,
Nicolas Massoni
To cite this version:
Pierrick Chevreux, Annabelle Laplace, Etienne Deloule, Laurent Tissandier, Nicolas Massoni. Hafnium solubility determination in soda-lime aluminosilicate glass. Journal of Non-Crystalline Solids, Elsevier, 2017, 457, pp.13-24. �10.1016/j.jnoncrysol.2016.11.009�. �cea-02388996�
Hafnium solubility determination in soda-lime aluminosilicate glass
P. Chevreux(a,b), A. Laplace(a), E. Deloule(b), L. Tissandier(b), N. Massoni(a)
(a) CEA, DEN, DTCD, LDMC, Marcoule, F30207 Bagnols sur Cèze cedex, France
(b) Centre de Recherches Pétrographiques et Géochimiques, UMR 5873 CRNS, Université
de Lorraine, BP 20, F54501, Vandoeuvre les Nancy cedex, France
Abstract
The solubility of hafnium dioxide (HfO2), used as an uranium surrogate, is measured in glass
melts belonging to the CaO-Al2O3-SiO2 and Na2O-CaO-Al2O3-SiO2 systems, under oxidizing
and reducing conditions. Two methods have been carried out to determine it and the kinetic factors controlling the HfO2 dissolution in glass melt have been investigated in order to
approach equilibrium. The solubility ranges from 3 to 6.5 mol% HfO2 in aluminosilicate
glasses at temperature between 1250°C and 1400°C, and is not affected by the redox conditions. Conversely, the solubility is modified by the melting temperature and the glass composition. The excess of alkalies or alkaline earths which are not involved in the charge balance of AlO4 tetrahedrons in the silica network appears to play a significant role. Glass
homogeneity is checked by scanning electron microscopy and X-ray diffraction. HfO2,
HfSiO4, Ca2HfSi4O12, Na4Hf2(SiO4)3 and Na2HfSi2O7 are metastable crystals observed in the
glass melts. The stability of those crystalline phases mainly depends on the glass composition.
Keywords
Hafnium oxide, solubility, aluminosilicate glass melt, reducing conditions, crystallization.
1
Introduction
1.1 Background
Reprocessing of the spent nuclear fuel generates High Level Waste (HLW) which contains fission products and actinides. To be immobilized, these HLW are incorporated at about 1100°C in a borosilicate glass matrix. In the same way, Intermediate Level Waste (ILW) including both actinides and metals are planned to be confined by a vitrification process. The metallic fraction is melted with the glass melt at a higher temperature, between 1250°C and 1400°C, and the glass melt is expected to incorporate the actinides, uranium and plutonium mainly, in its silicate network. As boron is known to volatilize from borosilicate melts at high temperature [1], aluminosilicate glasses appear as better candidates for that process. Besides, the molten metal phase imposes a strongly reducing environment to the glass melt and thus impacts actinides oxidation state and consequently their solubilities. In highly reducing conditions, UIV and PuIII are the main forms expected in the melt. Plutonium is more soluble in glass melted in reducing conditions (PuIII) [2] while uranium is more soluble in oxidizing conditions (UVI) [3]. Moreover, only few data about uranium solubility in glasses melted in reducing conditions are given in the literature [3-7] and fundamental data on uranium behavior in aluminosilicate glasses have to be investigated in such conditions. This study presents characteristics of aluminosilicate glasses containing hafnium (HfIV) which is taken as uranium surrogate [8-11]. Uranium and hafnium are both heavy elements and display quite similar ionic radii for a given coordination number. Preliminary results with hafnium are shown here, before a further study with uranium. The first objective of this work is to study hafnium incorporation into a glass-forming melt under reducing environment and
to optimize the Hf-doped glasses elaboration conditions in order to approach equilibrium. The second objective is to determine hafnium solubility as a function of the melting temperature, the glass composition and the redox conditions. Hafnium crystallization is also investigated. 1.2 State of the art
The thermodynamic solubility of an element in the glass is the maximum concentration of this element that can be loaded in the glass network at a given temperature. To determine it, two methods are commonly used. The first one consists in gradually increasing the amount the element to incorporate in the glass until a heterogeneous phase appears in the system (crystallization or/and demixing) [12]. The second one is embodied in introducing the desired element in excess in the glass and measuring its concentration in the vitreous matrix [13, 14]. That means the saturated glass melt shows lots of heterogeneities. To make a difference between the gradation and the saturation methods, we named the last one the saturation solubility (SS). The issue of reaching the equilibrium is raised in both cases. To approach
equilibrium, the system has to verify several conditions [15], and if not, a conditional solubility (SC) can be introduced notably for the gradation method [2, 10]. This solubility depends on
the experimental conditions used by the authors and it may be lower than the thermodynamic solubility for the gradation method or higher for the saturation technique [16].
Most hafnium solubility studies are focused on borosilicate glasses. Lopez measured conditional solubilities in a borosilicate glass as function of the melting temperature [10]. At 1400°C, hafnium conditional solubility was between 1.2 and 1.5 mol% HfO2. Cachia [17]
reported a higher conditional solubility at the same temperature, between 1.8 and 2.2 mol% HfO2 in the same glass by modifying the experimental protocol. In the Na2O-B2O3 system,
Res [18] observed that increasing the Na2O concentration improved the HfO2 solubility up to
12 mol% HfO2 at 1400°C for a glass containing 18 mol% Na2O. Nevertheless, some
droplet-like micro-heterogeneities were revealed by SEM in clear glasses. Feng [19] found that hafnium solubility in a sodium boro-aluminosilicate was positively related to the excess of Na2O relative to Al2O3. At 1450°C, the highest solubility measured in a Na-rich glass was
14.4 mol% HfO2. Unfortunately, few data are given about the way of determining that
solubility limit. The relationship between the hafnium solubility and glass composition was also investigated by Davis [8]. He demonstrated that the solubility limit of HfO2 in peralkaline
glasses (Na2O mol% > Al2O3 mol%) in the system SiO2-Al2O3-B2O3-Na2O was linearly and
positively correlated with the molar Na2O/(Na2O+Al2O3) ratio. The solubility of HfO2 in these
glasses ranged from 2 to 16 mol% at 1450°C. This “peralkalinity effect” had been alike observed in B-free glass melts for +4 cations (such as ZrIV and TiIV) [14, 15, 20]. In contrast, the mechanism for HfO2 dissolution seems to be different in peraluminous glasses (Na2O
mol% < Al2O3 mol%). In the peraluminous meIts, the HfO2 measured solubility by Davis [8] is
lower than 3 mol% and, B2O3 and Al2O3 may help to solubilize it. Ellison [20] showed that
hafnium solubility decreased in B-free peraluminous melts in the system SiO2-Al2O3-Na2
O-K2O with the SiO2 content increasing and measured solubility limits lower than 1 mol% HfO2
in equilibrated liquids at 1400°C. Above the solubility limit, the Hf-bearing crystallized phases were mainly monoclinic hafnia (HfO2) [8, 9, 18] and occasionally hafnon (HfSiO4) [10, 20].
All these authors had melted their glasses under oxidizing conditions, namely in air and in Pt-Rh, ZrO2 or Al2O3 crucibles.
2
Experimental and analytical procedures
2.1 General features
Hf solubility was determined in two simplified aluminosilicate glasses based on the industrial glass formulation A and B, A glass containing 22.33 mol% Na2O while B being sodium free
(Table 1) and for two bracketing temperatures (1250°C and 1400°C). Redox conditions during the Hf-doped glasses meting were changed using different types of crucibles and atmospheres. Platinum crucible (Pt-5%Au) and air atmosphere were used for oxidizing conditions, while pure graphite (Cg) or graphite and silicon carbide (C-SiC) crucibles and
argon (Ar) atmosphere imposed reducing conditions. The C-SiC crucible (A5/0 Salamander Super, Morgan MMS) is a type of crucible frequently used in the metallurgy field. It is mainly composed of Cg, SiC, a mullite binder (3Al2O3-2SiO2) and some impurities such as Fe3Si. Ar
atmosphere was used to prevent these crucibles from corrosion. 2.2 Glass fabrication
2.2.1 Starting glasses
The A and B glasses (Table 1) were prepared with the following commercial precursors: SiO2
(Sifraco, 0.994); Na2CO3 (Sigma-Aldrich, 1); CaO (Aldrich, 0.999); Al2O3 (Sigma-Aldrich, 1).
For the Na-rich A glass, a decarbonation step was previously performed at 850°C for 6h. Then, the mixed components (≈150 g) were melted at 1400°C for 3h in a platinum crucible (Pt-10%Rh), under air. Glass melts were then poured in stainless steel plate, milled and screened up to 400 μm particle size to be further used as starting glass materials for Hf-doped glasses. Milling was performed in a tungsten carbide (WC) vessel using WC balls (Planetary Ball Mill PM 200).
Hafnium was added as HfO2 powder (Alfa Aesar, 0.999) and mixed with the former glass
powders. Three different types of hafnium particle size were used: 15, 70 and 158 μm. The particle size, expressed as the median value (d50) and size distribution of powders were
determined from the volume distribution measured by a laser granulometer (Malvern Mastersizer 3000) in ethanol.
C glass was formed by adding 1.56 mol% HfO2 to the Na-rich glass (Table 1). This value of
1.56 mol% HfO2 is a relevant content for the industrial process. Moreover, the hafnium
solubility in glass melt should be higher than this value as referenced in paragraph 1.2.
Table 1
Targeted chemical compositions of main glasses.
Glass composition (mol%)
Sample name SiO
2 Al2O3 CaO Na2O HfO2
A 57.43 6.25 13,99 22.33 0
B 57.43 6.25 36.32 0 0
2.2.2 Optimized protocol definition for Hf-doped glasses
The influence of different experimental parameters (HfO2 particle size, fusions number,
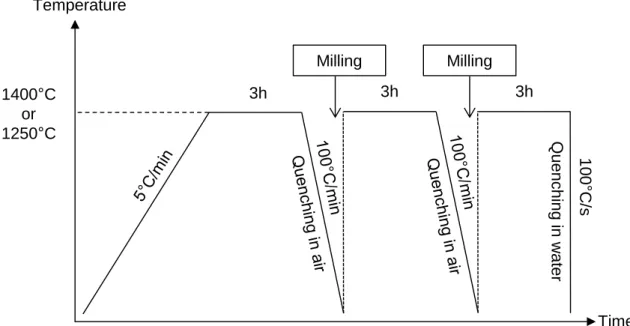
melting time and temperature) has been checked for the C glass elaboration in order to optimize the process (Table 2). The powder mixture (≈3 g) was melted in a C-SiC crucible under Ar atmosphere. After melting, the molten glass was cooled by shutting off the heat source (cooling rate < 8°C/min). In case of several meltings, each remelting was preceded by a glass sample milling step (WC vessel and ball, Mixer Mill MM 200) to ensure its homogenization. Final glass samples were removed from the crucible and have roughly a 20 mm diameter and 6 mm height (Figure 2). An optimized protocol was then defined for Hf solubility measurements. To minimize hafnium sedimentation and its heterogeneities, fine HfO2 powders were used (15 µm particle size). Remeltings enabled to homogenize the whole
glass melt. The 3h run duration allowed to avoid bubbles and longer run duration did not really impact the HfO2 dissolution and had the drawback of increasing the Na volatilization.
Thus, the experimental procedure followed for solubility measurements comprised three meltings for 3h at 1250°C or 1400°C with two intermediate glass millings (Figure 1).
Table 2
Glass elaboration parameters of 1.56 mol% HfO2-doped glasses melted in C-SiC crucible.
Sample name
Glass elaboration parameters
Melting time Melting
temperature HfO2 particle size Fusions number C0 3h 1250°C 70 μm 1 C1 12h 1250°C 70 μm 1 C2 3h 1400°C 70 μm 1 C3 3h 1250°C 158 μm 1 C4 3h 1250°C 15 μm 1 C5 3h + 3h 1250°C 70 μm 2 C6 3h + 3h +1h 1250°C 70 μm 3
A and B glass powders were respectively mixed with different amounts of HfO2, ranging from
1.56 mol% to 10 mol% HfO2 in the final glass. The powder mixture was fused either in a
Pt-Au crucible and air atmosphere (oxidizing conditions) or in a C-SiC (or Cg) crucible under Ar
atmosphere (reducing conditions). Glasses were directly quenched in air (cooling rate about 100°C/min) and then milled. The milling and remelting steps were done twice. Finally, the crucible was removed from the hot furnace and quenched immediately by immersing the bottom of the crucible into a cold water bath to prevent crystallization during cooling (cooling rate about 100°C/s). Glasses were not annealed.
Figure 1. The general procedure of glass elaboration for Hf solubility measurements.
2.3 Glass characterizations
2.3.1 Homogeneity
Glass sample homogeneity was determined by scanning electron microscopy (SEM) and X-ray diffraction (XRD). Secondary phases morphology and size were observed by SEM (Phillips XL30-WTMP and ZEISS Supra 55 FEG) coupled with energy dispersive X-ray spectroscopy (Brucker EDS analyser) allowing glass composition semi-quantitative analysis. The conditions for electron microprobe analysis were an acceleration voltage 15 keV, a total of 5.105 counts and a Phirho(Z) method with standards. For SEM observations, crucible-shaped glass samples were cut in the middle and mounted in epoxy resin before being polished and carbon coated. Crystalline phases were identified by a PANalytical diffractometer (X’Pert MPD Pro, Bragg-Bretano geometry using a Ni-filtered the Cu Kα radiation, solid detector X’Celerator) using the EVA software from Bruker AXS company. The data acquisition was completed in the step scan mode (10-90° 2θ, step size 0,017° 2θ, total time counting of at least 5h). XRD measurements were carried out on glass powders. The modelization of the X-ray pattern was performed in two steps using the Fullprof_Suite program [21]. Lattice parameters were first determined by the whole pattern decomposition then the structure was modeled by the Rietveld technique. Rietveld refinement was realized for highly crystallized glasses to assess the phases inventory previously done and obtain the relative mass fraction of each crystalline phase. For the latter, the amorphous phase is not considered.
2.3.2 Properties
The glass density was measured using a hydrostatic balance; the glass was weighed in air and then, in water according to Archimedes’ principle. The reported density represents the mean value of three measurements.
Viscosity measurements were performed by a stress imposed rheometer (Rheometrics Scientific SR 5000) [22]. Basically, the rheometer was located above a vertical tubular furnace and a cylindrical crucible was placed in the furnace center. Rheological measurements were realized with a cylindrical rotor in the Couette geometry. Measurements
3h 3h 3h 100 ° C /s Milling Milling Time Temperature 1400°C or 1250°C Q ue nch ing in w ater
were performed at several temperatures. For Newtonian melts, a model following a Vogel-Fulcher-Tammann (VFT) law was applied [23].
3
Results
3.1 Hafnium incorporation
3.1.1 Sedimentation and heterogeneities
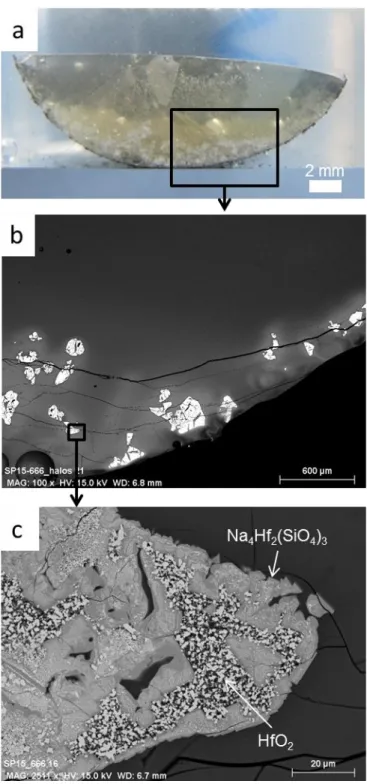
The C3 glass sample containing 1.56 mol% HfO2 (158 μm particle size) and elaborated for 3
hours at 1250°C is firstly observed. The glass is transparent with a slightly yellowish tint, probably, due to minor contamination from the crucible or the grinding vessel (Figure 2) [8]. Hafnia sedimentation is clearly observed at the bottom (Figure 2a) and the sample displays two distinct parts. In the top half, glass seems to be homogeneous without any crystalline phases, which is confirmed by SEM images (Figure 2b). Few bubbles are noticed. Heterogeneities, composed of crystal clusters, are only detected at the bottom (Figure 2b). According to XRD patterns, the crystalline phases are monoclinic HfO2, hexagonal
Na4Hf2(SiO4)3 and triclinic Na2ZrSi2O7 (more details in paragraph 3.2.2). Graphite Cg is also
detected by XRD. Hafnium being a heavy element, it is easily observable using back scattered electrons (BSE). In the analyzed section, Na4Hf2(SiO4)3 and HfO2 crystals are
identified by SEM (Figure 2c) contrary to the crystalline phase Na2ZrSi2O7. White halos
surrounding theses crystals are also observed in BSE (Figure 2b), which demonstrates hafnium enrichment in the vitreous matrix. An hafnium concentration gradient in the glass matrix is observed in the whole sample, a lower concentration at the top and in the middle of sample (between 0.3 and 0.4 mol% HfO2) than at the bottom (1.3 mol% HfO2)(Figure 3a).
Figure 2. Picture (a) and scanning electron microscopy images (b) and (c) of heterogeneities observed in
Hf-doped glass (C3 sample).
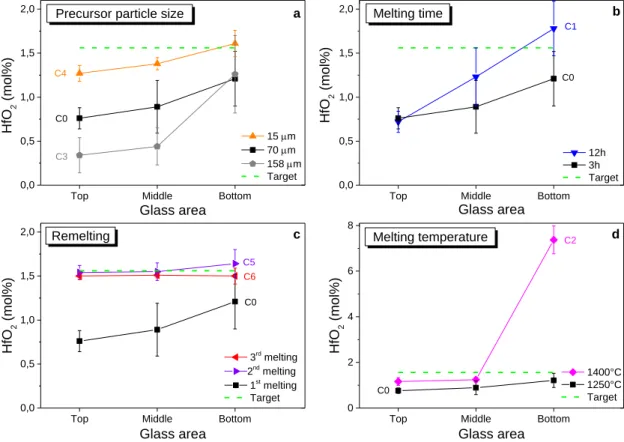
To avoid these heterogeneities, several parameters were investigated such as hafnium precursor particle size, run duration, meltings number and temperature (Table 1). The glass sample microstructure was observed by SEM (Figure 4) and the HfO2 concentration in glass
network was determined by EDS analysis in three specific glass areas and compared to the targeted value, 1.56 mol% HfO2 (Figure 3). The absence of HfO2 compositional gradients in
3.1.2 Effect of precursor particle size
C0, C3 and C4 glass samples followed identical thermal treatment (1250°C, 3h) but were prepared with different hafnium powder particle sizes, namely and respectively 158, 70 and 15 μm. The decrease of the HfO2 particle size widely limits the HfO2 sedimentation by
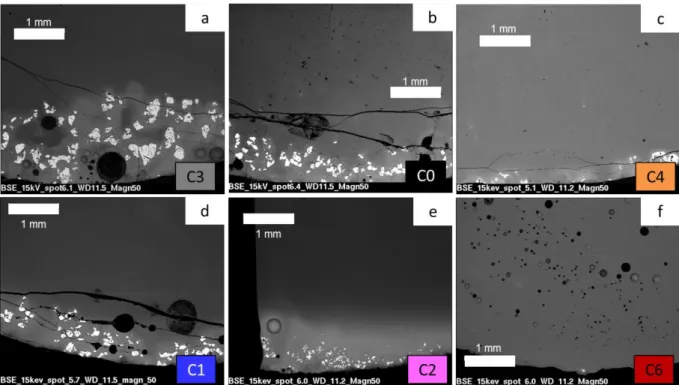
decreasing the amount and size of hafnium crystals in the glass (Figure 4a, b and c). The size of agglomerated crystals is from 200 to 400 μm sized in the C3 glass compared to 50-100 μm in the C0 glass. In the C4 glass, where hafnium particle size is very fine (15 μm), only a few of those crystals are noticed. Moreover, reactivity between glass and hafnium powders is enhanced using fine powders (increase of the reactive surface for a given volume). As a consequence, hafnium concentration in the glass melt is largely increased and almost reaches the targeted value (Figure 3a). However, a concentration gradient still remains in the whole sample. In the next parts, the intermediate 70 μm particle size (C0 glass) is selected to study the effect of the other parameters.
3.1.3 Effect of melting time
C0 and C1 glasses were elaborated at 1250°C for, respectively 3h and 12h. Increasing melting time does not change the samples general feature. White halos, hafnium concentration gradient and hafnium crystals at the bottom were still identified in the C1 glass (Figure 3band Figure 4d). Nevertheless, hafnium concentration is higher at the bottom and the middle in the C1 glass than in the C0 one (about 40-50% more). On top of the sample, the hafnium concentration remains the same.
3.1.4 Effect of remelting
To achieve good homogenization, glasses are usually milled and melted several times [9, 11, 20]. A standard remelting procedure was introduced with an intermediate milling step. Glass samples were melted once (C0 glass), twice (C5 glass) or three times (C6 glass) at 1250°C (Table 2). The hafnium concentration gradient has almost vanished after the second melting (Figure 3c). Hafnium concentration in the C5 glass is very close to the targeted value. Nevertheless, few hafnium crystals still stay at the bottom. After the third melting, C6 glass is homogeneous in concentration and only one hafnium crystal is found in the whole sample (Figure 4f). Bubbles are observed in both C5 and C6 glasses because of introduced air by the milling step. The milling step appears to be essential to homogenize the glass. This method (successive milling and remelting steps) is a convenient way of “stirring” the melt, and thus of improving dissolution kinetics, when thermal treatments can only be realized under static conditions [6, 24].
3.1.5 Effect of melting temperature
The impact of the melting temperature was briefly studied. Indeed, some authors managed to get equilibrated melts by increasing the temperature up to 1560°C [8]. In this study, the melting temperature was limited to 1400°C to minimize Na volatilization. A C2 glass sample was synthetized at 1400°C for 3h. Figure 3d shows that temperature increasing improves hafnium solubilization in the whole glass. Nonetheless, hafnium concentration gradient is also emphasized. At the bottom, a thick and whiter Hf-rich layer, about 0.65-1 mm (versus the 6 mm glass height) is observed (Figure 4e). This layer contains HfO2 crystals and the
surrounding Hf concentration is estimated up to 7.5 %mol HfO2 in the melt. Above that layer,
the Hf concentration is below 1.56 mol%. The crystalline phase Na4Hf2(SiO4)3 seems to be
entirely dissolved in the glass at 1400°C as a reaction intermediate.
As expected, the C-SiC crucible provides a strong reducing environment and is able to reduce part of Na2O to the metallic form Na0 at high temperature [25]. In these experiments,
the glass lost, respectively, 14% and 28% of Na2O after 3h and 12h at 1250°C. The Na loss
was around 37% after two meltings of 3h at 1250°C and 38% after 3h at 1400°C.
These first experiments enabled to define an optimized Hf-doped glass elaboration procedure (Figure 1) allowing to approach the equilibrium and thus to measure solubility limits, while limiting the compositional changes due to alkali loss.
Figure 3. Variation in HfO2 concentration as a function of glass area for several glasses elaborated in different conditions. Impact of (a) HfO2 particle size, (b) melting time, (c) remelting, (d) melting temperature. HfO2 concentration as related to mole percent. Error bars represent the random standard uncertainty calculated by multiplying the standard deviation of the mean and the student t-factor at the 95% level of confidence.
Top Middle Bottom
0,0 0,5 1,0 1,5 2,0 C0 C0 C1 d b a C0 C6 Remelting
Precursor particle size
Melting temperature Glass area HfO 2 (mol %) 15 m 70 m 158 m Target Melting time C2 c C4 C0 C3
Top Middle Bottom
0,0 0,5 1,0 1,5 2,0 Glass area HfO 2 (mol %) 12h 3h Target
Top Middle Bottom
0,0 0,5 1,0 1,5 2,0 C5 3rd melting 2nd melting 1st melting Target HfO 2 (mol %) Glass area
Top Middle Bottom
0 2 4 6 8 HfO 2 (mol %) 1400°C 1250°C Target Glass area
Figure 4. SEM images of Hf-doped glasses melted in different conditions: effect of (a,b,c) particle size, (b,d)
melting time, (b,e) melting temperature, and (b,f) remelting. The name of observed glasses is given at the bottom right corner.
3.2 Solubility study
3.2.1 Hafnium solubility
The HfO2 solubility in the aluminosilicate glass was determined in oxidizing (Pt-Au crucible)
and reducing (C-SiC or Cg crucibles) conditions at 1250°C and 1400°C for A glasses and
only at 1400°C for B glasses, because below 1327°C, B melt starts to crystallize. Both conditional (SC) and saturation (SS) solubilities were measured and are indicated in Table 3.
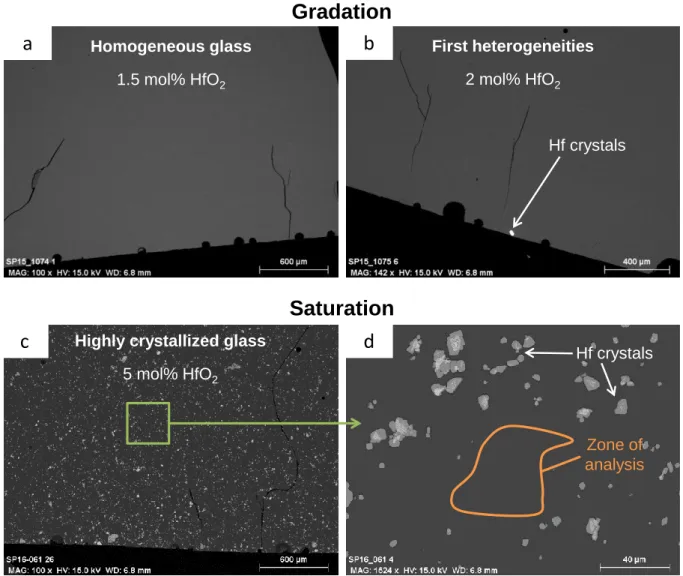
The SC is determined by progressively increasing the amount of added HfO2 in the glass until
the formation of Hf-bearing crystals (Figure 5a and b). The lower limit corresponds to the maximal quantity of Hf that could be incorporated in the homogeneous glass matrix. And the upper limit refers to the quantity of Hf where the first heterogeneities are observed. The SS is
characterized by HfO2 concentration measurements in a HfO2-saturated glass with Hf-bearing
crystals (Figure 5c and d). The main glasses compositions are shown in Table 4. Each Hf concentration value represents an average of several measurements (from 6 to 12 points of EDS analyses).
Figure 5. SEM images of Hf-doped A glasses, elaborated in Pt-Au crucible at 1250°C, containing (a) 1.5 mol%,
(b) 2 mol% and (c,d) 5 mol% HfO2, showing the two methods for the solubility measurements (gradation and saturation).
a
b
c
d
Hf crystals Hf crystals Zone of analysis Homogeneous glass 1.5 mol% HfO2 First heterogeneities 2 mol% HfO2Highly crystallized glass
5 mol% HfO2
Gradation
Table 3
Solubility limits of hafnium determined in A and B aluminosilicate glasses elaborated in oxidizing and reducing conditions at 1250°C and 1400°C.
Hf-doped
glasses Melting conditions Hafnium solubility limits
Glass series T (°C) Crucible Atmosphere Conditional solubility (HfO2 mol%) Saturation solubility (HfO2 mol%) A-series 1250 Pt-Au Air 1.5a < S c < 2 c 3 1250 C-SiC Air - Ar 2.5a < S c < 3 c / 1400 Pt-Au Air 5a < S c < 7 c 6 - 6.5 1400 C-SiC Air - Ar 3b < S c < 5 c 4.5 B-series 1400 Pt-Au Air 3a < S c < 4 c 5.5- 6 1400 C-SiC Air - Ar 3.5a < S c < 4 c 3.5 - 4 1400 Cg Air-Ar / 6 a Homogeneous glass b
Glass containing dendritic crystals
c
Glass containing crystals
The measured conditional solubility is either lower or close to the saturation solubility. The SS
limit is higher than the upper SC limit only for two Hf-bearing glasses: A and B glasses melted
in a Pt-Au crucible at 1250°C and 1400°C respectively. This suggests that the glass elaboration conditions were well-optimized to reach equilibrium for most glasses. However, the saturation solubility is independent of hafnium dissolution kinetics contrary to the conditional solubility. In the nuclear field, the conditional solubility has been used to compare actinides and surrogates [10, 12]. This solubility ensures that the glass sample is totally homogeneous for a given glass-making protocol but does not necessarily correspond to the maximum amount that can be incorporated in the glass. In the following, we will essentially consider the saturation solubility. Indeed, we can consider that saturation experiments provide us hafnium concentrations close to the equilibrium concentration, as no hafnium concentration gradient is observed. Only the A glass with 10 mol% HfO2 melted in C-SiC
crucible at 1250°C (AS8 sample) showed a concentration gradient, and consequently, the HfO2 saturation solubility limit was not determined for it.Furthermore, an excess of hafnium
above the saturation solubility should not significantly change the saturation concentration of HfO2.
The redox conditions (oxidizing or reducing conditions) do not affect the hafnium solubility. Saturation experiments in Cg and Pt-Au crucibles for the B-series show that BS4 and BS5
glasses exhibit the same saturation concentration about 5.5-6 mol% HfO2 at 1400°C.
The hafnium concentration of HfO2-saturated melts increases with the melting temperature,
from 3 mol% HfO2 at 1250°C to 6-6.5 mol% HfO2 at 1400°C for the As-series melted in a
Pt-Au crucible.
The hafnium solubility also depends on the glass composition. At 1400°C in oxidizing conditions, the Bs-serie glasses exhibit a solubility of 5.5-6 mol% and the As-series, a slightly higher of 6-6.5 mol% HfO2. Furthermore, glasses melted in C-SiC crucibles (AS7 and BS2
glasses) exhibit lower solubilities than glasses elaborated in Pt-Au or Cg crucibles (AS5, BS4
and BS5 glasses): 4.5 mol% HfO2 for A melts and 3.5-4 mol% HfO2 for B melts. This can be
explained by the use of C-SiC crucible that interacts with the glasses and modifies their compositions. Indeed, at high temperature, the mullite binder (3Al2O3-2SiO2) diffuses in the
glass as proven by the enrichment of Al2O3 and SiO2 in AS7 and BS2 samples (Table 4).
Table 4
Glass compositions (mol%) determined by microprobe (EDS) and crystalline phases observed for different elaboration conditions. The M* ratio is expressed as molar (CaO+Na2O)/(CaO+Na2O+Al2O3) ratio. The random standard uncertainty is calculated by multiplying the standard deviation of the mean and the student t-factor at the 95% level of confidence. Glass Name Starting glass Temperature (°C) Redox conditions Added HfO2, (mol%) SiO 2 (mol%) Al 2O3 (mol%) CaO (mol%) Na 2O (mol%) HfO 2 (mol%) Fe 2O3 (mol%) Crystalline phases M* AS1 A 1250 Pt-Au 1.5 57.30 +/- 0.10 6.30 +/- 0.03 13.91 +/- 0.05 20.82 +/- 0.08 1.66 +/- 0.05 0 None 0.85 AS2 A 1250 Pt-Au 4.0 57.54 +/- 0.30 6.34 +/- 0.07 13.78 +/- 0.09 19.25 +/- 0.24 3.09 +/-0.08 0 Na4Hf2(SiO4)3, HfO2 0.84 AS3 A 1250 C-SiC 2.5 62.44 +/- 0.49 7.72 +/- 0.12 13.41 +/- 0.49 13.90 +/- 0.39 2.53 +/- 0.07 0.31 +/- 0.03 None 0.78 AS4 A 1400 Pt-Au 5.0 55.60 +/- 0.12 6.02 +/- 0.04 13.20 +/- 0.06 20.01 +/- 0.08 5.17 +/- 0.09 0 None 0.85 AS5 A 1400 Pt-Au 7.0 55.19 +/- 0.09 6.13 +/- 0.03 13.28 +/- 0.12 19.36 +/- 0.16 6.04 +/- 0.07 0 Na4Hf2(SiO4)3, HfO2 0.84 AS6 A 1400 C-SiC 3.0 65.02 +/- 0.91 7.95 +/- 0.30 13.17 +/- 0.92 10.59 +/- 0.53 3.02 +/- 0.15 0.26 +/- 0.04 Dendrites 0.75 AS7 A 1400 C-SiC 7.0 65.77 +/- 0.17 8.60 +/- 0.09 11.98 +/- 0.46 8.93 +/- 0.17 4.52 +/- 0.08 0.21 +/- 0.17 HfO2 0.71 BS1 B 1400 C-SiC 3.5 61.16 +/- 0.24 7.50 +/- 0.05 28.27 +/- 0.22 0 3.07 +/- 0.07 0 None 0.79 BS2 B 1400 C-SiC 7.0 61.77 +/- 0.37 8.49 +/- 0.23 24.60 +/- 0.78 1.07 +/- 0.21 3.56 +/- 0.14 0.51 +/- 0.21 HfSiO4, HfO2 0.75 BS3 B 1400 Pt-Au 3.0 56.65 +/- 0.07 6.23 +/- 0.02 34.11 +/- 0.11 0 3.02 +/- 0.06 0 None 0.85 BS4 B 1400 Pt-Au 7.0 54.92 +/- 0.05 6.55 +/- 0.03 32.91 +/- 0.09 0 5.61 +/- 0.06 0 Ca2HfSi4O12, HfSiO4, 0.83
HfO2 BS5 B 1400 Cg 7.0 55.00 +/- 0.11 6.12 +/- 0.03 32.89 +/- 0.11 0 5.99 +/- 0.05 0 HfSiO4, HfO2 0.84 3.2.2 Hafnium crystallization
The mineralogy of the different crystals-bearing glasses above the HfO2 solubility limit
changes with the glass composition and the redox conditions (Table 4). For the A-series glasses elaborated in oxidizing conditions (1250°C or 1400°C), the main crystallized phase is hexagonal Na4Hf2(SiO3)4 as shown in Figure 6 and Figure 7b. The Rietveld refinement
attests that those crystals represent 79 wt% of the whole crystalline phases attended (Table 5). Monoclinic HfO2 crystals (21 wt%) are also identified by both XRD and SEM/EDS.
In the A-series melted in C-SiC crucible at 1400°C, the only Hf-bearing crystallized phase is HfO2. Some cristobalite (SiO2) is also detected (around 30 wt%). At lower temperature, the
other crystalline phase (40 wt%) seems to correspond to the triclinic parakeldyshite Na2ZrSi2O7 phase [26]. Because of the possible cross-substitution of Zr and Hf, the formula
of the observed crystalline phase in Figure 7a might correspond to Na2HfSi2O7. This
stoichiometry is confirmed by EDS analysis of the crystal (Table 6). Na migration under electron beam may explain the slight drop between the analysis and the pure phase stoichiometry. EDS analysis also suggests that a substitution of Na2O by CaO is also likely to
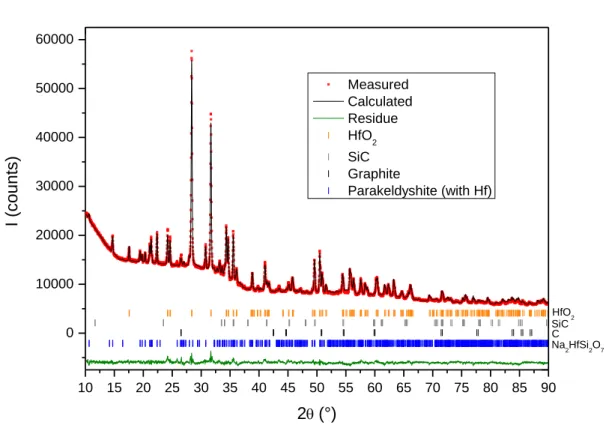
occur in that crystal. Since no XRD pattern of Na2HfSi2O7 is referenced in the literature to our
knowledge, we have first considered the same space group for Na2Hf2SiO7 than for
parakeldyshite. The atomic positions of parakeldyshite were used with a complete substitution of Zr by Hf. The Rietveld refinement of the XRD pattern is consistent with this result, as shown by the χ2 equal to 4.9 (Figure 8). The cell parameters of the Na2HfSi2O7
crystalline phase are extracted from the refinement and given in Table 7. In order to validate the refinement, the sodium hafnium disilicate Na2HfSi2O7 was synthetized and its structure
was refined. The triclinic space group was confirmed and the atomic positions were determined [27].
For the B-series glasses (Na-free) elaborated in oxidizing conditions, monoclinic Ca2HfSi4O12, tetragonal HfSiO4 and HfO2 crystals are observed by SEM (Figure 7d) and
detected by XRD (Figure 6). The main phase is Ca2HfSi4O12 (89 wt%) and other phases are
HfO2 (6wt%) and HfSiO4 (5wt%). In reducing conditions, the crystallized phases are HfSiO4
and HfO2 according to XRD results (Figure 6). For glasses melted in C-SiC crucibles, HfO2
crystals are not detected by XRD (certainly below the device detection limit) but some tiny ones (few hundred of nanometers) are shown up in SEM images (Figure 7c). However, XRD patterns often show the presence of graphite carbon and silicon carbide. These impurities come from the reaction between glass and C-SiC crucible at the glass/crucible interface. A thin layer belonging to the C-SiC crucible was systematically observed on the sample surface after heating. So a variable part of this layer could be introduced in the sample during the XRD preparation. The C and SiC content are not taken into account in the crystalline phase percentage calculation.
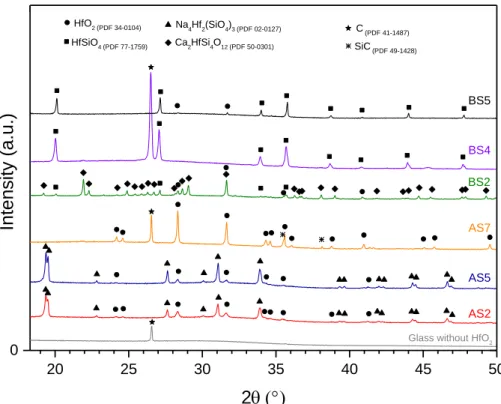
Figure 6. XRD patterns of Hf-doped glasses elaborated in oxidizing and reducing conditions at 1250°C or
1400°C. The glass sample without adding HfO2 was melted in C-SiC crucible at 1400°C for 3h. Note that the enlarge part of patterns between 2θ = 18-50° is shown to get better insight of the diffraction peaks due to the crystallization. 20 25 30 35 40 45 50 0 SiC(PDF 49-1428) C(PDF 41-1487) Ca 2HfSi4O12 (PDF 50-0301) Na 4Hf2(SiO4)3 (PDF 02-0127) HfSiO 4 (PDF 77-1759)
Glass without HfO2
BS5 BS4 BS2 AS7 AS5 AS2
Int
en
sity (a
.u.
)
2
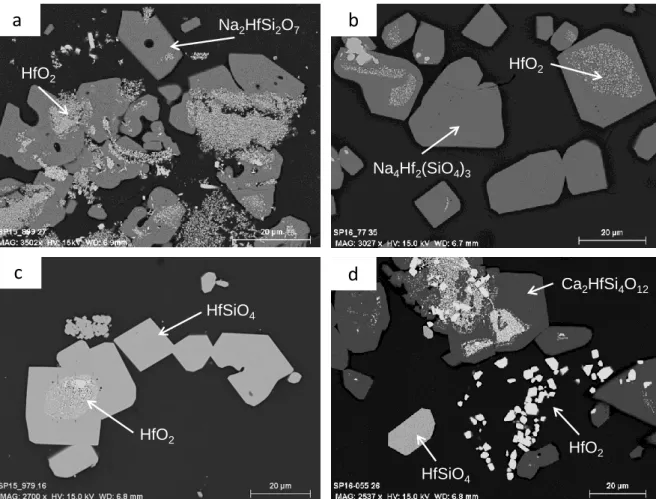
HfO 2 (PDF 34-0104)Figure 7. SEM images of crystals in HfO2-saturated glasses from A starting glass (a) at 1250°C in C-SiC crucible, (b) at 1250°C or 1400°C in Pt-Au crucible and from B starting glass at 1400°C (c) in C-SiC or C crucibles, (d) in Pt-Au crucible.
Table 5
Relative percentage in mass of some crystals in glass, data obtained after the Rietveld refinement of crystallized glass samples. Error for each crystal is ± 2 wt%.
Glass
Crystal mass fraction (wt%)
χ2* Ca
2HfSi4O12 Na4Hf2Si3O13 Na2HfSi2O7 HfSiO4 HfO2 SiO2
AS2 - 79 % - - 21 % - 3.5 AS5 - 93 % - - 7 % - 4.2 AS8 - - 40 % - 60 % - 4.9 AS7 - - - - 70 % 30 % 2.5 BS4 89 % - - 5 % 6 % - 5.2 BS2 - - - 100 % - - 6.4
c
HfSiO4 HfO2a
HfO2 Na2HfSi2O7b
Na4Hf2(SiO4)3 HfO2d
HfO2 Ca2HfSi4O12 HfSiO4* Reduced chi square is an indicator of the fit goodness as determined in [21].
Table 6
Composition of the observed Na2HfSi2O7 crystalline phase determined by microprobe (EDS) in the studied sample (AS8) and compared to the stoichiometric one.
Chemical elements O (at%) Si (at%) Na (at%) Hf (at%) Ca (at%) Theoretical formula of Na 2HfSi2O7 58.3 16.7 16.7 8.3 0
Measured composition of the Na
2HfSi2O7crystal 60.1 17.6 11.6 8.4 2.4
Figure 8. Rietveld refinement of XRD pattern containing the detected Na2HfSi2O7 crystalline phase in the A glass
with 10 mol% HfO2 melted in C-SiC at 1250°C (AS8).
10 15 20 25 30 35 40 45 50 55 60 65 70 75 80 85 90 0 10000 20000 30000 40000 50000 60000 Na2HfSi2O7 C SiC I (co u n ts) 2(°) Measured Calculated Residue HfO2 SiC Graphite Parakeldyshite (with Hf) HfO2
Table 7
Cell parameters (a, b, c, α, β, γ and cell volumes) of the Na2HfSi2O7 crystals present in the studied sample, extracted from the whole pattern decomposition, and of the triclinic Na2ZrSi2O7 crystals.
Crystalline phase a (Å) b (Å) c (Å) α (°) β (°) γ (°) V (Å 3 ) Ref Na 2HfSi2O7 6.6232 +/- 0.0060 8.7881 +/- 0.0075 5.4046 +/- 0.0047 92.25 +/-0.09 93.88 +/- 0.07 71.10 +/- 0.06 296.89 +/- 0.45 This study Na 2ZrSi2O7 6.6364 8.8120 5.4233 92.69 94.20 71.36 299.6 [26]
Hf-bearing crystals display different forms (Figure 7). HfO2 gets two types of crystal sizes,
several hundred nanometers and several microns. Micrometric crystals are located in the glass and have an isometric shape while nanometric HfO2 are often observed inside the Hf
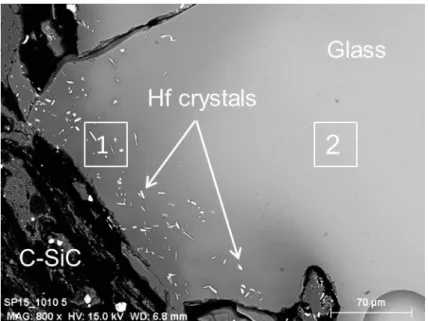
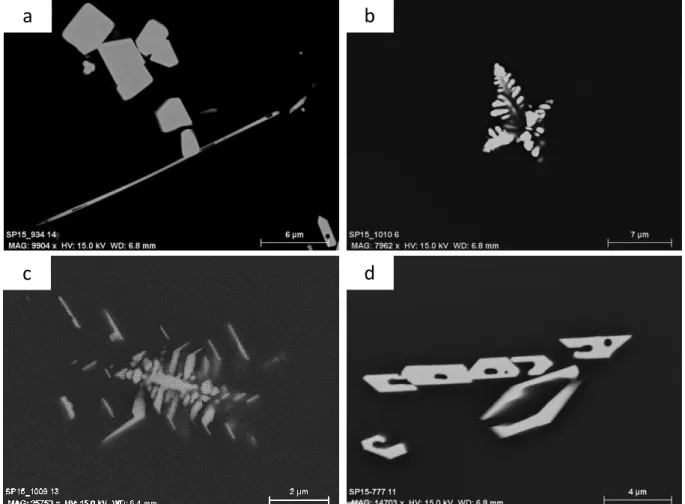
silicate crystals. These silicate crystals have an isometric shape and range in size from 10 μm to 50 μm. Other crystal morphologies are also observed in the A-series fused in C-SiC at 1400°C (Figure 9). These hafnium crystals are located at the interface between the glass and the crucible and display several forms such as needle (Figure 10a), dendrite (Figure 10b and c) and crown (Figure 10d) shapes. Surrounding these crystals, a depletion of HfO2 and CaO
and an enrichment of other oxides (SiO2 and Al2O3) are noticed (Table 8). Those crystals are
not observed using Pt-Au crucibles.
Figure 9. SEM image of the interface between the C-SiC crucible and the glass in the AS6 sample, showing (1)
Table 8
Glass compositions of two areas; (1) close to the interface between the C-SiC crucible and the glass and (2) far from this interface; determined by microprobe (EDS) in the AS6 sample.
Point of analysis SiO 2 (mol%) Al 2O3 (mol%) CaO (mol%) Na 2O (mol%) HfO 2 (mol%) Fe 2O3 (mol%) 1 77.63 9.44 2.71 7.81 2.30 0.11 2 67.85 8.42 10.75 8.39 4.31 0.29
Figure 10. SEM images of Hf-bearing crystals observed in Hf-doped A glasses melted in C-SiC crucible at
1400°C with several morphologies (a) needle shaped, (b,c) dendritic shaped and (d) crown shaped .
4
Discussion
4.1 Hafnium incorporation
Hafnium sedimentation may be explained by the huge density difference between HfO2
precursor and the glass. Measured glass densities are respectively, 2.59 g.cm-3 and 2.68 g.cm-3 for A and C glasses in contrast to 9.68 g.cm-3 for HfO2. Experimental measurements
indicate that A and C melt viscosities are below 200 dPa.s at 1250°C and close to 50 dPa.s at 1400°C (Figure 11). Hafnium addition in the glass network increases slightly the melt
a
d
c
viscosity but not enough to avoid HfO2 sedimentation. In a laminar flow, the sedimentation
velocity (m.s-1) of spherical particles in a melt can be described by the Stokes’ law:
(1)
with r, the particle radius (m)
g, the standard acceleration (m.s-2)
ρ, the density (kg.cm-3)
η, the fluid viscosity (Pa.s)
Considering these hypotheses (laminar flow and spherical particles) and equation (1), 158 μm diameter HfO2 particles in A melt fall in about 15 min from the top to the bottom of the
glass sample (around 6 mm) at 1250°C and more rapidly in 5 min at 1400°C. HfO2
sedimentation is accelerated at 1400°C, while hafnium diffusion into the glass melt is enhanced. Equation (1) also shows that decreasing HfO2 particle size drastically slows down
the sedimentation velocity. At 1250°C, 70 μm diameter HfO2 particles fall in 75 min and 15
μm diameter HfO2 particles in more than one day. This effect has to be coupled with the
increase in Hf precursors dissolution kinetics for smaller initial particle sizes [28], both leading to a better HfO2 incorporation.
When equilibrium is not established, HfO2 sedimentation widely limits its incorporation into
the glass matrix. At the bottom of the crucible, the glass melt surrounding crystals is supersaturated in hafnium which largely slows down HfO2 crystals dissolution into the whole
glass sample. Furthermore, increasing duration could make the sedimentation layer denser [6] and thus makes it harder to dissolve crystals. In that case, crystallization is due to the presence of undissolved particles, relicts of hafnium oxide particles introduced into the initial powder mixture or to new formed crystals.
Figure 11. Steady state viscosity of glass melts for different compositions as a function of the temperature. The
dash lines represent the VFT model and the symbols are the measured data. Note that all glasses are totally homogeneous within the measuring range.
1200 1250 1300 1350 1400 1450 1500 0 50 100 150 200 Glass B Glass C Glass A Viscosity (d Pa.s) Temperature (°C)
4.2 Hafnium solubility
Our hafnium solubility results may now be compared to other studies. In this work, we show that the redox conditions do not affect the HfO2 solubility which is consistent with the fact that
Hf displays only one oxidation state in the glass, namely HfIV. Therefore the HfO2
solubilization mechanism must be the same for reduced or oxidized glass melts.
A higher melting temperature improves the HfO2 solubility limits as commonly observed by
authors [10, 20, 24]. Since the oxidation state is fixed (HfIV), the enhancing of the solubility is only controlled by the temperature.
The interpretation of the HfO2 solubility in aluminosilicate glass as a function of the glass
composition is based on previous studies. For peralkaline glass, Davis [8] has demonstrated that the hafnium solubility is strongly and positively related to the excess of alkalis which are not used for charge compensation. We can define the following M* ratio (with the oxide content in mol%):
(2)
where M’ and M’’ are respectively metal divalent and monovalent cations. According to Davis, for peralkaline glasses (M* ≥ 0.5), the hafnium solubility increases with M*. Applied to our case M* is written:
(3)
All our glass samples have M* > 0.5 (Table 4) and belong to the peralkaline field. Glass samples melted in C-SiC crucibles present a lower M* (0.71 and 0.74 for AS7 and BS2 samples) than glasses fused in other crucibles (0.84 and 0.83 for AS5, BS4 and BS5 samples). For AS7 glass sample, the lessening of M* is accentuated by Na volatilization. A decrease in HfO2 solubility is observed as M* decreases (Table 3). Indeed, for AS7 and BS2
glasses, the melt compositions are enriched in Al2O3 and SiO2 because of the mullite binder
from the crucible, hence show a lower excess of alkalis or alkaline earths. Nevertheless, a slight solubility difference is observed between AS5 and BS4 glasses although their respective M* are comparable. Therefore, it seems that the nature of cations may play a small role. Some authors [14, 15] have shown that, in peralkaline melts, the increase of the M’O/M’’2O ratio smoothly enhances the solubilities of +4 cations (for instance, Ti and Zr).
Thus, the substitution of Na2O by CaO should slightly decrease the hafnium solubility as
observed. When M* is higher than 0.5, these cations act both as network modifiers and charge compensators in the aluminosilcate network. Classically, Ca2+ serves as a charge balancing for two AlO4 tetrahedrons or two non-bridging oxygens and Na+ charge balancing
for one AlO4 tetrahedron or one non-bridging oxygen. Ca might cause a steric hindrance
more significant than Na. This assumption to explain the low HfO2 solubility difference
between AS5 and BS4 melts needs further experiments to confirm it.
Figure 12 presents our results compared to previous studies, with the HfO2 solubility plotted
as a function of the M* ratio. The HfO2 solubility is higher in peralkaline glasses than in
peraluminous ones and borosilicate glasses tend to exhibit higher hafnium solubilities than aluminosilicate glasses. For the borosilicate glasses, the melting temperature is 50°C higher than in aluminosilicate glasses. Boron appears to improve the HfO2 solubility but its role still
Figure 12. Comparison of hafnium solubility in A and B glasses to hafnium solubility in several types of glasses
from the literature. HfO2 concentration in mole percent is plotted as the function of the M* ratio (CaO+Na2O)/(CaO+Na2O+Al2O3) in molar content.
4.3 Hafnium crystallization
The morphology of hafnium silicate crystals suggests that these crystals are quickly formed and quite stable in the melt. The HfO2 crystals seem to grow following an Oswald ripening
process [29, 30]. Nanometric HfO2 are not observed in the melt but as inclusions in the
hafnium silicate crystals indicating that they might have been poikilitically enclosed in the silicates before their growth.
Dendritic or needle crystals could be quench crystals [31]. As the temperature decreases during quenching, the glass melt becomes supersaturated with hafnium leading to a quick overgrowth of hafnium crystal along one or two preferential axes. However, those crystals are concentrated at the glass/crucible interface which is not logical for quench crystals. These crystals should also be observed in the core of the glass sample where the cooling rate is ordinarily the lowest. Moreover, the crown-shaped crystals do not really look like quench crystals. All this suggests that these crystals result from a reaction between the glass and the C-SiC crucible. The mullite binder might react with the glass melt in this area as shown by the glass enrichment in Al2O3 and SiO2 and depletion in other elements (CaO and
HfO2). All these crystallization mechanisms are not fully understood in this work and need to
be deepened.
The Na2HfSi2O7 crystalline phase has been detected for the first time. The existence of this
phase is confirmed by its synthesis and its crystal structure determination. The Rietveld refinement of the XRD pattern containing this crystalline phase allows us to quantify it. The isomorphic character between the Na2HfSi2O7 and the parakeldyshite Na2ZrSi2O7 can be
explained by close ionic radii for Hf and Zr for the same coordination number [32]. All detail
0,5 0,6 0,7 0,8 0,9 1,0 0 2 4 6 8 10 12 14 16 18 1400°C 1250°C 1450°C AS2 [8] [8]
SiO2-Al2O3-Na2O-K2O
SiO2-B2O3-Al2O3-Na2O
Complex Borosilicate glass
B2O3-Na2O
SiO2-Na2O
SiO2-Al2O3-CaO
SiO2-Al2O3-Na2O
HfO
2
(mo
l%
)
(Na
2O+CaO)/(Na
2O+CaO+Al
2O
3)
BS2 BS4 AS5 [17] [10] [20] AS7 [8] [8,19] [8] [8,19] [8] [18]
about the structure of Na2HfSi2O7 are currently submitted and reviewed for a formal data
deposition into XRD databases.
5
Conclusion
In this study, an experimental protocol has been developed in order to measure the hafnium solubility in aluminosilicate glass melted in both oxidizing and reducing conditions. Hf-doped glass elaboration conditions have been optimized to limit the HfO2 sedimentation and to
approach equilibrium. Contrary to the conditional solubility, the saturation solubility readily allows to determine a thermodynamic solubility. As hafnium speciation remains the same in the glass matrix (HfIV), its solubility is not affected by the redox conditions. In peralkaline glasses (with molar content (Na2O+CaO)>Al2O3), the HfO2 solubility limit is positively
correlated with the melting temperature and the excess of network modifier cation (Na2O and
CaO) relatively to Al2O3. The hafnium solubility also seems to be slightly impacted by the
nature of these cations. These results are in agreement with previous studies of +4 cations in borosilicate or aluminosilicate glasses. The hafnium solubility appears to be higher in borosilicate glasses than in aluminosilicate glasses for a similar excess of alkalis or alkaline earths.
Above the hafnium solubility limit, formations of HfO2, HfSiO4, Ca2HfSi4O12, Na4Hf2(SiO4)3
and Na2HfSi2O7 crystals have been observed in those glasses. The glass composition and
potentially the redox conditions change the nature of the Hf-bearing crystals. The existence of the Na2HfSi2O7 crystalline phase has been evidenced in Na-rich aluminosilicate melts and
for temperatures close to 1250°C. The Rietveld refinement of Na2HfSi2O7 has been
successfully performed. The Na2HfSi2O7 phase structure appears to be very similar than the
parakeldyshite Na2ZrSi2O7 phase structure.
The optimization of Hf-doped glass elaboration conditions will be further used for the preparation of U-doped glasses. Indeed, the uranium incorporation in the glass melt faces to the same sedimentation issues [6]. Besides, UO2 solubility is also likely to be related to the
excess of alkalis [4]. The uranium behavior however remains more complex than the hafnium one. The chemistry of uranium in glass melt is ruled by the equilibria of UVI-UV-UIV [7]. The UO2 solubility in glass melt as the function of the oxygen fugacity (fO2) is the subject of
ongoing studies and those data will be compared to the HfO2 solubility.
Acknowlegdments
The authors gratefully acknowledge B. Pénélon for performing viscosity measurements. This work was financially supported by CEA, AREVA and ANDRA.
References
[1] M. Cable, Kinetics of volatilization of sodium borate melts, in: L.D. Pye, V.D. Fréchette, N.J. Kreidl (Eds.) Borate Glasses: Structure, Properties, Applications, Springer US, Boston, MA, 1978, pp. 399-411.
[2] J.N. Cachia, X. Deschanels, C. Den Auwer, O. Pinet, J. Phalippou, C. Hennig, A. Scheinost, Enhancing cerium and plutonium solubility by reduction in borosilicate glass, J. Nucl. Mater., 352 (2006) 182-189.
[3] H.D. Schreiber, G.B. Balazs, The chemistry of uranium in borosilicate glasses .1. Simple base compositions relevant to the immobilization of nuclear waste, Phys. Chem. Glasses, 23 (1982) 139-146.
[4] F. Domine, B. Velde, Preliminary investigation of the processes governing the solubility of uranium in silicate melts, Bulletin De Mineralogie, 108 (1985) 755-765.
[5] D.J. Lam, B.W. Veal, A.P. Paulikas, X-ray photoemission spectroscopy (xps) study of uranium, neptunium, and plutonium oxides in silicate-based glasses, Acs Symposium Series, 216 (1983) 145-154.
[6] Y.I. Matyunin, S.V. Yudintsev, Immobilization of U3O8 in borosilicate glass in an induction melter with a cold crucible, Atom. Energy, 84 (1998) 173-178.
[7] H.D. Schreiber, The chemistry of uranium in glass-forming aluminosilicate melts, Journal of the Less-Common Metals, 91 (1983) 129-147.
[8] L.L. Davis, J.G. Darab, M. Qian, D. Zhao, C.S. Palenik, H. Li, D.M. Strachan, L. Li, Hafnium in peralkaline and peraluminous boro-aluminosilicate glass and glass sub-components: a solubility study, J. Non-Cryst. Solids, 328 (2003) 102-122.
[9] K.M. Fox, J.C. Marra, T.B. Edwards, E.N. Hoffman, C.L. Crawford, Plutonium feed impurity testing in lanthanide borosilicate (LaBS) glass, in: W.E. Lee, J.W. Roberts, N.C. Hyatt, R.W. Grimes (Eds.) Scientific Basis for Nuclear Waste Management Xxxi, Materials Research Society, Warrendale, 2008, pp. 397-404.
[10] C. Lopez, X. Deschanels, J.M. Bart, J.M. Boubals, C. Den Auwer, E. Simoni, Solubility of actinide surrogates in nuclear glasses, J. Nucl. Mater., 312 (2003) 76-80.
[11] Y.H. Zhang, A. Navrotsky, H. Li, L.Y. Li, L.L. Davis, D.M. Strachan, Energetics of dissolution of Gd2O3 and HfO2 in sodium alumino-borosilicate glasses, J. Non-Cryst. Solids, 296 (2001) 93-101.
[12] X. Deschanels, S. Peuget, J.N. Cachia, T. Charpentier, Plutonium solubility and self-irradiation effects in borosilicate glass, Prog. Nucl. Energy, 49 (2007) 623-634.
[13] H. Khedim, R. Podor, P.J. Panteix, C. Rapin, M. Vilasi, Solubility of chromium oxide in binary soda-silicate melts, J. Non-Cryst. Solids, 356 (2010) 2734-2741.
[14] E.B. Watson, Zircon saturation in felsic liquids - experimental results and applications to trace-element geochemistry, Contrib. Mineral. Petrol., 70 (1979) 407-419.
[15] M.P. Dickenson, P.C. Hess, Redox equilibria and the structural role of iron in alumino-silicate melts, Contrib. Mineral. Petrol., 78 (1981) 352-357.
[16] H. Khedim, S. Abdelouhab, R. Podor, C. Rapin, M. Vilasi, P.J. Panteix, M. Toplis, F. Faure, Kinetic and equilibrium factors affecting saturation of chromium oxide in soda-silicate melts, J. Non-Cryst. Solids, 357 (2011) 31-42.
[17] J.N. Cachia, Solubilité d'éléments aux degrés d'oxydation III et IV dans les verres de borosilicate, in, PhD thesis, Université de Monpellier II, 2005, pp. 239.
[18] M.A. Res, J. Bednarik, S. Hart, H. Schonberger, Transformation of Na2O-HfO2-B2O3 glass into a material having interconnected pores, J. Mater. Sci., 21 (1986) 2169-2174.
[19] X. Feng, H. Li, L.L. Davis, L. Li, J.G. Darab, M.J. Schweiger, J.D. Vienna, B.C. Bunker, P.G. Allen, J.J. Bucher, Distribution and solubility of radionuclides in waste forms for disposition of plutonium and spent nuclear fuels: Preliminary results, CERAMIC TRANSACTIONS, 93 (1999) 409-420.
[20] A.J. Ellison, P.C. Hess, Solution behavior of +4 cations in high silica melts - petrologic and geochemical implications, Contrib. Mineral. Petrol., 94 (1986) 343-351.
[21] C. Frontera, J. Rodriguez-Carvajal, FULLPROF as a new tool for flipping ratio analysis, Physica B, 335 (2003) 219-222.
[22] J. Puig, C. Hanotin, M. Neyret, P. Marchal, High temperature rheological study of borosilicate glasses containing platinum group metal particles by means of a mixer-type rheometer, J. Nucl. Mater., 469 (2016) 112-119.
[23] M.I. Ojovan, Viscosity and glass transition in amorphous oxides, Adv. Condens. Matter Phys., (2008) 23. [24] J.D. Vienna, D.L. Alexander, H. Li, M.J. Schweiger, D.K. Peeler, P.N.N. Laboratory, U.S.D.o. Energy, Plutonium Dioxide Dissolution in Glass, Pacific Northwest National Laboratory, 1996.
[25] L.S. Walter, Giutroni.Je, Vapor fractionation of silicate melts at high temperatures and atmospheric pressures, Sol. Energy, 11 (1967) 163-169.
[26] P. Ferreira, A. Ferreira, J. Rocha, M.R. Soares, Synthesis and structural characterization of zirconium silicates, Chem. Mat., 13 (2001) 355-363.
[27] N. Massoni, P. Chevreux, Crystal structure of Na2HfSi2O7, Acta Crystallographica, Section D.
[28] C. Lopez, Solubilité des actinides et de leurs simulants dans les verres nucléaires : limites d'incorporation et compréhension des mécanismes, in, PhD thesis, Université de Paris XI,Orsay, 2003, pp. 239.
[29] P.W. Voorhees, The theory of Ostwald ripening, Journal of Statistical Physics, 38 (1985) 231-252.
[30] J.H. Yao, K.R. Elder, H. Guo, M. Grant, Theory and simulation of Ostwald ripening, Phys. Rev. B, 47 (1993) 14110-14125.
[31] Y. Chen, Y.X. Zhang, Olivine dissolution in basaltic melt, Geochimica Et Cosmochimica Acta, 72 (2008) 4756-4777.
[32] R.D. Shannon, Revised effective ionic radii and systematic studies of interatomic distances in halides and chalcogenides, Acta Crystallogr. A, Cryst. Phys. Diffr. Theor. Gen. Crystallogr., A32 (1976) 751-767.