HAL Id: hal-00317101
https://hal.archives-ouvertes.fr/hal-00317101
Submitted on 1 Jan 2003
HAL is a multi-disciplinary open access
archive for the deposit and dissemination of
sci-entific research documents, whether they are
pub-lished or not. The documents may come from
teaching and research institutions in France or
abroad, or from public or private research centers.
L’archive ouverte pluridisciplinaire HAL, est
destinée au dépôt et à la diffusion de documents
scientifiques de niveau recherche, publiés ou non,
émanant des établissements d’enseignement et de
recherche français ou étrangers, des laboratoires
publics ou privés.
From the Sun’s south to the north pole ? Ulysses
COSPIN/LET composition measurements at solar
maximum
M. Y. Hofer, R. G. Marsden, T. R. Sanderson, C. Tranquille
To cite this version:
M. Y. Hofer, R. G. Marsden, T. R. Sanderson, C. Tranquille. From the Sun’s south to the north
pole ? Ulysses COSPIN/LET composition measurements at solar maximum. Annales Geophysicae,
European Geosciences Union, 2003, 21 (6), pp.1383-1391. �hal-00317101�
Annales
Geophysicae
From the Sun’s south to the north pole – Ulysses COSPIN/LET
composition measurements at solar maximum
M. Y. Hofer, R. G. Marsden, T. R. Sanderson, and C. Tranquille
Research and Scientific Support Dept. of ESA, ESTEC, Keplerlaan 1, 2201 AZ Noordwijk, The Netherlands Received: 23 December 2002 – Revised: 15 April 2003 – Accepted: 17 April 2003
Abstract. Based on elemental abundance ratios derived
from the Ulysses COSPIN/LET measurements, we classi-fied the energetic particle populations during and after the so-called Fast Latitude Scan – the time period during which the Ulysses spacecraft traveled from the highest helio-latitude south to maximum northern latitude, i.e. 27 November 2000 to 13 October 2001 – as being mixed between solar ener-getic particles (major component) and particles accelerated at stream interaction regions.
During the fast latitude scan, the Ulysses spacecraft made the first transit in helio-latitude from pole to pole during so-lar activity maximum conditions, providing a unique oppor-tunity to acquire energetic particle composition data over a maximum range of helio-latitudes in the inner heliosphere. At low latitudes, based on our elemental abundance analy-sis, we found that while solar energetic particles dominated, there were indications for particle acceleration at single com-pression regions in a few instances.
In the high helio-latitude range the observed elemental particle compositions are mainly of the solar energetic par-ticle type. Within the statistical errors, the observed abun-dance ratios were independent of latitude, and were charac-teristic of solar energetic particles. These observations raise an important question for the theories of particle propagation in the inner heliosphere. The daily elemental abundance ra-tios of S/O, Mg/O and Si/O shown here are the first measured ratios at high helio-latitudes in the energy range from 13.0 to 30.0 MeV/n.
Key words. Interplanetary physics (energetic particles;
in-terplanetary shocks) – Solar physics, astrophysics and as-tronomy (flares and mass ejections)
Correspondence to: M. Y. Hofer (mirjam.hofer@issi.unibe.ch)
1 Introduction
Recently, the Ulysses spacecraft made the first transit in helio-latitude from pole to pole during solar activity maxi-mum conditions. This provided a unique opportunity to ac-quire energetic particle data over this wide range of helio-latitudes. In November 2000, the Ulysses spacecraft reached its highest southern heliographic latitude during the solar maximum mission (80.2◦), at a heliocentric radial distance of
≈2.27 AU. From 27 November 2000 (DOY 332) to 13 Octo-ber 2001 (DOY 286), the spacecraft traveled from the highest southern helio-latitude to the highest northern helio-latitude during the so-called Fast Latitude Scan (FLS). After the FLS, Ulysses started its second journey from the northern solar pole to aphelion at the heliocentric distance of the Jupiter or-bit. The spacecraft will reach aphelion in June 2004.
In earlier studies using energetic particle data from the solar polar passes (e.g. Hofer et al., 2001, 2002a; Mars-den et al., 2001), we showed that the data from the high-latitude observations reflected the generally high level of so-lar activity present during that period. We found evidence that the observed particle populations from the southern and northern polar passages comprised predominantly solar en-ergetic particles (SEPs) accelerated in association with coro-nal mass ejections (CMEs), rather than particles related to stream interaction regions (SIRs) (Gosling et al., 2001) or even the recurrent structure called corotating interaction re-gions (CIRs) (Hofer et al., 2002a). Tranquille et al. (2003) identified periods of enhanced helium isotopic abundance ra-tios, i.e. 3He/4He up to 48◦ helio-latitude in 2002. Both findings open the question about the propagation of energetic particles to high helio-latitudes, as also addressed in McK-ibben et al. (2001) and Dalla et al. (2003).
In this analysis, the daily averaged elemental abundance ratios based on Ulysses COSPIN/LET measurements from the end of 2000 to about mid 2002 are derived. The large lat-itudinal variation of the elemental composition values aver-aged during 11 selected events are investigated. With respect to the preliminary analysis of Hofer et al. (2003), the time
in-1384 M. Y. Hofer et al.: Composition measurements by Ulysses COSPIN/LET
Heliocentric Distance [AU]
0
1
2
3
4
5
6
Heliog
raph
ic
L
atitud
e
[
o]
-90 -60 -30 0 30 60 90 1 2 3 6 9 11 4 5 7 8 10 2000 2001Fig. 1. The orbit of the spacecraft Ulysses. The second fast latitude
scan from south to north during the solar maximum mission lasts from November 2000 to October 2001 (events 1–6). The circles represent the averaged helio-latitude and heliocentric distance of the spacecraft during the eleven selected time intervals.
terval was enlarged, elements with higher Z and observations in higher energy ranges were added.
First, the intensity profiles for the most abundant species, i.e. proton and helium, are presented and discussed. The proton/alpha ratio is used to identify time intervals that are likely to be influenced by SIRs.
Second, the abundance ratios of the heavier elements with a wide range in Z from He/O up to Fe/O from about 4 MeV/n to 30 MeV/n are derived and compared with reference values. Third, the elemental abundance ratios are averaged for each of the eleven selected time intervals and compared with the reference values of SEP and CIR/SIR populations (Ma-son and Sander(Ma-son, 1999).
Finally, the changes of the averaged composition measure-ments are discussed with respect to possible changes due to latitudinal effects or the level of solar activity.
2 Ulysses COSPIN/LET instrument and data
The low energy particle data used in this study are recorded by the Low Energy Telescope (LET), one of five tele-scopes of the Cosmic Ray and Solar Particle Investigation (COSPIN) instrument (Simpson et al., 1992), on board the Ulysses spacecraft. Ulysses is the first (and so far the only) mission to explore the out-of-ecliptic regions of the helio-sphere up to high helio-latitudes. The spacecraft was laun-ched in October 1990. The mission to date, therefore, covers a period of more than 12 years, providing the opportunity to
follow the Sun’s 11-year activity cycle, and part of the 22-year magnetic cycle.
The COSPIN/LET instrument records the flux and the composition of solar energetic particles and of low en-ergy cosmic ray nuclei from hydrogen up to iron over a range of energies from ≈1 to ≈50 MeV/n, using four level-element solid state detectors surrounded by an anti-coincidence shield. The measurements are made based on the double dE/dX vs. E technique (e.g. Marsden et al., 1984; Simpson et al., 1992).
The times of the shock occurrences at Ulysses were de-rived by R. J. Forsyth based on solar wind and magnetic field data.
In Fig. 1, the Ulysses orbit in a heliolatitude-heliocentric distance diagram is shown. The locations of the spacecraft averaged during each of the 11 selected time intervals are presented by labeled circles. The events 1 to 6 belong to the so-called FLS. The events 1–9 take place in 2001 and the events 10 and 11 in 2002.
3 Composition analysis
The elemental particle composition can be used to identify the type of a given energetic particle population (Hofer et al., 2002c): SEP or SIR/CIR populations. Solar energetic par-ticle and stream interaction regions have two different time scales. Large solar energetic particle events at 1.6 AU in the selected energy range last about 15 days (Hofer et al., 2002b), whereas CIR or SIR are known to be present for up to ≈3 days, only.
The proton-to-alpha flux ratios (energies around 1 MeV/n) help to identify SIR dominated time intervals. Sudden de-creases in the proton to alpha ratio from ≈80 to ≈10 followed by a more gradual decrease are indicative of the presence of an SIR. The corresponding energetic particles are usually accelerated at the reverse shock associated with SIRs (e.g. Marsden et al., 1993; Lario et al., 2001, 2003; Hofer et al., 2002c).
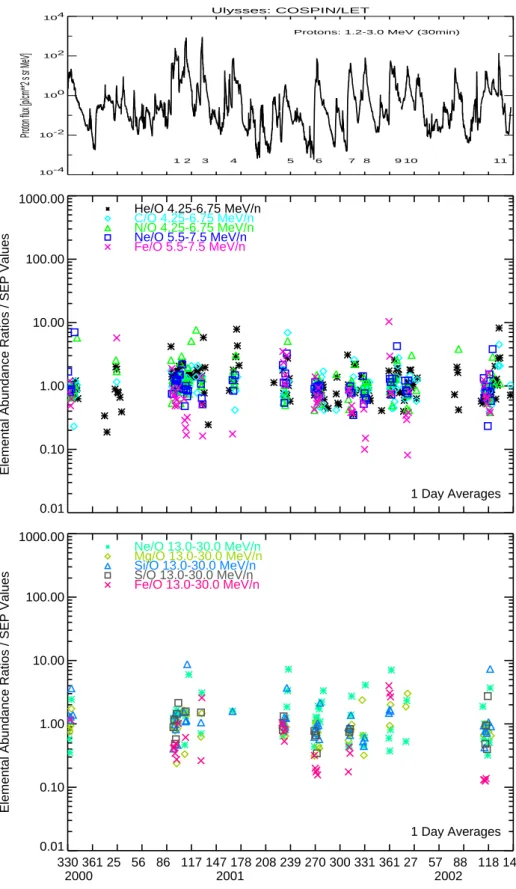
In Fig. 2, the proton/alpha flux ratios and the 30 minutes averaged alpha flux (1.0–5.0 MeV/n) are shown from DOY 330 in 2000 to DOY 149 in 2002. The alpha flux profile is scaled for reasons of clarity by a factor of 0.05. The arrows at the bottom of the figure mark the times of the shock occur-rences at Ulysses. The numbers indicate the 11 selected time intervals.
The highly variable flux profiles and the changes in the proton/alpha ratios reflect the high solar activity during the entire time interval. From DOY 56 to about DOY 178 in 2001 (including the intervals 1, 2, 3 and 4) large, short-term decreases are observed. Three of them are accompanied by almost simultaneous, large peaks in the alpha flux profile and an enhanced number of shock occurrences. This period has a high potential to contain at least one SIR. Before and mainly after this period, the amplitudes of large decreases in the pro-ton/alpha ratios are smaller and the signal looks more noisy, i.e. high frequency variability dominates.
Ulysses: COSPIN/LET 330 361 25 56 86 117 147 178 208 239 270 300 331 361 27 57 88 118 149 2000 2001 2002 10-6 10-4 10-2 100 102
Intensity [particle/cm2 s sr MeV]
Proton/Alpha: (ca. 1 MeV/n)
Alpha: 1.0-5.0 MeV/n (x 0.05)
1 2 3 4 5 6 7 8 9 10 11
Fig. 2. The 30-min proton (1.2– 3.0 MeV)/alpha(1.0–5.0 MeV/n) and the alpha intensity profiles from DOY 330 in 2000 to DOY 149 in 2002 are represented by solid lines. The ar-rows at the bottom of the panel mark the times of the shock occurrences at Ulysses.
The elemental abundances of heavier elements with re-spect to oxygen can also be used to distinguish between solar energetic particles (SEP) and particle populations associated with SIR or CIR. For the analysis we divide the elemental abundance ratios X/O by a reference value for solar ener-getic particles. According to Mazur et al. (1993), the refer-ence value for He/O is nearly the same in the energy interval 0.6–1.0 MeV/n and ≈4.9–22.5 MeV/n. The mean Fe/O value varies by a factor of 3 in the higher energy range. In this anal-ysis we use the reference values from Mason and Sanderson (1999), which refer to Mazur (1993), for both selected energy ranges, i.e. (4.25–7.5) MeV/n and (13.0–30.0) MeV/n.
In Fig. 3, the three panels show the 30-min averaged pro-ton flux, and the daily elemental abundance ratios with re-spect to the corresponding reference SEP value (Mason and Sanderson, 1999) in the lower and the higher energy range, as indicated from November 2000 to May 2002. For the cur-rent analysis 11 time intervals with good statistics for MeV particles were selected. The selected time intervals can easily be found by focusing on the columns with various symbols in Fig. 3. During the gaps, no MeV particles have been reg-istered. The abundance ratios of He/O were present during the longest duration. Therefore, the boundaries of the events were set at the edges of the non-zero He/O abundance ratios. In the upper panel of Fig. 3, the 30-min averaged proton flux (1.2–3.0 MeV) is shown for reference using a solid line. The selected events are labeled from 1 to 11. In the middle panel of Fig. 3, we show the daily averaged elemental abun-dance ratios He/O, C/O, N/O, Ne/O and Fe/O for the energy range 4.25 MeV/n to 7.5 MeV/n with respect to the corre-sponding SEP reference values. In the third panel of Fig. 3, the daily averaged elemental abundance ratios Ne/O, Mg/O, Si/O, S/O and Fe/O for the energy range 13–30 MeV/n also with respect to the corresponding reference SEP value
(Ma-son and Sander(Ma-son, 1999) are shown. For the selected time interval 1, there are no data available in the higher energy range (third panel).
The majority of the abundance ratios in the middle and the third panels are close to unity and are, therefore, compatible with an SEP type. Four daily He/O/SEP ratios (events 1, 3, 4 and 11) are larger than two. The averaged value for the event 2 is enhanced. In the next paragraph, we have a closer look at the events 1–4.
In Fig. 4, the abundance ratios during the time interval from day 84 to day 184 in 2001 are shown. The upper panel presents the corresponding proton to alpha ratio and the al-pha flux profile (1.0–5.0 MeV/n). In the lower panel the cor-responding daily abundance ratios with the He/O errors and the proton flux (1.2–3.0 MeV) are plotted.
On day 92 in 2001 (interval 1), a small decrease in the proton/alpha ratio and a shock are observed at Ulysses. The corresponding He/O and C/O with respect to the reference SEP values are enhanced. This is a clear indication for an SIR. The second decrease in the proton/alpha ratio occurs on day 109 (interval 2). It is accompanied by a spike in the particle flux embedded in a shock pair. The corresponding He/O and C/O elemental abundance ratios increase after the shock pair. On day 127 (interval 3) another decrease in the proton/alpha ratio is found. Shortly after day 129 spikes in the proton and alpha flux are followed by a shock and again enhancements of the He/O elemental abundance ratios are measured. During interval 4 (around day 172), several He/O ratios are larger than unity. The corresponding spike in the alpha flux is similar to that of interval 1. Nevertheless, the proton/alpha ratio (light elements) shows no significant vari-ation. Event 4 follows a period of more than 25 days without an interplanetary shock and a large decrease in the proton to alpha ratio around day 154.
1386 M. Y. Hofer et al.: Composition measurements by Ulysses COSPIN/LET Ulysses: COSPIN/LET 10-4 10-2 100 102 104
Proton flux [p/cm**2 s sr MeV]
1 2 3 4 5 6 7 8 9 10 11
Protons: 1.2-3.0 MeV (30min)
330 361 25 56 86 117 147 178 208 239 270 300 331 361 27 57 88 118 149 2000 2001 2002 0.01 0.10 1.00 10.00 100.00 1000.00
Elemental Abundance Ratios / SEP Values
1 Day Averages Ne/O 13.0-30.0 MeV/n Mg/O 13.0-30.0 MeV/n Si/O 13.0-30.0 MeV/n S/O 13.0-30.0 MeV/n Fe/O 13.0-30.0 MeV/n 0.01 0.10 1.00 10.00 100.00 1000.00
Elemental Abundance Ratios / SEP Values
1 Day Averages He/O 4.25-6.75 MeV/n C/O 4.25-6.75 MeV/n N/O 4.25-6.75 MeV/n Ne/O 5.5-7.5 MeV/n Fe/O 5.5-7.5 MeV/n
Fig. 3. The 30-min averaged proton flux, and the daily averaged elemental abundance ratios in the lower and the higher energy range from
November (DOY 330) 2000 to May (DOY 149) 2002 divided by the corresponding reference SEP values (Mason and Sanderson, 1999) as recorded by the Ulysses COSPIN/LET instrument. In the upper panel the 30-min averaged proton intensity profile (1.2–3.0 MeV) is plotted using a solid line. The selected events are labeled from 1 to 11. The elemental abundance ratios in the energy ranges (4.25 to 7.5 MeV/n) and (13 to 30 MeV/n) are shown in the middle and the lower panel.
Ulysses: COSPIN/LET 10-6 10-4 10-2 100 102
Intensity [particle/cm2 s sr MeV]
Proton/Alpha: (ca. 1 MeV/n)
Alpha: 1.0-5.0 MeV/n (x 0.05)
1 2 3 4
84 94 104 114 124 134 144 154 164 174 184
Day of the Year 2001 0.01 0.10 1 10 100 1000
Elemental Abundance Ratios / SEP Value 1 Day Averages Proton: 1.2-3.0 MeV He/O 4.25-6.75 MeV/n C/O 4.25-6.75 MeV/n N/O 4.25-6.75 MeV/n Ne/O 5.5-7.5 MeV/n Fe/O 5.5-7.5 MeV/n
Fig. 4. Proton and alpha flux and elemental abundance ratios with re-spect to the corresponding reference SEP values as recorded by the Ulysses COSPIN/LET instrument from day 84 to day 184 in 2001.
Based on the characteristic decreases in the proton/alpha ratio, on the enhancements in the He/O and C/O ratios, and on the relative smoothness of the alpha flux profiles, we con-clude that the energetic particle populations sampled at low helio-latitude during the intervals 1–3, and possibly 4, com-prise some material accelerated at SIRs that were observed in the plasma and magnetic field measurements at Ulysses. The SIRs did not show a recurrent pattern, i.e. they were not CIRs in the strict sense.
In Tables 1 and 2, the event averaged elemental abundance ratios (X/O) are listed. The averages were taken over the available values of the element X with respect to oxygen, (X/O), within the selected time intervals. The values result-ing from a sresult-ingle count rate were not taken into account for the calculation of the averages. The given error is the stan-dard deviation of the observed values in the selected time interval. The last six rows contain SEP and CIR reference values (Mason and Sanderson, 1999; Gloeckler et al., 1979), the derived CIR/SEP ratios and their errors for comparison.
In Fig. 5, the event averages as listed in Tables 1 and 2 now with respect to the corresponding reference SEP values,
are plotted for two energy ranges (left and right) and five dif-ferent elemental composition ratios (panels 1–5), resulting in 10 panels. The left column contains averages based on ob-servations in the low energy range (4.25 MeV/n–7.5 MeV/n) and the right column contains the values of the high energy range (13 MeV/n–30MeV/n). The two horizontal lines mark the reference value for an SEP population (i.e. unity), and a CIR population for the corresponding element, i.e. CIR/SEP, as listed in the last six rows of the Tables 1 and 2.
In panels 1 and 2 in the left column, (He/O and C/O), the two dashed horizontal reference lines are well separated. These abundance ratios can, therefore, be used to distinguish as SEP from a CIR or SIR signature. In panel 3, (N/O), no large separation of the reference values is given. Neverthe-less, the measured N/O abundance averages lay close to the double line.
In panels 1–3 in the right column, averaged elemental abundance ratios of Mg/O, Si/O, S/O are the first elemen-tal abundance ratios measured at high helio-latitudes in the energy range from 13.0 to 30.0 MeV/n. The two horizon-tal lines show that these element abundance ratios are less
1388 M. Y. Hofer et al.: Composition measurements by Ulysses COSPIN/LET
Table 1. The elemental abundance ratios averaged during 11
se-lected periods from the beginning of 2001 to day May in 2002 mea-sured by Ulysses COSPIN/LET in the lower energy range. The last six rows contain SEP and CIR values (Mason and Sanderson, 1999), the CIR/SEP ratios and their errors for comparison (He/O, C/O, N/O: 4.25–6.75 MeV/n; Ne/O, Fe/O: 5.5–7.5 MeV/n)
He/O C/O N/O Ne/O Fe/O
2001: 1: 88-103 94.6 0.49 0.16 0.17 0.13 ±11.9 ±0.03 ±0.02 ±0.01 ±0.02 2: 104-118 76.4 0.6 0.17 0.15 0.05 ±6.5 ±0.04 ±0.02 ±0.03 ±0.01 3: 127-134 71.9 0.62 0.14 0.11 0.11 ±13.2 ±0.03 ±0.01 ±0.03 ±0.05 4: 164-176 161.6 0.48 0.17 0.18 0.28 ±51.2 ±0.08 ±0.02 ±0.03 ±0.02 5: 225-240 60.9 0.45 0.09 0.19 0.3 ±11.9 ±0.09 ±0.02 ±0.04 ±0.07 6: 268-285 48.4 0.44 0.12 0.14 0.12 ±2.8 ±0.05 ±0.02 ±0.08 ±0.02 7: 309-320 71.0 0.47 0.11 0.13 0.04 ±13.8 ±0.04 ±0.01 ±0.01 ±0.01 8: 324-337 50.2 0.45 0.12 0.12 0.05 ±3.6 ±0.02 ±0.01 ±0.01 ±0.02 9: 360-9 72.0 0.41 0.18 0.17 0.24 ±7.7 ±0.05 ±0.04 ±0.02 ±0.12 2002: 10: 13-27 55.3 0.44 0.1 0.15 0.07 ±7.3 ±0.05 ±0.02 ±0.02 ±0.02 11: 108-125 45.1 0.40 0.13 0.14 0.05 ±2.7 ±0.03 ±0.03 ±0.02 ±0.01 SEP 55.2 0.48 0.13 0.15 0.16 ±3 ±0.02 ±0.01 ±0.01 ±0.02 CIR 159 0.89 0.14 0.17 0.097 ±1.01 ±0.036 ±0.014 ±0.016 ±0.011 CIR/ 2.88 1.85 1.08 1.13 0.6 SEP ±0.16 ±0.1 ±0.14 ±0.13 ±0.1
optimal than C/O and He/O to identify the type of popula-tion. Within the given available statistical accuracy, we are not able to assign likely source populations in these cases, since the averages are scattered between the two reference lines.
The forth panels in the second last row (left and right) con-tain the elemental abundance ratio of Ne/O in the lower and the higher energy range. In the left panel the Ne/O looks very variable from event to event. Comparing the left and right panel, the higher the energy range, the larger the uncertainty and variability.
The fifth panels of Fig. 5 (Fe/O) show a large variability of the averages of individual events. The variability is very large in both panels. The Fe/O ratio is often found to be en-hanced at the beginning of the event and decreases afterwards in a step-like fashion, as can be seen in Figure 4 around day 109 (e.g. Hofer et al., 2001). Reames et al. (2001) explain
Table 2. The elemental abundance ratios averaged during 11
se-lected periods from the beginning of 2001 to day May in 2002 mea-sured by Ulysses COSPIN/LET in the higher energy range. The last six rows contain SEP and CIR values (Mason and Sanderson, 1999), the CIR/SEP ratios and their errors for comparison Ne/O, Mg/O, Si/O, S/O, Fe/O: 13.0–30.0 MeV/n)
Ne/O Mg/O Si/O S/O Fe/O
2001: 1: 88-103 0.19 0.18 0.14 0.039 0.07 ±0.01 ±0.02 ±0.02 ±0.009 ±0.016 2: 104-118 0.33 0.25 0.19 0.055 0.1 ±0.15 ±0.06 ±0.02 ±0.02 ±0.03 3: 127-134 0.28 0.22 0.16 0.05 0.23 ±0.18 ±0.09 ±0.06 ±0.03 ±0.18 4: 164-176 0.24 - - - -±0.08 - - - -5: 225-240 0.14 0.18 0.16 0.03 0.12 ±0.02 ±0.02 ±0.01 ±0.005 ±0.01 6: 268-285 0.22 0.15 0.13 0.02 0.03 ±0.04 ±0.03 ±0.01 ±0.018 ±0.01 7: 309-320 0.17 0.16 0.14 0.05 ±0.06 ±0.01 ±0.02 - ±0.01 8: 324-337 0.22 0.23 0.08 - -±0.13 ±0.13 ±0.03 - -9: 360-9 0.09 0.21 0.24 - 0.18 ±0.02 ±0.12 ±0.01 - ±0.02 2002: 10: 13-27 0.08 0.51 - - -±0.02 ±0.12 - - -11: 108-125 0.17 0.18 0.12 0.05 0.02 ±0.05 ±0.01 ±0.01 ±0.02 ±0.001 SEP 0.15 0.21 0.15 0.035 0.16 ±0.01 ±0.01 ±0.01 ±0.004 ±0.02 CIR 0.17 0.14 0.1 0.05 0.097 ±0.016 ±0.014 ±0.012 ±0.008 ±0.011 CIR/ 1.13 0.67 0.67 1.43 0.6 SEP ±0.13 ±0.07 ±0.09 ±0.28 ±0.1
the variation of abundance ratios, e.g. Fe/O, in terms of dif-ferential scattering of Fe and O by proton-generated Alfv´en waves.
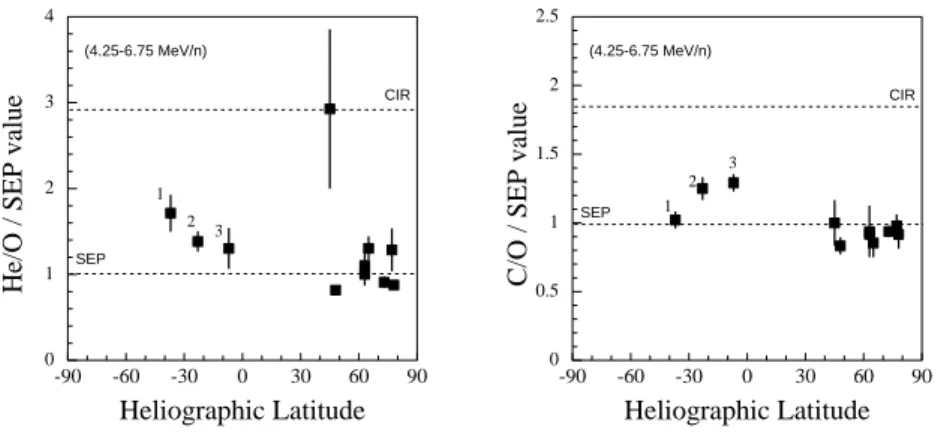
In Fig. 6, the average elemental abundance ratios He/O and C/O with respect to the reference SEP ratio (as listed in Tables 1 and 2) are plotted as a function of the helio-latitude. For the time interval 1 only, the normalized He/O is above the reference SEP line. In both panels, it can be seen that the values for the time intervals 2 and 3 are above the corre-sponding SEP reference line. These three selected time inter-vals take place during the FLS and are accompanied by the above-mentioned short-term decreases in the proton to alpha ratios. Taken together, these pieces of evidence suggest that these intervals can be identified as SIR-influenced. Other-wise, there is only one other averaged value indicative for an SIR or CIR influence, the He/O/SEP ratio for interval 4, although this has a large error bar. The rest of the averaged
Events 1 2 3 4 5 6 7 8 9 10 11 C/ O / S E P v al u e 0 1 2 3 4 SEP CIR (4.25-6.75) MeV/n Events 1 2 3 4 5 6 7 8 9 10 11 N/ O / SE P v alue 0 1 2 3 4 SEP CIR (4.25-6.75) MeV/n Events 1 2 3 4 5 6 7 8 9 10 11 Ne/O / S EP valu e 0 1 2 3 4 SEP CIR (5.5-7.5) MeV/n Events 1 2 3 4 5 6 7 8 9 10 11 Fe /O / S EP value 0 1 2 3 4 SEP CIR (5.5-7.5) MeV/n Events 1 2 3 4 5 6 7 8 9 10 11 Mg/O / S E P value 0 1 2 3 4 SEP CIR (13-30) MeV/n Events 1 2 3 4 5 6 7 8 9 10 11 Si /O / S E P v alu e 0 1 2 3 4 SEP CIR (13-30) MeV/n Events 1 2 3 4 5 6 7 8 9 10 11 S/O / SE P v alu e 0 1 2 3 4 SEP CIR (13-30) MeV/n Events 1 2 3 4 5 6 7 8 9 10 11 Ne/O / S EP valu e 0 1 2 3 4 SEP CIR (13-30) MeV/n Events 1 2 3 4 5 6 7 8 9 10 11 Fe/O / S EP valu e 0 1 2 3 4 SEP CIR (13.0-30.0) MeV/n Events 1 2 3 4 5 6 7 8 9 10 11 He/ O / S EP val u e 0 1 2 3 4 SEP CIR (4.25-6.75) MeV/n
Fig. 5. Elemental abundance ratios with respect to the corresponding reference SEP values as recorded by the Ulysses COSPIN/LET
instrument averaged during eleven selected time periods during the solar maximum mission from the solar polar passages in 2000/2001 to May in 2002 (left: energy range 5.5–7.5 MeV/n; right: 13.0–30.0 MeV/n).
1390 M. Y. Hofer et al.: Composition measurements by Ulysses COSPIN/LET Heliographic Latitude -90 -60 -30 0 30 60 90 He/O / S EP valu e 0 1 2 3 4 SEP (4.25-6.75 MeV/n) CIR 1 2 3 Heliographic Latitude -90 -60 -30 0 30 60 90 C/ O / S E P v al ue 0 0.5 1 1.5 2 2.5 SEP (4.25-6.75 MeV/n) CIR 1 2 3
Fig. 6. Elemental abundance ratios He/O and C/O with respect to the corresponding reference values (Mason and Sanderson, 1999) averaged dur-ing eleven selected time periods from the solar polar passages in 2000/2001 to May in 2002 as a function of the helio-latitude. The elemental com-position measurements were made by the Ulysses COSPIN/LET instrument (4.25–6.75 MeV/n).
values for the intervals 5–11 seem to be fully compatible with an SEP origin, and show, within the errors, no dependence on helio-latitude (not even for the high-latitude events 6, 7 and 8).
4 Discussion and conclusions
The variability of the proton and alpha intensity time pro-files reflect the high solar activity from November 2000 to May 2002. Most of the events overlap, and, therefore, some MeV flux increases do not decay entirely before the follow-ing particle events take place (e.g. Hofer et al., 2003). Nev-ertheless, the events with statistically significant heavy ion fluxes are sufficiently well separated to allow for an event-by-event study of the kind performed here. The measure-ments reported here represent the first-ever determination of energetic particle composition up to high helio-latitudes in the ≈5–30 MeV/n range at solar maximum.
We have used the measured elemental abundance ratios to examine the possible origin of the populations recorded in these previously unexplored regions of the heliosphere. In the majority of the cases, the measured composition is within the statistical errors consistent with an SEP type.
The low-latitude observations during the FLS show the reappearance of SIRs. There are several lines of evidence that support this. As discussed above, the measured He/O and C/O abundance ratios with respect to reference SEP val-ues can be used as discriminators between SEP and SIR/CIR populations. Based on the observed He/O and C/O ratios with respect to the reference values being greater than unity, the short-term decrease in the proton to alpha ratio, and the simultaneous peak in the alpha profiles, three time intervals are identified as being influenced during a few days by SIRs. The SIRs did not show a recurrent pattern, i.e. they were not CIRs in the strict sense. After the solar activity maximum, the level of solar activity decreases, the current sheet tilt de-creases, and even more recurrent compression regions can be expected (e.g. Hofer et al., 2002c; Hofer and Storini, 2003).
The tolerance and the variability of the averaged Ne/O ra-tios of individual events is larger in the higher energy range, as also reported in Mazur et al. (1993). The abundance
ratios of S/O, Mg/O and Si/O are the first such measure-ments at high helio-latitudes in the energy range from 13.0 to 30.0 MeV/n. The reference SEP and CIR values of S/O, Mg/O and Si/O are not optimal for the distinction between the two types of particle populations. The statistical accuracy of these abundance ratios does not permit a firm conclusion concerning the source population. Their average values are consistent with either of the reference compositions (SEP or SIR/CIR).
Within the statistical errors, there is no change in the SEP particle composition signatures with helio-latitude. McK-ibben et al. (2003) identified for selected particle events and the corresponding flare location before and during the south-ern solar passage. Most of the corresponding active regions, at least those above the southern solar polar region, were lo-cated on the northern solar hemisphere, whereas the Ulysses spacecraft recorded significant particle increases above the southern solar polar region. This raises an important question for the theory of the particle propagation in helio-latitude.
One of the solutions could be the fast filling of the in-ner heliosphere with ein-nergetic particles, as discussed by sev-eral authors (e.g. Roelof, 2002; McKibben et al., 2003). Other groups suggest cross-field diffusion (e.g. Zhang et al., 2001). Another possibility would be a field-aligned prop-agation along complex magnetic structures, e.g. magnetic clouds. The third process would also well support the very large onset times at high helio-latitudes of the solar energetic particles events, as reported in Dalla et al. (2003). With the results of this paper we cannot distinguish between these pro-posals.
Based on the elemental abundance ratio recorded by the Ulysses COSPIN/LET instrument, we identified the particle population during the FLS until about mid 2001 as a mixture between the major component of solar energetic particles and a few instances with particles accelerated at about four single compression regions, i.e. SIRs.
Acknowledgements. We acknowledge the use of the Ulysses Data System in the preparation of this paper. We acknowledge R.J. Forsyth for providing the times of the shock occurrences. MYH thanks ESA for the research fellowship in 2001 and 2002. MYH acknowledges also the International Space Science Institute in Bern where the work has been concluded.
Topical Editor R. Forsyth thanks D. Lario and another referee for their help in evaluating this paper.
References
Dalla, S., Balogh, A., Krucker, S., et al.: Characterization of SEP events at high heliographic latitudes, Solar Wind 10, June 17-21, Pisa, Italy, in press, 2003.
Gloeckler, G., Hovestadt, D., and Fisk, L. A.: Observed Distribu-tion FuncDistribu-tions of H, He, C, O and Fe in Corotating Energetic Par-ticle Streams: Implications for Interplanetary Acceleration and Propagation, Astrophys. J., 230, L191–L195, 1979.
Gosling, J. T., McComas, D. J., Skoug, R. M., et al.: Stream Inter-action Regions at High Heliographic Latitudes During Ulysses’ Second Polar Orbit, Space Sci. Rev., 97, 189–192, 2001. Hofer, M. Y., Marsden, R. G., Sanderson, T. R., et al.: Cosmic Ray
and Solar Particle Composition Measurements in the Southern Solar Polar Region, 27th Int. Cosmic Ray Conf., 8, 3116, 2001. Hofer, M. Y., Marsden, R. G., Sanderson, T. R., et al.: Composition
Measurements above the Southern Solar Polar Region Around the Solar Activity Maximum by the Ulysses COSPIN/LET in-strument, Geophys. Res. Lett., 10.1029/2002GL014944, 2002a. Hofer, M. Y., Marsden, R. G., Sanderson, T. R., et al.: Solar
En-ergetic Particle Reservoirs Throughout the Heliosphere, Cospar Meeting, Houston, October 10-19, 2002b.
Hofer, M. Y., Marsden, R. G., Sanderson, T. R., et al.: Energetic Particle Composition at High Helio-Latitudes During the De-clining Phase of Solar Cycle 23: Ulysses COSPIN/LET Obser-vations, AGU Fall Meeting, Eos Trans. AGU, 83(47), SH11A-0385, 2002c.
Hofer, M. Y., Marsden, R. G., Sanderson, T. R., et al.: Compositon Measurements over the Solar Poles Close to Solar Maximum – Ulysses COSPIN/LET Observations, Solar Wind 10, in press, 2003.
Hofer, M. Y. and Storini, M.: Repeated Structures Found After the Solar Maximum in the Butterfly Diagramms of Coronal Holes, Solar Wind 10, in press, 2003.
Lario, D., Mclennan, C. G., Roelof, E. C., et al.: High-Latitude Ulysses Observations of the H/He Intensity Ratio under Solar Minimum and Solar Maximum Conditions, Solar and Galac-tic Composition (Ed. Wimmer-Schweinegruber), AIP conference proc., 183–188, 2001.
Lario, D., Roelof, E. C., and Decker, R. B.: Solar cycle variations
of the energetic H/He intensity ratio at high heliolatitudes and in the ecliptic plane, Ann. Geophysicae, this issue, 2003.
Marsden, R. G., Henrion, J., Sanderson, T. R., et al.: Calibration of Space-borne Charged Particle Telescope Using Protons in the Energy Range 0.4 to 20 MeV, Nucl. Instr. and Meth., 221, 619– 626, 1984.
Marsden, R. G., Sanderson, T. R., Wenzel, K.-P., et al.: COSPIN LET Observations of Recurrent Energetic Particle Events During the In-ecliptic Phase of the ULYSSES Mission, Adv. Space Res., 13(6), 95–98, 1993.
Marsden, R. G., Sanderson, T. R., Tranquille, C., et al.: The Ulysses Fast Latitude Scan at Solar Maximum: COSPIN/LET Energetic Particle Observations, 27th Int. Cosmic Ray Conf., 8, 3310, 2001.
Mason, G. M. and Sanderson, T. R.: CIR Associated Energetic Par-ticles in the Inner and Middle Heliosphere, Space Science Rev., 89, 77–90, 1999.
Mazur, J. E., Mason, G. M., Klecker, B., et al.: The Abundances of Hydrogen, Oxygen and Iron Accelerated in Large Solar Particle Events, Astrophys. J., 404, 810–817, 1993.
McKibben, R. B., Connell, J. J., Lopate, C., et al.: Ulysses COSPIN Observations of the Energy and Charge Dependence of the Prop-agation of Solar Energetic Particles to the Sun’s South Polar Re-gions, 27th Int. Cosmic Ray Conf., 8, 3281, 2001.
McKibben, R. B., Connell, J. J., Lopate, C., et al.: Ulysses COSPIN Observations of Cosmic Rays and Solar Energetic Particles from the South to the North Pole of the Sun during Solar Maximum, Ann. Geophysicae, this issue, 2003.
Reames, D. V., Ng, K., and Berdichevsky, D.: Angular Distribu-tion of Solar Energetic Particles, Astrophys. J., 550, 1064–1074, 2001.
Roelof, E. C.: Near-relativistic Electrons: Corotating Interaction Regions and Particle Reservoirs, AGU Spring Meeting, Eos Trans. AGU, 83(19), SH21D-09, 2002.
Simpson, J. A., Anglin, J. D., Balogh, A., et al.: The ULYSSES Cosmic Ray and Solar Particle Investigation, As-tron.&Astrophys. Suppl. Series, 92(2), 365–399, 1992.
Tranquille, C., Marsden, R. G., Sanderson, T. R., et al: A Survey of3He Enhancements at 2-20 MeV/nucleon: Ulysses COSPIN/LET Observations, Ann. Geophysicae, this issue, 2003. Zhang, M., McKibben, R. B., Lopate, C., et al.: Ulysses Observa-tions of Solar Energetic Particles From the July 14, 2000 Event at High Heliographic Latitudes, 27th Int.Cosmic Ray Conf., 8, 3302, 2001.