HAL Id: hal-01499461
https://hal-univ-paris.archives-ouvertes.fr/hal-01499461
Submitted on 31 Mar 2017
HAL is a multi-disciplinary open access
archive for the deposit and dissemination of
sci-entific research documents, whether they are
pub-lished or not. The documents may come from
teaching and research institutions in France or
abroad, or from public or private research centers.
L’archive ouverte pluridisciplinaire HAL, est
destinée au dépôt et à la diffusion de documents
scientifiques de niveau recherche, publiés ou non,
émanant des établissements d’enseignement et de
recherche français ou étrangers, des laboratoires
publics ou privés.
Northeastward growth of the Tibet plateau deduced
from balanced reconstruction of two depositional
areas-The Qaidam and Hexi Corridor basins, China
Francois Métivier, Yves Gaudemer, Paul Tapponnier, Bertrand Meyer
To cite this version:
Francois Métivier, Yves Gaudemer, Paul Tapponnier, Bertrand Meyer. Northeastward growth of the
Tibet plateau deduced from balanced reconstruction of two depositional areas- The Qaidam and Hexi
Corridor basins, China. Tectonics, American Geophysical Union (AGU), 1998, 17, pp.823 - 842.
�hal-01499461�
TECTONICS, VOL. 17, NO. 6, PAGES 823-842, DECEMBER 1998
Northeastward growth of the Tibet plateau deduced
from balanced reconstruction of two depositional areas-
The Qaidam and Hexi Corridor basins, China
Francois
M•tivier, Yves Gaudemer,
Paul Tapponnier,
and Bertrand Meyer
Laboratoire de Tectonique, M•canique de la Lithosphare ß URA 1093, Institut de Physique du Globe de Paris
Abstract. We address the problem of late Cenozoic
uplift, erosion, and growth of northeastern Tibet by re- constructing, from isopach maps and drill holes, the vol-
umes and masses of sediments deposited in the Qaidam
and Hexi Corridor basins since --• 35 Myr ago. The mass budget is based on simple geometrical assump- tions such as regional similarity of the thickness ratios between strata of different ages. In the Qaidam, where our record extends back to the Oligocene, the budget shows a huge rise of the accumulation rates after the
beginning of the Pliocene (5.3 Ma). The early Pliocene
seems to be the period of maximum deposition with ac-
cumulation
rates
in excess
of i mm yr -s (--• 2.7 kg m -2
yr -•) of compacted
rocks
throughout
the basin.
There
also seems to be a southeastward shift of the largest
depocenters between the upper Pliocene (3.4- 1.6 Ma)
and the Quaternary. In the Hexi Corridor, sedimenta- tion is confined to small foreland flexural depressions
associated with the frontal thrusts of the Qilian Shan
and occurs at an average rate one order of magnitude
smaller than in the Qaidam basin. The accumulation rate is maximum in the Quaternary. The sedimentation
history appears to support a plateau-building mech- anism resulting from the combination of two geolog- icallly common processes: crustal-scale thrusting and sedimentary basin infilling. The time needed to com-
pletely fill the Qaidam basin and make its catchment
a plateau closely resembling that of the highest part of
Tibet (Qangtang) is of the order of 9 Myr. The mecha-
nism now at work north of the Kunlun, which involves rapid infilling of broad, fiat areas separated by rela- tively narrow mountain ranges, has thus probably been important in producing the high, smooth topography
that characterizes much of central Tibet.
1. Introduction
The sedimentary record preserved in the b•sins that surround the mountains north of India may be used to
constrain the mechanisms that have led to the rise of
Copyright 1998 by the American Geophysical Union.
Paper number 98TC02764. 0278-7407/98/98TC-02764512.00
the Tibet plateau, whose deformation and uplift history has long been a subject of debate. The plateau covers
an area of--• 2 x 10
e km 2 with an average
elevation
of
5 km in its central
and northern
part (the Qangtang)
[e.g., Fielding et al., 1994].Competing models invoked to account for its exis- tence and rise imply markedly different modes of defor-
mation of the mantle and crust. Wholesale underthrust-
ing of India [Argand, 1924; Powell and Conaghan, 1973; Ni and Barazangi, 1983] requires that the Asian mantle be detached from its overlying crust by delamination [Bird, 1978]. Deformation of Asia as a viscous sheet [England and McKenzie, 1982; England and Houseman, 1986] implies widespread thickening of the Asian man-
tle north of the Himalayas. Convective removal of a lithospheric root underlying Tibet, a possible conse- quence of such mantle thickening, might lead to rapid and uniform rebound of a vast area to high elevation
[Molnar et al., 1993], inducing sudden, regional climate
change. Injection of the more resistant Indian crust
into the weaker Asian crust, analogous to piston core injection [Zhao and Morgan 1985], might induce the
rise of a high plateau by far-traveled flow of the lower
crust alone. Thrusting on crustal-scale ramps above a
large south dipping ddcollement along the north edge of the plateau [Bally et al., 1986; Mattauer, 1986;Tap- ponnier et al., 1990; Meyer et al., 1998] is consistent
with subduction of the Asian lithospheric mantle under
the Kunlun. Elastic buckling [Jin et al., 1994; Burg et
al., 1995] implies folding of the crust and mantle at two
different wavelengths, which would also account for the
topographic and crustal thickness variations observed
in Tibet [Him et al., 1984; Wittlinger et al., 1996]. The deformation history and surface morphology that
such models predict are also quite different. Some im-
ply synchronous deformation and uplift over much of
Tibet [e.g., Zhao and Morgan, 1985; Molnar ct al.,
1993]; some imply propagation
of deformation
[Pow-
ell and Conaghan, 1973; England and Houseman, 1986;
Tapponnier et al., 1990; Meyer et al., 1998], Others do not discriminate between these two possibilities [Bird, 1978; Jin et al., 1994; Burg et al., 1995]. Only two types of models [Tapponnier et al., 1990 and Meyer et al., 1998; Jin et al., 1994; Burg et al., 1995] address the 823
824 MI•TIVIER ET AL.' NORTHEASTWARD GROWTH OF TIBET
"small-scale" topography of the plateau and possible variations of crustal thickness. The others are only con- cerned with the first-order flat topography, inferred to reflect uniform crustal thickness. Eventually, only one type of model takes erosion of reliefs and the existence of large sedimentary basins within the Tibet-Qinghai
into account [Meyer, 1991; Meyer et el., 1998].
Examination of present-day drainage in the Qangtang
shows that it forms a mosaic of closed catchments with
internal drainage, namely, sedimentary basins collecting
the erosion products of nearby reliefs. The topography of NE Tibet, north of the Kunlun range, though differ- ent from that of the Qangtang in absolute elevation, ex- hibits strikingly similar features, with vast closed catch- ments feeding sedimentary basins that form flat plains
surrounded by mountain ranges [Meyer, 1991; Meyer et
el., 1998](Plate 1). As a step toward understanding how
the peculiar, current morphology of north central Tibet has formed, we therefore analyze here the interaction of tectonics and erosion in the desert-like regions north of the Kunlun where active mountain building and strong erosion are now in progress.
2. Coupled Sedimentation and
Tectonics in NE Tibet
The Qaidam basin (Plate 1), whose surface, at an av- erage elevation of 2700 m above sea level (asl), is covered
with salt fiats, extends
over
an area of 103,000
km 2 (Ta-
ble 1) at the foot of the --• 6000-m-high Kunlun range. The catchment area of the basin (excluding the depo-sitional
area) covers
151,000
km 2 and extends
from the
Kunlun Shan to the Altyn, Tang He Nan, and Qinghai
Nan Shan. A few streams only are perennial.
North of the Qilian Shan, on the Gobi-Ala Shan Plat-
form, the Hexi Corridor basin stands --• 1400 m asl,
.-- 1300 m lower than the Qaidam. With a surface of
18,000 km • this narrow alluvial plain is mostly fed by
rivers draining the Qilian mountains. The correspond-
ing catchment
area is about 38,000 km •. The biggest
perennial river is the Hei He, whose inland delta reaches
into Mongolia.
Tertiary and Quaternary thrusting is particularly pro- minent north of the Kunlun fault. Plio-Quaternary
folding and thrusting is clear on seismic sections [Belly
et al., 1986]. At tile foot of the Kunlun range,
thrusts
cut through the Oligo-Miocene deposits. Along thesouth side of the Qaidam the SW dipping thrusts re- main hidden under thick Plio-Quaternary sediments
[Belly et el., 1986]. The traces of seismic, SW dip-
ping thrusts have been mapped, using SPOT satellite
imagery, topographic maps and field evidence along the
foothills of the Tang-He Nan, Sule Nan, Qilian Shan and Long Shu Shan [Tepponnier et el., 1990; Meyer,
1991; Meyer et el., 1998]. NE dipping, active thrusts also exist along the Qinghai Nan Shan [l/en der Wo- erd et el. 1998]. Scarps offsetting Quaternary fan
surfaces are common along those thrusts, segments of
which have produced large earthquakes (Luo Tuo Chen
in 180 A.D., Chang Ma in 1932 (M =7.6), Gong He
in 1990, (M-6.9), Gulang
in 1927 (M-8.3))[Peltzer
et el., 1989; Gong et el., 1993; Tepponnier et el., 1990; Chen et el., 1994; Geudemer et el., 1995]. Most of the major thrust systems absorb --• N30øE shortening and have been active throughout the Quaternary at least (Fig 1).The Altyn Tagh fault appears to control the geome- try of mountain building in NE Tibet [e.g., Peltzer et el., 1989; Tepponnier et el., 1990; Meyer, 1991; Meyer et el., 1998]. There is much less deformation west and
north of the fault in the stable Tarim block than south
and east of the fault, where the surface currently af-
fected by thrusting and folding covers an area approxi- matively the size of the Tarim basin (more than 500,000
km " excluding
the two sedimentary
basins
of interest
in
this study). Northeastward, there is little thrusting be- yond the Long Shu Shan, not far from where the Altyn Tagh fault vanishes (Plate 1). Quaternary left-lateralslip on the Altyn Tagh and Kunlun faults appears to be kinematically coherent and in the case of the A1-
tyn Tagh physically linked with thrusting in the Qilian ranges and in NE Tibet in general [Meyer, 1991; Meyer et el., 1998].
Active tectonics and erosion-sedimentation are inter-
dependent. Sustained uplift of a mountain range favors
sustained river incision and erosion and leads to the
formation of foreland flexural depressions. This has led
Tepponnier et el. [1990], Meyer [1991] and Meyer et
el. [1998] to propose
that most of the parallel ranges
in NE Tibet grew as large-scale ramp anticlines above
Table 1. Physiography
of Drainage
Areas of Qaidam, Hexi Corridor,
and Gong He
Basins
Basin Depositional Area, Drainage Area, Base Level,
km 2 km 2 m asl Above Base Level, kma Volume of Topography
Gong He 9,700 4,000 3,000 3,600
He Xi 18,000 (160,000) 37,900 1,400 71,000
Qaidam 103,300 150,800 2,700 205,300
Calculated from Defense Mapping Agency [1992]. Number in parentheses is Quaternary
826
MI•TIVIER ET AL.' NORTHEASTWARD
GROWTH
OF TIBET
south-dipping thrusts splaying from the left-lateral A1-
tyn Tagh and Kunlun faults and that sediment accumu-
lation in the basins caught between such rising ranges
was an important process in the buildup of Tibet's high
and flat topography. Figure 1 summarizes such a mech-
anism, which coinvolves thrusting and basin infilling.
Fast migration of thrusting and crustal shortening is
guided
by the propagation
of the Altyn
Tagh
fault,
lead:
ing to the formation of distant, parallel, narrow ranges. As they grow, the ranges induce formation of flexural
foredeeps that begin to fill with the erosion products de-
rived from the adjacent mountains. As new ranges form
farther northward near the tip of the propagating strike-
slip fault, basins born as foredeeps progressively become
captive. Ultimately, damming of the catchments outlets
by active tectonic uplift and strike-slip faulting induces
an increase of sedimentation within the basins that end
up as piggyback basins and fill rapidly. The final result
of such a coupling between tectonics and erosion is a morphology characterized by high flat and smooth sur- faces separated by narrow mountain ranges, typical of that currently observed on the Tibet plateau.
In what follows, we discuss the mechanism outlined
in Figure 1 using the sedimentary history of the Qaidam
and Hexi basins since about 25 Ma. We perform a mass balance of the sediments deposited in these two basins and compare them with tectonic evidence for strike-
slip faulting that closes catchments. The sediment data
are derived from petroleum surveys while the structural data are derived from active tectonic and field studies. We therefore use two independant data sets to test the plausibility of the "catchment closure and basin infill- ing" mechanism. Eventually, we try to estimate the
quantitative implications of such a mechanism in terms
of timing for the growth of Tibet.
3. Data and Processing Technique
3.1. Stratigraphy of the Basins
Both the Qaidam and Hexi Corridor have Precam- brian basements. The former, dated around 1.5-2 bil-
lion years [e.g., Wang and Coward, 1990, and references therein], is covered with alternating series of shallow
marine and continental sediments of Paleozoic to Tri-
assic age. The latter is covered with a series of ma-
rine deep water, progressively evolving into continen-
tal facies until the Permian, by the end of which the withdrawal of the sea is complete. In the Qaidam such withdrawal only takes place around the end of Trias-
sic [Bally et al., 1986; Wang and Coward,
1990, 1993].
Lacustrine Jurassic and Cretaceous rocks are then de-
posited along the NE margin of this basin. To the south
such rocks progressively evolve to swamp deposits and to fluvial conglomerates, sandstones, and mudstones.
Continental facies of lacustrine and fluvial type, alter-
nately coarse (e.g., sandstones and conglomerates) and fine (e.g. mudstones and shales) also develop in the Hexi
Corridor during the same period. Paleocene and Eocene
deltaic and shallow lacustrine sandstones containing
ostracods and plants, generally unconformable on the
Mesozoic strata, remain confined to the NE border of
the Qaidam (Lulehe Formation) and are absent in the
Hexi Corridor. From the Middle Oligocene to the end
of the Miocene, lacustrine, dark-colored argillaceous de-
posits invade the entire Qaidam (Ganchaigou Forma- tion.), whereas the first Cenozoic sediments deposited in the corridor are of coarse type [Xu, 1985; Wang and
Coward, 1993]. During the Pliocene, fluvial and lacus-
trine facies (Youshashan Formation) become dominant in the Qaidam [Chen and Bowler, 1986], and the salin-
ity of distal deltaic lakes rises, as indicated by the pres-
ence of gypsum in shales and clay stones (Shizigou For- mation) [Xu, 1985]. Sedimentation during that period
in the Corridor is characterized by fluvial sandstones
evolving into conglomerates. The Quaternary deposits
of the Qaidam are chiefly composed of dark-colored,
argillaceous, gypsum-bearing strata (Qigequan Forma- tion), conglomerates and sandstones, while fluvial pied- mont sediments are predominant in the corridor [e.g.,
Xu, 1985; Gu and Di, 1989; Wang and Coward, 1990,
1993].
Dating of continental strata is based on palynology and freshwater fossil assemblages. Some ages, espe- cially that of the lower part of the Youshashan For-
marion, are subject to discussion. Xu [1985], on the
basis of drill sections, da;es this formation as middle to
late Miocene, whereas ocher authors [e.g., Bally et al.,
1986; Gu and Di, 1989; Bureau of Geology and Mineral
Resources of Qiaghai Province, 1991] place the entire
Youshashan Formation in the Pliocene. Since only Xu
[1985] gives fossil assemblages resulting from detailed
analysis of drill cores, we will thereafter consider that this formation is of late Miocene age or younger. Typi-
cal fossil assemblages corresponding to the Miocene and
Pliocene formations are given in Table 2. Dating uncer-
tainties are discussed in appendix B. We had access to
eight drill logs in the Qaidam basin and four in the Hexi
Corridor. Complete stratigraphy for the former is given
by Xu [1985], while information on the latter was pro-
vided by the French petroleum company TOTAL CFP.
Figure 2 shows a simplified stratigraphy of drill holes
in the Qaidam area. Table 3 sums up stratigraphic in- formation for the drill logs available, and Table 4 sum- marizes the data used to complete our mass balance for
the Qaidam and Hexi Corridor. We also had access to
several isopach maps: four in the Qaidam and two in the Hexi basin. As is usual in oil research and explo-
ration, such maps are derived from linear interpolation
between seismic sections and between calibration points
M•TIVIER ET AL.' NORTHEASTWARD GROWTH OF TIBET 827 a $W NE BL BL BL
.
-•1• Drainage
outlet
"•.• .*'-.'-' '
..
Upthrust
ends
up cutting drainage outlet C ' . Captive catchmerit I -. 200 km IFigure 1. (a) Cross-sectional
sketch
showing
proposed
model
of formation
of a plateau by rise
of successive ranges separated by foreland depressions whose drainage outlets become dammed, inducing rapid basin infill. (b) and (c) map view of same model at three different time intervals:(a) foreland
depression
(Figure
la), becoming
closed
(Figure
lb) and filled with sediment
(Fig-
ure lc). This process
results
from uplift of surrounding
mountain
belts, induced
by large-scale
propagation of bounding strike-slip faults (Figure ld).828 MI•TIVIER ET AL- NORTHEASTWARD GROWTH OF TIBET
Table 2. Palynological and Fossil Dating of Continental Strata in NE Tibet
Period Formation Palynology and Fossil Assemblages Quaternary Qigequan
Upper Pliocene Shizigou
Lower Pliocene
Miocene to Oligocene
Upper Youshashan
Lower Youshashan Ganchaigou
Ste#odon orientalis Owen
Radix #rabaui (Ping) R. plicatula (Benson)
Eucypris inflata (Sars)
Cyprinotus salinus (Brady)
Cyprideis littoralis (Brady)
Candona neglects G. O. Sars Hyocypris bradyi G. O. Sars
Cyprideis torosa (Jones)
Hyocypris dorsotuberculata Chen Tian-min Eucypris concinna rostrata Sun Zhen-cheng Candona convexa qiulin#ensis Yang
Planorbarius corneus (Linnaeus)
Planorbis procurnbens Volkova
Cyprideis littoralis (Brady)
Candona kir#izica Mandelstam Tectochara mariai Globula Planorbis youngi Ping P. tun#urensis Ping
Candona kir#izica Mandelstam Cyprinotus derupta Schneider C. arguatus Schneider C. aft. catillus Schneider Cyprideis torosa Jones Eucypris lon#a Mandelstam E. aft. oculata Schneider
Charites molassica (Straub)
The four fossil assemblages used to constrain the ages of our Cenozoic traits are given by Xu [1985].
the isopachs. In order to maximize absolute errors in our calculation, we assumed, for each map available, an uncertainty equal to the contour interval. We also dig- itized isopachs of Quaternary deposits in the Gonghe basin, a smaller sedimentary basin east of the Qaidam, fed by the growing Qinghai Nan Shan and now incised
by the Huang He (Plate 1). This latter map gives us
informat. ion about the Quaternary infilling of a basin
located east of the Qaidam and will later on be used
for comparison purposes. All Calculations linked with
topographic volumes were made with 2 min of arc reso-
lution digital elevation models (DEM) derived from the Defense Mapping Agency [1992].
3.2. Compac/ing Rocks to get Mass
The reconstruction technique used to produce a con-
servative mass balance of the volumes accumulated in
the Qaidam basin has already been described by M4tivier
and Gaudemer [1997], but we summarize here the me-
thodology because, unlike in usual back stripping anal-
yses, the physical balance we perform implies studying compacted, rather than decompacted, strata in order
to estimate the sediment mass [e.g., Gallagher, 1989; Baldwin and Butler, 1985].
Calculating mass from sediment thickness measure- ments implies that we know how density varies with
depth. There are two ways of conducting such a calcula-
tion if the stratigraphic sequence {(zi, ti), i = 1,..., N} is known, each (zi,ti) pair defines the age (ti) and the depth (zi) of the ith strata, the first one being the youngest one, and if either the density p(z) or the poros- ity o:(z) are known. Given depth and density, the mass
accumulation M per unit area over a time interval At
is
fz
M(At) - p(z)dz (1) 1
where z• and z2 are the upper and lower limits of the
strata deposited during time interval At = t2-t•. This
is the most precise way to obtain M(At). The knowl- edge of p(z) often being poor, one can derive the mass
from the knowledge of porosity.
From depth and porosity, one can obtain the grain
volume [Gallagher, 1989] which can be directly related
to the mass
by the grain density
pg(z)
•z
z2
M(At) --
pg(z)[1
- w(z)] dz
(2)
1The grain density can be shown to be, on average, a
constant
• of order
of 2.7 x 10
a kg.m
-a [Baldwin
and
Butler, 1985; Curray, 1994; M4tivier, 1996; M4tivier
and Gaudemer, 1997]. We shall use this average value
noting that in the case of the Qaidam and Hexi basins,
MI•TIVIER ET AL.' NORTHEASTWARD GROWTH OF' TIBET 829 lOOO 1.6 3.4 5.3 2.000 3000 23.7 4000 36.6 (3)
5000
clay
stone
• "• sands and cumulative silts thicknesses (m)*•:•"•-•.-•.•.•••.•.•.'•••••i!
I conglomerates
and molasses(7)
66.4
Age (m yr)
Figure 2. Simplified stratigraphic logs of Neogene sections in Qaidam basin. Locations and
exact thicknesses
are given in Table 3. Proportion
of coarse
and fine sediments
in each log box
corresponds approximately to real proportion in strata. Numbers refer to position on map offigure 3.
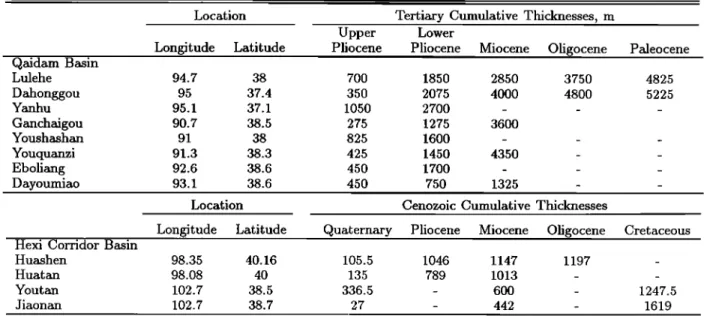
Table 3. Stratigraphic
information
Derived
From Drill Logs
in Qaidam
and Hexi Corridor
Basins.
Location Tertiary Cumulative Thicknesses, m
Upper Lower
Longitude Latitude Pliocene Pliocene Miocene Oligocene Paleocene
Qaidam Basin Lulehe 94.7 38 700 1850 2850 Dahonggou 95 37.4 350 2075 4000 Yanhu 95.1 37.1 1050 2700 - Ganchaigou 90.7 38.5 275 1275 3600 Youshashan 91 38 825 1600 Youquanzi 91.3 38.3 425 1450 4350 Eboliang 92.6 38.6 450 1700 - Dayoumiao 93.1 38.6 450 750 1325 3750 4800 _ 4825 5225 _
Location Cenozoic Cumulative Thicknesses
Longitude Latitude Quaternary Pliocene Miocene Oligocene Cretaceous Hexi Corridor Basin
Huashen 98.35 40.16 105.5 1046 1147 1197 -
Huatan 98.08 40 135 789 1013 - -
Yout an 102.7 38.5 336.5 - 600 - 1247.5
Jiaonan 102.7 38.7 27 - 442 - 1619
Dash means that no information was available either because of imprecise dating (Hexi basin) or shallow drilling
1130 MI•TIVIER ET AL.' NORTHEASTWARD GROWTH OF TIBET
Table 4. Data Type and References lJsed in This Study
Basin
Qaidam
Hexi
Gong He
Data Type
Neogene and Quaternary (1:2,500,000; 1000)
Oligo-Miocene (1:10,000,000; 200)
Pliocene (1:10,000,000; 200)
Quaternary (1:10,000,000; 200)
Eight stratigraphic columns
Base of Cretaceous (1:2,500,000; 500)
Quaternary (1:2,500,000; 100)
Four drill logs
Quaternary (200)
Source
Sun and Leibo [1984] Xu [1985]
Xu [1985] Xu [1985] Xu [1985]
Sun and Leibo [1984]
Zhu [1990]
TOTAL CFP
Ma [1989]
Numbers in parentheses indicate map scale and uncertainty (in meters) assumed
for calculations. TOTAL CFP is the Petroleum company TOTAL Companie Franqaise des P•troles.
low values of • because of the presence of biogenous
silica or of siliceous ooze in the sedimentary column
[Davies et al., 1995].
Neither in the Qaidam nor Hexi basins, unfortu-
nately, are the two variables p(z) or co(z) available.
To alleviate this problem, we used the general solidity-
depth curves ($(z) = 1-co(z))for shales undercom-
pacted shales and sandstones given by Baldwin and
Butler [1985] with their respective range of uncertainty (Figure 4): for normal shale
( z )•/6.a•
S!(z)
- 6020
(3)
for undercompacted shale
z
-
(4)for coarse sediments
(-z)
So(z)
- I - 0.49exp
3700
and averaged these three curves by an exponential solidity-
depth curve:
$s(z)
- 1 - 0.43exp
-3014
(6)The uncertainty linked to estimating the .grain thick-
ness with this solidity-depth relationship is about 20%
(shading on Figure 4). Equation (1) becomes:
1
z
• [1- 0.43
exp
(-3014)]
dz (7)
which yields the mass M accumulated at any point dur- ing a time interval At, knowing the present-day thick-
ness of strata (z2 - zl). Because • is assumed to be
constant, compacted volumes of rocks, also known as solid phase volumes, are equivalent to mass. Hence we will hereafter refer to solid phase when giving lo-
cal (mm yr-1)and regional
(km
3 myr
-1) accumulation
rates, equivalent to mass accumulation rates.
3.3. Mass Balance Procedure
Given an isopach and a stratigraphic column, the re-
gionally balanced reconstruction of strata in the column
and above the isopach can be done by assuming that the relative thickness of each strata defined in one col- umn is constant everywhere in the vicinity of that col- umn. In other words, we infer that the proportions of the different stratigraphic formations at one data point
(drill hole) hold over a certain area around it (Figure 5). Given the total depositional area and all the sites
where a ratio is computed, the vicinities are defined using a nearest neighbor method. The isopach map considered in the case of the Quidare gives the thick- ness of sediments deposited since the beginning of the Neogene. It was digitized and interpolated on a reg- ular 5-min arc resolution grid. The bounding surfaces
of the different stratus are then reconstructed by cal-
culating at each point of the grid the product between
the thickness given by the isopach and the proportion
of sediments calculated from the column [Mdtivier and Gaudemer, 1997].
If M drill hole measurements are available, we di- vide the basin into M domains, according to a crite-
rion of minimum distance to drill hole sites. At each
site (Xo, yo) the accumulation of N layers of thickness hi(xo, yo), for i = 1, ..., N during the Neogene leads to:
z/N:i hi(lgo,
Yo)
-- H(lgo,
Yo)
for i = 1, ..., N and J = 1,...,M
(8)
We then define at each site the relative thickness of each
strata according to:
Ri- hi(xo_,yo)
for
i- 1...N
(9)
n(o, yo)'
Eventually we assume the relative thickness defined at
one drill-site to be constant over the corresponding do-
MI•;TIVIER ET AL.- NORTHEASTWARD GROWTH OF TIBET 831
//
l(
832
MI•TIVIER ET AL.- NORTHEASTWARD
GROWTH
OF TIBET
0.8 0.6 0.4 0.2 Undercompacted shale Normal shaleSandstone
Average solidity curve
0 ... • ... • ... • ... ! ... t ... 1 ... •. ... l ... 1 ...
0 1000 2000 3000 4000 5000
Depth (m)
Figure 4. Solidity curves for sandstones, normal shales, and undercompacted shales from Bald-
wzn and Butler [19851 and average solidity curve used in this study (equation (6)). Thinner lines give uncertainties for curves of Baldwin and Butler [1985]; shaded area shows uncertainty
envelope for average solidity curve.
for i- 1,..., N and for j - 1,..., M
(10)
The same reconstruction can be done using geologic
cross sections and digitized isopachs. In the case of the
Hexi Corridor, we defined four vicinities, one for each of the drill sites available; while in the more complex case of the Qaidam, we used the digitized sets available for the different epochs together with the eight strati- graphic columns to compute the proportion of each strata at each grid node.
Equation (10) gives the general formula for the re-
construction of N different stratigraphic layers provided
that the cumulative thickness of such layers everywhere in the depositional area, given by isopach maps digi- tized and interpolated on a regular grid, and the thick-
ness/time ratio at M different points, given either by
drill holes, cross sections or even by isopach maps, are known. This is the case in the Qaidam, where we have several maps spanning the period of interest. Thus our
reconstruction has a maximum resolution given by the
grid spacing. Ideally, if one drill log were available at each grid point the problem would be completely de-
termined, and the reconstruction would be ascertained.
Thus the reconstruction technique can be demonstrated to be mathematically exact when tending toward the limit where one drill hole exists at each point in space.
Details of the uncertainty calculation that can be de-
rived from differential calculus are discussed by M•tivier
and Gaudemer [1997] and given in appendix A.
4. Results and Interpretation
4.1. Analysis
The total volumes of the Neogene and Quaternary solid phase are: 415,000 + 160,000 km a for the Qaidam basin and 23,000 + 16,000 km • for the Hexi Corridor.
From the other data sets, namely, drill holes and other
digitized isopachs, we compute at each grid point the proportion of the sediments that accumulated during
each
of the following
periods:
Quaternary
(1.6-0 Ma),
upper Pliocene
(3.4-1.6 Ma), lower Pliocene
(5.3-3.4
Ma), upper Miocene
(11.2-5.3 Ma), and lower
to mid-
dle Miocene (23.7-11.2 Ma). The Oligocene thicknesseswere also reconstructed by extrapolation of the propor-
MI•,TIVIER ET AL.- NORTHEASTWARD GROWTH OF TIBET 833 Oligocene (36.6-23.7 Ma) Lower Pliocene (5.3--3.4 Ma)
85'
90'
95'
100'
1•05'
40' ••- - 'rt , • •______--• •o / --; r /•_._ •:"•. -;: 't.•-•• ' •85'
90'
95
ø
100'
105ø
85'
90
ø
95'
100'
105'
90' 95' 100 ....Lower & Middle Miocene (23.7--11.2Ma)
,•o'•
;/ -
.'M__---•,,,o'
I ..-' L..- •":!."' •-•L '-.1.!,--L,"'•,--'"
/ '- -,.' -:.._':•.
i ' i .- - •- ," %'.-•-._ß •i
0 i1 ,,. •',•\•.
"'--
ß ...• ,,•.,
%.9
• .• , .
'•" !85
90'
95
ø
100
ø
105
Upper Pliocene (3.4-1.6 Ma)
Upper Miocene (11.2--5.3 Ma) Quaternary (1.6-0 Ma)
o.•- •o'
_gs,
,, •oo' •o,5'
05' •.
, g•. , •.
•o5'
40-
;! _
.,•____-•4o'
4o-•
•. .•
40'
,
_%: ._ .
• 1-' '"-•-• '""' t ••85•
90'
95
•
100
•
105'
85
•
90'
95
•
100
•
105'
Accumulation rates mm/a 0.02 0.05 0.1 0.2 0.5 1Plate 2. Accumulation rates in Qaidam and Hexi Corridor during six tinie int, ervals. Rates are
given
in mm yr-1 of solid
phase.
Quaternary
accumulation
rates in Gong
He basin
are given
for
comparison purposes. Present-day drainage (blue), and active faults (black dotted lines) serveas reference frame. Interpretation of fault propagation consistent with the model of NE Tibetan
834 MI•TIVIER ET AL.- NORTHEASTWARD GROWTH OF TIBET o 500 lOOO 15oo i i i -' ...•..'._• .'. .. . . : z• : : .:j,].. o..'.'....'.c>...: .. : z• : ... •4:'-.., ...'...'..:'.":.r• :: '' .. "..
H ...
(x) ...
:,-?--'-_-•'.c•.
"..•
:•."'1:..•."..•:' '.: :.' ' :.'.'
}'
RI*H(x)'.
•.' t•".
... .:-_--_•_•.. .'....;<b '..': o .' - -.,•_:_ • :':. :: :.•..: :•:::'.' ......
:•:•R2*H(x),'.
ß
'..'.' ?'"'
__hl__
_ R1 '•-•-'
- -"'• :.':•'
:':' :" :"
- h
I + h2
...
•.¾T_-:•
•_•_•.:...::..2....o...:.:
•
... ..<-_-•_-•_-:_ -_---•._:.•;h2 = R2
"•
...
_ - hl+ h2 i I 0 50 100 150 200:.'
hl(xO): .:...-'.'.ϥ':.:
- ,•..• ...'.'..•: "1::'
:.h
l:(?0)::/,h2(x0)
= H(x0)
-•h2(x0)• 7 _ i 250 300 500 1000 1500 500 lOOO 1500 (b) _.• D •D/2 • i • D/2 ! (c) i i i 200 250 300Boundary zone influenced by the two stratigraphic columns.
'. j c:,..'
: .'.". . •. .'.. : .,• ; .- .-
•.'• .:.::
• .'-:
•" .:.• :.'?..R•2(.x)*._H(x)
':
i ?'. ".:
':
•:-: •-_ •---_-_-_-•:T-_-:. R-2•(•-)•-•(x) i i i i i i 50 100 150 200 250 300 X-distance (km)Figure 5. (a) Two-dimensional reconstruction of two sedimentary layers from one isopach and one drill hole. (b) and (c) Same as in Figure 5a for one isopach and two drill holes, with smoothing
of transition zone. Variables are defined in text.
Oase grid. Eventually, after deriving the solid phase, the
mass accumulated at each grid point in the basin during
the six time intervals selected can be computed (Plate 2). The final mass balance including grain vo!umes,
mass, and linear accumulation rates for the Qaidam
basin and Hexi Corridor is shown in Table 5 with the
corresponding uncertainties.
The sedimentation pattern in the Qaidam basin (Plate 2) reveals several robust trends. The basin history can
MI•TIVIER ET AL.' NORTHEASTWARD GROWTtt OF TIBET 835
Table 5. Volume Balance and Average Accumulation Rates in Qaidam, Hexi Corridor, and Gong
He Basins
Time Period, Gong He, Gong He, He Xi, He Xi, Qaidam, Qaidam, Maxima,
Ma kin3 mm yr- 1 km3 mm yr- 1 km3 mm yr- 1 mm yr- 1
1.6 2,800 0.18 16,000 0.47 (0.06) 67,000 0.41 1.07 4- 400 4- 0.03 4- 12600 4- 0.36 (0.05) 4- 26,000 4- 0.16 4- 0.37 3.4 5.3 4,500 0.16 4- 2,700 4- 0.09 11.2 23.7 36.6 Total volume 2,600 + 400 2,000 4- 1000 25O 4- 100 22,750 4- 16,400 0.07 4- 0.03 0.01 4- 0.00 59,000 0.32 1.1 4- 22,000 4- 0.12 4- 0.32 146,000 0.74 1.59 4- 56,000 4- 0.29 4- 0.49 49,000 0.08 0.23 4- 20,000 4- 0.03 4- 0.07 53,000 0.04 0.11 4- 22,000 4- 0.02 4- 0.03 41,000 0.03 0.07 4- 16,000 4- 0.01 4- 0.02 415,000 4- 162,000
Volume of sediments accumulated in front of Qilian Shan reached maximum value during Quaternary, but this rise is coeval with a change in depositional surface area. Total volume accumulated therefore rises while local accumulation rates may decrease. Numbers in parentheses are accumulation rates derived using Quaternary depositional area. This example demonstrates usefulness of mass balance. Correlative uncertainties are given in second row for each time period.
onset of the Pliocene. Pre-Pliocene sedimentation rates
over most of the basin are less than 0.1 mm yr -•. Max- imum rates are <_ 0.5 mm yr- • in the west at the front
of the Kunlun Shan. After 5 Ma such rates rise ev-
erywhere above 0.1 mm yr- • with peak values as high
as 1.5 mm yr -• during the lower Pliocene. After the
lower Pliocene the maximum sedimentation rates de-
crease, and the surface of the depocenter is reduced
and located around the center of the basin (-• 93øE and 37øN). From the upper Pliocene to the Quaternary this
depocenter shifts southeastward. The maximum sedi- mentation rates rise again, although they do not reach the values attained in the lower Pliocene. Overall, since
the beginning of the Oligocene, when sedimentation re-
mained confined in the western part of the basin near
the Altyn Tagh fault zone, there seems to have been a
tendency for southeastward shifting of the depocenter.
In the Hexi corridor a clear rise in the sedimentation
rates also seems to occur in the P!iocene.
In terms of average
accumulation
rates in km 3 myr- •
over the entire basins (Figure 6 and Table 5), the sedi-mentation pattern in the Qaidam shows that the aver- age rates of accumulation rise during the middle-upper Miocene. Average rates are twice those of the Oligocene
(Figure 6 and Table 5). In the Qaidam basin a spectac-
ular increase, by nearly one order of magnitude, takes
place at the end of the Miocene (Table 5 and Figure 6)
ß Maximum accumulation occurs during the Pliocene. In the Hexi Corridor, maximum accumulation occurs during the Quaternary. The general trend of the aver-
age accumulation curves in the Qaidam and Hexi basins
(dotted lines on Figure 6) shows a shift in time (•tprop) of the onset of rapid accumulation rates (arrows on
Figure 6). The acceleration of accumulation in the
Hexi corridor postdates that in the Qaidam basin by
htprop '"-' 5 Myr.
4.2. Comparison With Regional Tectonics Integrating of our results with the regional mecha-
nism of deformation proposed by Meyer et al. [1998]
yields further insight into the coupling between sedi- mentation and tectonics. Sedimentation in elongated
depressions at the front of the Kunlun and Qilian moun-
tain ranges is consistent with flexural loading of the Qaidam and Gobi lithospheres, as required by large- scale thrusting of the ranges onto their foreland. East-
ward shift of the depocenters during the Tertiary sug-
gests eastward displacement of flexural loading of the Qaidam block by the Kunlun range. The eastward growth of thrusts from the Altyn Tagh fault that bor-
ders the basin to the west [Meyer et al., 1998] thus ap-
pears to be compatible with the observed evolution of
the sedimentation pattern in the Qaidam basin (Plate 2).
Curves displaying the accumulation rates in the Qai-
dam and Hexi basins (Figure 6) show that. maximum
sedimen;ation is diachronous. At present, the Hexi cor- ridor basin is a forela•,d flexural depression. Deposition is therefore controlled by thrusting of the Qilian Shah
over the Gobi platform. The sedimentary record thus
suggests that the onset of thrusting in the Qilian Shah
postdates that in the Kunlun Shah. This implies north- eastward propagation of crustal shortening and moun-
tain building, probably concurrent with propagation of
836
MI•TIVIER ET AL.- NORTHEASTWARD
GROWTH
OF TIBET
i i t i ... i"
4O
Age (Myr)
Figure 6. Average
accumulation
rates
integrated
over
entire
Qaidam
and Hexi basins.
Dot-
ted curves,
linking
mid points
of each
period,
show
general
trends
of accumulation
r•tes. The
Atprop
• 5 Myr shift
in inflexion
of Qaidam
and
Hexi
curves
as
indicated
by arrows
yields
rough
estimate
of propagation
time of deformation
from Kunlun
front to Qilian
Shan
thrust
front and
hence
the propagation
rate of Altyn
Tagh
fault. Maximum
accumulation
rates
in Qaidam
corre-
spond
to damming
and closure
of the basin,
inducing
extremely
rapid
accumulation
of sediments.
Note order
of magnitude
difference
between
accumulation
rates
in Qaidam
and in Hexi Corridor.
rate, indeed,
corresponds
to the approximate
length
of
the Altyn Tagh fault between
the Kunlun and Qilian
Shan divided
by Atprop
• 5 Myr (Plate 2 and Figure
The basinwide, approximately tenfold Pliocene in-
c?ease of the accumulation rates in the Qaidam corre-
sponds
to the establishment
of a vast lac:•strine
are•
[Balhd
et al., 1•9•86;'
Gu and Di, 1989]. This implies
that the river discharge
could
not'escape
the mountain-
surrounded
depression
but accumulated
to form a large
lake. Such a situation suggests
closure
of existing
drainage outlets and damming of the catchment. If theyield
carried
by the streams
remained
roughly
constant
at that time, this damming process must have led to very rapid infilling of the basin. The existence of rapid accumulation rates resulting in thick deposits topped
by remarkably smooth and flat surfaces is clear in the
field. Figure 7a for instance, shows the thick Quater-
nary
infill
of the
Gong
He
basin,
which
produced•.the
flat
topography shown in Figure 7b, while Plate 2 sliows theaccumulation
rates
in that basin
during
the Quaternary.
Overall,
our results
are thus
in agreement
with the
deformation
and growth
mechanism
proposed
by Meyer
[1991],
Meyer
et al. [1998]
(Figure
1) and Tapponnier
et
al. [1990]. They do not rule out alternative models that
would include diachronous deformation north of Tibet
[e.g.,
England
and"'Houseman,
1986],
but such
models
lack predictive
power concerning
topography,
erosion
and sedimention,
and deformation
chronology
at the
scale needed for a test by field mesurements. 4.3. Damming of the Catchments and
"Bathtub" Basin Infilling
The quantitative reconstruction performed allows us to address in greater detail problems such as the catch-
METIVIER ET AL.- NORTHEASTWARD GROWTH OF TIBET 837 Elevation = 3300 m.a.psl.. ;.. •'. ... ' ... ..,....'.. ... ".';s:"..;:.:'..:.:....•.•:.•..•,•_.•::;...• ... ..,.-•:... . ,, ß 4 ... --'--'i; .... , ;,.:,.: •;,:;.:;•;:;:½::• %.:.:. ....
...
:.;.;
*ii;i:i:;!:i'*;:..;;i*i:B;
...
;•-*•a•:$;s*•z4•:•:•;•::•:;•::•:g;$a•;•;•!::•4::::::•::•::•:; ... *:.:*::::::'* ... : ... ===================================== ... ...•:*•<•:•?*•'•'---•:...•a ;; ""•*•a*½;• ... ...a•****;•a$:,•-:--:a&-:;,:• © '•*½e,;5 ... *'/:•*:•:':" ... •-:' •>• ... .•::.--.-..._...•**..•..•,.,••:•.••:••••,., ß ..e' '•.•...._.,•:•,.,:.•,• -..;-? -*-•%•E•::*'•.':.:.::.::,-::::****:;,' ..•...••...•...•..,••.•.•••:::,:.•,:**•,•½•.:•:,:::,.,....,. ... ... ...:•::: ... ,,•:**•,;•***:,x,•,:,:½2½/.-..•*.,.•*:.:••p•-.•.•.•,•;•! ---•**-,.... ...-••-.•...-....-•...-..•-••--.•••• ... :• -- .... ;;;;B;;::-{;;...•:• ... ;ia,•y *" * ... ... ' ... ' •***'• ... .. ... --,:,:**:**-**: ,:,•:,:•:,•...:,. ... . ... .. .-.•;:•*• • •; %. e •;.: .•- :.:, •:•<•½ ...
l*igure 7. (a) Photograph taken (from SW looking to NE) of Huang He gorge south of Gong He basin (inset, Plate 1), showing large thickness of late Quaternary deposits. Note smooth flat surface of Copography above deposits. (b) Photo taken from above Huang He gorge, standing on
top of Quaternary sedimen• pile and showing remarkable flatness of topography induced by basin
838 MI•TIVIER ET AL' NORTHEASTWARD GROWTH OF TIBET
basin and the time needed to construct successive pla-
teaus by a combination of thrusting and basin infill-
ing. Several processes may have led to damming of the
Qaidam basin. The simplest one, depicted in Figure 1, is the rise of mountain ranges north of the basin on thrust ramps splaying from the Altyn Tagh fault. At a more detailed level, part of the deformation east of the Qaidam is accommodated by NW-SE right-lateral
faults such as the Haiyen and Wenquan faults [Plate 1 ; Gaudemer et al., 1995; Van der Woerd, 1998]. Dex-
tral movement along these faults accomodates counter-
clockwise rotations of crustal blocks induced by regional
N30øE shortening and by sinistral shear between the
Altyn Tagh, Kunlun, and Haiyuan faults [Gaudemer et al. 1995]. Pliocene slip on the Wenquan fault [Gaude- met et al., 1995] might have induced closure of the
Qaidam catchment, the resulting transpression and lat-
eral shift having recently created the subtle drainage divide between the Qaidam and the Gong He basin, a foreland flexural depression associated whith the uplift
of the Qinghai Nan Shah [Van der Woerd, 1998]. The
Wenquan fault has a total offset of ,-• 10-15 kin, and
block rotation kinematics imply that it moves at ,-• 3-
5 1Ilm yr -• [Gaudemer
et al., 1995]. Hence
inception
of motion on it might have occurred in the Pliocene,
roughly at the time when sediment deposition increased
markedly in the Qaidam. Prior to this, the Qaidam basin would have been connected to the Gong He basin and might have drained into the Huang He, which now
incises deeply into the sediments deposited in the south-
eastern part of that basin (Figure 7).
In short, the Qaidam basin might have been fed, prior to the late Miocene, by a river system collecting debris
eroded from the Kunlun range, then channeled eastward
through the Gong He plain to the Yellow River. Coeval uplift of the Qinghai Nan Shan ranges and right-lateral strike slip faulting along the Wenqan fault in the late Miocene would have led to the closure and rapid infilling of the basin.
Alternatively, the Kunlun rivers might have drained into the Tarira basin. Damming might then have oc- curred as a result of propagation of the Altyn Tagh fault and growth of both the Nan Qilian Shan north of
the basin and the Altun Shan NW of the basin. Fi-
nal damming might have been favored by the fact that the mountain ranges defining the northern and south-
ern border of the Qaidam grew with convergent trends
to meet at the southeastern tip of the basin, as depicted in Figures lc and ld.
Whatever the damming process, which may have in-
volved a combination of the above mechanisms, the ac-
cumulation of erosion products from the dammed upper catchment of the Qaidam drainage system subsequently
filled the basin, much like a bathtub (Figure 1) [Tap- ponnier et al. 1990; Meyer et al., 1998]. "Bathtub" in-
filling may help explain not only the late Miocene-early Pliocene rise, but also the upper Pliocene and Quater- nary decrease in accumulation rates. Infilling induces topographic rise of the basin base level. Thus the pro-
cess acts as its own moderator by a feedback mechanism
in which filling of a basin induces a diminution of the volume of rocks fed by erosion into it. Recall that, as
shown by numerous experimental studies and field mea-
surements [Milos, 1980; Slingerland et al., 1994], erosion
is, on a local scale, a highly dependent function of slope and, on a regional scale, dependent on the average ele-
vation of the drainage area above the base level [Ahnert, 1970; Pinet and Souriau, 1988]. Eventually, note that
this bathtub scenario is in excellent agreement with the
wide extension of lacustrine and deltaic facies that cover
most of the Qaidam basin during the late Miocene to
Pliocene periods [Chen and Bowler, 1986].
4.4. Uplift and Sedimentation Rates
One may ask further how much time bathtub infill- ing might take to raise the surface of the Qaidam catch-
ment (,-• 250,000
krn
2) to an average
elevation
compara-
ble to that of Tibet ,-• 4900 + 100 m iDefense Mapping Agency, 1992]. One must distinguish two types of uplift.In the mountain ranges surrounding the Qaidam basin,
topographic uplift resu'.ts from thrusting and folding.
Within the basin, infilling produces uplift of the depo-
sitional surface. Neither such_mountain uplift or basin
infill, commonly called uplift of rocks, however, is the
same as topographic uplift because of isostatic compen-
sation. Let Au/At be the rate of basin filling and let
C be the compensation ratio accounting for flexure and
isostasy; the resulting topographic uplift Ah/At is Ah Au
=C• (11)
At At
(7 varies between two end-members, local isostasy and flexural loading. Assuming local isostasy,
C = p"•
- pc
(12)
p,•
where p,• and pc are densities of mantle and crustal rocks, respectively. For usual values of 3300 and 2700
kg m -a,
C ,-• 0.18 (13)
In the case of a sedimentary infill, one must estimate the
infill in terms of either decompacted or fully compacted
rocks so that density remains constant with depth. Here
we use the mass equivalent, that is, compacted rocks or
solid phase volumes and thicknesses.
Assuming flexural loading of an infinitely rigid plate
(the flexural rigidity D
MI•TIVIER ET AL.' NORTHEASTWARD GROWTH OF TIBET 839
Between these two extremes, it is difficult to estimate
the value of C unless both rock and topographic uplift
are known. In that case (11) reduces to Ah
C- Au
(15)
where Ah and Au are the finite rock infill and topo- graphic uplift integrated over a time period At. Equa-
tion (15) is useful because it integrates local and re- gional (flexural) components and gives access to the
resulting compensation of uplift. In the case of NE Tibet, thrusting is mostly directed toward the norris-
east [Meyer et al., 1998], and uplift takes place rela-
tive to a regional base level that corresponds to the
elevation of the Gobi-Ala Shan Platibrm. The present-
day elevation of that platform is of the order of 1400
m [Defense Mapping Agency, 1992]. Strong sedimen-
tation in the Qaidam basin takes place at the end of the Miocene. The basin has remained a depositional area since the end of the Permian and thus has always
been a lowland relative to neighboring reliefs. Ranges
north of the Qaidam, such as the Sule Nan and Tang He Nan Shan, are currently rising fast, carbon dating
of deformed
terraces
suggest
rates of several
mm yr-1,
• Van der Woerd, 1998], which implies that they are onlya few million years old. Thus it is reasonable to assume
that the Qaidam basin was not higher than the Gobi- Ala Shan Platform at the beginning of the Pliocene, when increase in the sedimentation rates took place.
The elevation difference between the present-day Qai- dam and the Gobi is Ah -• 1300 m. Assuming that
this elevation difference was achieved since closure of
the Qaidam catchment • 5 Ma, -• 2700 m of solid infill
were necessary. This value corresponds to the volume of
Plio-Quaternary solid phase infill divided by the surface
of the basin (Tables i and 5). Using (15), we may thus
estimate directly the compensation ratio in the Qaidam
basin:
Cq - 1300/2700 • 0.48 (16)
This is more than twice the usual compensation ratio under local isostasy. Such a difference may be due either to the initial density of the sediments before compaction, which can be much less than the average crustal density of rocks, especially for rapidly accumu-
lating argillaceous sediments [e.g., Baldwin and Butler, 1985], or to the rigidity of the lithosphere beneath the
basin. Note that such a high compensation ratio is con-
sistent with seismic results indicating thinner crust un-
der the Qaidam thafi under the Qilian Shan [e.g., Wit- tlinger et al., 1996]. To raise farther the surface of the
Qaidam basin from its present-day elevation to 4900 m,
at the level of the plains south of the Kunlun [Defense Mapping Agency, 1992], a base level uplift by sediment
infilling of
Ahan • 2200 m
(17)
is needed. Using (11)and (16), the equivalent solid
phase infill required is
Ahfili
Au•n- C' --•4600m
(18)
From our mass balance we can derive the average solid
phase
infill rate (/xh,//xt) of the Qaidam
basin. Using
the total volume
accumulated
since
,-- 5 Ma (Table 5)
and dividing
it by the depositional
area (Table 1), we
obtain
Ah•
At • 0.5
mmyr
-•
(19)
Assuming, to a first order, such a rate to remain con-
stant, the time needed to fill the Qaidam basin up to the elevation of the Qangtang (4900 m) would be
Atfill-
AUfill
• At • 9 Myr (20)
The total time needed to form a 250,000 km • broad,
high plateau comprising the Qaidam basin and the ranges drained by its catchment also includes the pe-
riod since onset of tectonic thrusting. The volumet-
ric accumulation rates double between the early and
late Miocene around 11 Ma (Table 5). Thrusting had
been going on for at least 5 Myr before the sha•rp rise
in accumulation rate, since seismic sections show such
thrusting to postdate Oligocene deposition and predate
Pliocene deposition [Bally et al., 1986]. Mountain build-
ing south of the Qaidam thus probably started during the middle-upper Miocene, between 15 and 5 Ma, in keeping with the onset of volcanism south of the Kun-
lun [Tapponnier et al., 1990; Meyer, 1991; Meyer et al., 1998]. Hence the time required to transform the Qaidam and its mountain rims into a 250,000 km • broad
plateau is of the the order of
24 Myr • Atf • 14 Myr (21)
As uplift and thrusting propagate along with the A1- tyn Tagh fault, parallel building of small plateaus at different stages of their evolution may occur simultane-
ously (Figure 1). A new range and its foreland basin
may begin to form in the NE while older basins un- dergo damming to the SE, and yet farther SE, bathtub infilling of even older mountain-locked basins is near
completion. Given the northeastward propagation time
(Atprop
• 5 Myr) inferred
before
from the delay
in rapid
accumulation rate onset between the Qaidam and Hexi basins and the surface of the now internally drained part
of Qangtang
(• 725,000
km•), •pproximately
3 times
that of the Qaidam catchment, a rough first-order di- mensional analysis allows us to estimate the onset of north central Tibet's growth by schematically model-