HAL Id: hal-02118861
https://hal.uca.fr/hal-02118861
Submitted on 3 May 2019
HAL is a multi-disciplinary open access
archive for the deposit and dissemination of
sci-entific research documents, whether they are
pub-lished or not. The documents may come from
teaching and research institutions in France or
abroad, or from public or private research centers.
L’archive ouverte pluridisciplinaire HAL, est
destinée au dépôt et à la diffusion de documents
scientifiques de niveau recherche, publiés ou non,
émanant des établissements d’enseignement et de
recherche français ou étrangers, des laboratoires
publics ou privés.
Arching observation in three-dimensional trapdoor
problem with X-ray CT and discrete element method
Bastien Chevalier, Jun Otani
To cite this version:
Bastien Chevalier, Jun Otani. Arching observation in three-dimensional trapdoor problem with X-ray
CT and discrete element method. Soils and Foundations, Japanese Geotechnical Society, 2011, 51,
pp.459 - 469. �hal-02118861�
459
i) Visiting Scholar, X-Earth Center, Kumamoto University, Japan.
ii) Professor, X-Earth Center, Graduate School of Science and Technology, Kumamoto University, Japan (junotani@kumamoto-u.ac.jp).
The manuscript for this paper was received for review on February 22, 2010; approved on April 12, 2011.
Written discussions on this paper should be submitted before January 1, 2012 to the Japanese Geotechnical Society, 4-38-2, Sengoku, Bunkyo-ku, Tokyo 112-0011, Japan. Upon request the closing date may be extended one month.
459
Japanese Geotechnical Society
ARCHING OBSERVATION IN THREE-DIMENSIONAL TRAPDOOR
PROBLEM WITH X-RAY CT AND DISCRETE ELEMENT METHOD
BASTIENCHEVALIERi)and JUN OTANIii)
ABSTRACT
A comparative study of the trapdoor problem is proposed in this paper involving experimental model tests on one side and a Discrete Element Method modelling on the other side. Most of the past studies related to the arching eŠect and the trapdoor problem were performed under plane strain or axisymetric conditions. The observation of the arch-ing mechanisms is indeed simpliˆed under these special test conditions. In this paper, the trapdoor problem was simu-lated under three-dimensional testing conditions with a square-shaped trapdoor. The granular layers were made with monodisperse glass beads. The arching mechanisms were experimentally investigated with X-ray Computed Tomography. Based on the images obtained, the propagation in the granular layer of the disturbance due to the dis-placement of the trapdoor was monitored. On the other side, the intensity of the load transfers in the granular material was evaluated with a force measurement apparatus on the trapdoor. In parallel, a numerical analysis involving the Dis-crete Element Method was conducted to predict both the qualitative and the quantitative phenomena. The gradual lo-cal expansion of the granular layer due to trapdoor displacement and the load transfer amplitudes were very well reproduced. An agreement between the experimental and the numerical results was obtained for small displacements of the trapdoor (high load transfers) as well as for larger displacements of the trapdoor.
Key words: discrete element method, load transfer, three dimensions, trapdoor, X-ray CT (IGC: E5/E14)
INTRODUCTION
The arching eŠect is a universal phenomenon, which takes place in granular materials, among them being soils (Terzaghi, 1936). The arching mechanisms occurring in soils are the key point for determining the pressure ap-plied to buried works, like tunnels and excavations, and also for designing soil reinforcement structures, such as earth structures built on soils prone to any kind of subsi-dence due to soft soils or sinkholes. The arching mechan-isms have been widely studied by means of the trapdoor problem. The trapdoor problem consists of a layer of granular material laying on a support which is able to yield. The yielding part of the support is called the trdoor. As the trapdoor is moved, arching mechanisms ap-pear in the granular material in the vicinity of the bound-ary of the trapdoor. The trapdoor's motion can be either upward (passive mode) or downward (active mode). The present study focuses on the active mode. The load trans-fers resulting from arching mechanisms depend on many parameters of the structures where these mechanisms take place, namely, the height of the granular layer, the size of the trapdoor, the direction of the trapdoor's mo-tion (passive or active mode), the soil characteristics and so on.
The trapdoor problem has been investigated
ex-perimentally and theoretically by many researchers. Dewoolkar et al. (2007) listed the major experimental stu-dies on trapdoors with diŠerent testing conditions. Most of these studies were performed under plane strain (strip trapdoors) or axisymmetric conditions (circular trap-doors) (Terzaghi, 1936; Tanaka and Sakai, 1993; Vardoulakis et al., 1981; Dewoolkar et al., 2007). In parallel, trapdoors have also been studied with numerical methods such as Finite Element Methods and Discrete Element Methods (Koutsabeloulis and Gri‹ths, 1989; Tanaka and Sakai, 1993; Chevalier et al., 2009). Finally, based on experimental and numerical observations, many theoretical approaches have been developed for predict-ing the intensity of load transfers. Some are based on the friction of the whole yielding column of the granular material (Terzaghi, 1943; Handy, 1985), while others are linked to the theory of shear banding (Vardoulakis et al., 1981; Papamichos et al., 2001; Vardoulakis et al., 2004). Even if observations of trapdoor tests under plane strain conditions can be extended to non-plane strain conditions, it is important to note that most of the arch-ing phenomena occurrarch-ing in real geotechnical earth struc-tures correspond to non-plane strain conditions. The manifestations of the trapdoor eŠect in real works are very local in most cases, namely, sinkholes, tunnel face failures and piled embankments. Consequently,
ex-Photo 1. Picture of trapdoor apparatus
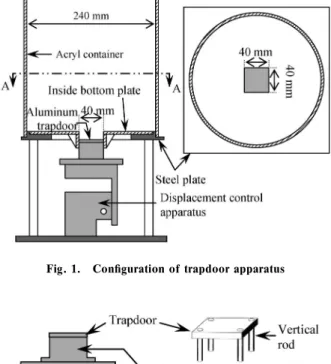
Fig. 1. Conˆguration of trapdoor apparatus
Fig. 2. Conˆguration of trapdoor
perimental studies on the trapdoor problem under non-plane strain conditions are very important. The di‹culty of observing the mechanisms occurring during trapdoor tests performed under conditions other than plane strain conditions is the reason why experimental trapdoor prob-lems in three dimensions have not been investigated. The challenging point is to observe the arching mechanisms despite the three-dimensional testing conditions.
In this study, experimental trapdoor tests for the active mode in three dimensions are conducted with a square-shaped trapdoor. The use of the X-ray Computed Tomography (CT) technique makes it possible to observe the arching mechanisms occurring as the trapdoor is moved downward, without altering the three-dimensional aspect of the tests. Glass beads are used to compose the granular layers tested. All the experimental results are compared with the numerical results obtained with the Discrete Element Method (DEM). It is noted that the ex-act conditions of the experimental tests are reproduced with the numerical model, namely, the model size, the characteristics of the granular materials and the testing process.
METHODS
Experimental Apparatus
An industrial X-ray CT scanning system (Otani et al., 2000, 2002) at Kumamoto University in Japan was used in this series of tests. Consequently, and in order to im-prove the CT results, an acryl cylindrical container was used to contain the granular layers. This container, shown in Photo 1 and Fig. 1, had an inside diameter of 240 mm and was supported by a horizontal steel plate un-der which the trapdoor displacement device was placed. The trapdoor hole, 40 mm×40 mm, was created in the acryl bottom plate and placed inside the container on the steel plate.
The trapdoor itself, shown in Fig. 2, was an aluminium alloy plate, 40×40 mm size in plan and 5 mm in thick-ness. It was equipped with a steel support located below by means of four parallel vertical steel rods with no play for the steel support. Finally, the steel support was ˆxed on the displacement control device. The displacement control device was a vertically extendable apparatus con-sisting of two blocks, moving one from the other with a rack. The rack was moved manually by a screw. The
value of the trapdoor displacement, d, was controlled
with a gauge inserted between the two blocks.
Consider-ingd=0 mm as the initial position of the trapdoor
(trap-door at the same level as the container bottom plate), the trapdoor was moved downward once following diŠerent
displacement steps, namely, d=0.1 mm, 1.0 mm, 2.0
mm, 5.0 mm, 10.0 mm and 20.0 mm.
Two kinds of experimental tests were distinguished. The ˆrst group of tests was dedicated to X-ray CT scan-ning for which details are given in the following para-graph, while the second group of tests was dedicated to the measurement of the force on the trapdoor in order to evaluate the load transfers occurring in the granular
lay-er. The force applied by the granular material on the trap-door was measured with one load cell located between the trapdoor and its steel support in a centred position, which is shown in Fig. 2. Four vertical rods were ˆxed under the trapdoor and made it slide vertically into the steel sup-port. The vertical rods kept the trapdoor parallel to its support and prevented all friction that could have
oc-Photo 2. Material of glass beads
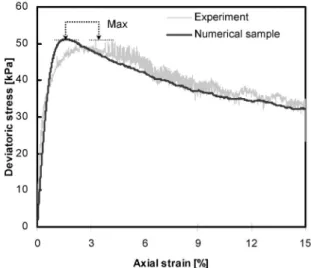
Fig. 3. Triaxial compression tests on glass beads and corresponding numerical modelling
curred between the trapdoor and the bottom plate of the container. The load cell had a force measurement ranging from 0 to 5 N, with an accuracy of 0.005 N. The force
was measured for each displacement stepd and, in order
to evaluate the repeatability of the tests, ˆve trapdoor tests were conducted under the same testing conditions. Granular Material
The granular layers were composed of glass beads, 6± 0.2 mm in diameter, as shown in Photo 2. This particle size distribution presented a fairly big particle size. In ad-dition, monodisperse samples of particles are usually prone to cristallysation in their arrangement; however, this study focused only on the comparison of the X-ray CT results on one side and the DEM results on the other
side. The density of these glass beads wasgg=2.52 g/cm3.
The minimal and the maximal void ratios were measured
as emin=0.562 and emax=0.661, respectively. Trapdoor
tests were performed on granular layers with a void ratio
equal toemin. The shear strength of the granular material
was the main parameter in‰uencing the arching eŠect in the trapdoor tests (Chevalier et al., 2009). Consequently,
peak and critical friction angles, fp and fr, of the glass
beads were determined for void ratioemincorresponding
to the test density in the triaxial compression tests. In order to limit the size of the triaxial compression test apparatus, 2-mm glass beads were tested instead of the 6-mm glass beads used in the trapdoor tests. However, both types of glass beads, 2 mm and 6 mm in diameter, are composed of one single particle size and have similar density ranges and material properties, so that it can be assumed that the shear strength characteristics obtained from the triaxial compression tests on the 2-mm glass
beads with a void ratio of e=emin=0.562 are similar to
those of the 6-mm glass beads under the same conditions of density. The triaxial compression tests were conducted under dry conditions with an initial conˆning pressure of
s3=25 kPa. This conˆning pressure was applied as a
depression of 25 kPa, compared to atmospheric pressure,
and produced in the sample with a vacuum pump.
Fric-tion angle values offp=309and fr=249were obtained.
The response of the glass bead samples to the triaxial compression tests is given in Fig. 3.
Before the trapdoor tests, the glass beads were placed in the container with successive layers of thickness, 20 mm each. The height of the glass bead samples was ˆnally equal to 80 mm. Due to the very narrow range in void ra-tio that characterized the glass beads used here, it is noted that no particular densifying method was needed for the sample.
X-Ray CT
An X-ray CT is a non-destructive method of investigat-ing the spatial distribution of the density in a material. In this process, a collimated X-ray beam crosses the speci-men in several directions by rotation and translation of the specimen. The intensity of the X-ray beams after the penetration of the specimen is computed in order to reconstruct an image of a section of the specimen. The image obtained gives the distribution of the density in the specimen by means of CT values. The CT value links the absorption coe‹cient of the X-ray beam for scanning
pointmtto that for water,mw, by the following relation:
CT value=(mt-mw)K/mw (1)
where K (K=1000) is a constant number. It can be
deduced from this relation that the CT value corre-sponding to air is -1000, since the absorption coe‹cient
for air is mt=0, while the CT value corresponding to
water is equal to 0. The relation between the CT value and the density of the material at the scanning point is linear, so that the CT value gives the distribution of the density of a specimen in the cross section. The X-ray CT system used here was equipped with 300 kV X-ray tubes (TOSCANER-23200 min TOSHIBA Corp., Kumamoto University, Japan).
After preparing the glass bead samples in the contain-er, the whole container was ˆxed on the turntable of the
Photo 3. Picture of sample placed in X-ray CT scanner
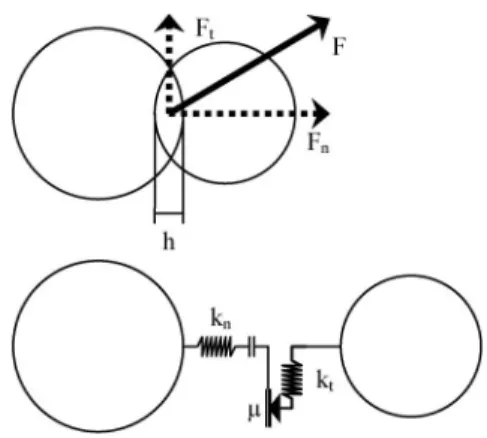
Fig. 4. Discrete element method contact laws
scanner, as shown in Photo 3. Then, the specimen was scanned with an X-ray beam with an attenuation width of 1 mm and in a limited region of interest in diameter, namely, 150 mm, in the central part of the container. The total number of voxels in each CT image obtained was 2048×2048, so that the size of a single voxel of the CT
image was equal to 73.2×73.2 (mm)2in plan and 1000mm
in height. The specimen was scanned in diŠerent states
corresponding to diŠerent displacement steps, namely,d
=0 mm (initial state), d=2 mm, d=5 mm and d=10 mm.
Discrete Element Method
The numerical modelling for the trapdoor problem was conducted with DEM based on molecular dynamics (Cundall and Strack, 1979). This method is used in three dimensions with a code called SDEC (Magnier and Donze, 1997) and considers the material as a collection of non-deformable bodies which interact with other bodies through their contact points. Obviously, the particles used here were spherical particles. The normal and tan-gential contact laws between particles were linear ones,
with normal stiŠness kn and tangential stiŠness kt. A
Coulomb friction criterion of coe‹cient m was used to
bind the intensity of the tangential contact force with respect to the normal contact force, as shown in Fig. 4. The mechanical parameters of the contacts were deter-mined by an inverse analysis in triaxial compression tests. The samples used for the triaxial compression and trap-door problem tests were prepared by in‰ating particles without any gravity force or friction (Chareyre and Vil-lard, 2005) in a cylindrical box until the target void ratio
ofe=emin=0.562 was reached. During this process, due
to the expansion of the particles, stress was applied on the wall by the in‰ated particles. This stress level was limited to a value close to the stress level observed in the sample before the trapdoor tests. Consequently, no change in the void ratio was observed as the gravity forces were ap-plied. More details on the DEM used herein can be ob-tained in the reference by Chevalier et al. (2009). Determination of the Model Parameters
In order to obtain an overlap between particles in the numerical method similar to the normal deformation of
the contact point in reality, normal stiŠnessknwas
deter-mined based on the stiŠness level,k (Combe, 2002). k is a
non-dimensional parameter that is inversely proportional to the de‰ection observed at the contact points. Thornton and Sun (1993) evaluated this coe‹cient for glass beads
as k=5600. In the DEM, with a linear normal contact
law, the stiŠness level of grains can be written (Combe, 2002) as
k=kn/(dP ) (5)
where kn is the normal stiŠness of the contact, d is the
mean diameter of the particles andP is the pressure level
applied to the particle sample. Considering the void ratio,
e=emin=0.562, the glass density, gg=2.52 g/cm3, and the
height of the granular layer,h=80 mm, the pressure level
applied to the particles during the tests was estimated at
aroundP=1.5 kPa. The normal stiŠness was then set to
kn=6×10⁴N/m which corresponds to k=6700. This
normal stiŠness guaranteed an overlap between the parti-cles in the modelling, not greater than in the experimental tests, even in some areas of concentrated stress.
The tangential stiŠness,kt, was deˆned as the ratio of
normal stiŠnesskn. Combe (2002) showed that
consider-ing a ratiokt/knbetween 0.5 and 1 does not in‰uence the
results of the modelling. In addition, Sch äafer et al. (1996)
recommended setting ratiokt/knto 0.75, which was
con-sidered in the study.
Friction coe‹cientm of the contact law between
parti-cles was determined by an inverse analysis in triaxial com-pression tests on 2-mm diameter spheres presenting a
void ratio ofe=emin=0.562 and a conˆning pressure of
25 kPa. All the other parameters, such as the particle size distribution, the void ratio, the normal stiŠness and the tangential stiŠness, were already set. The conˆning pres-sure in the triaxial compression tests was higher than the
stress level used to set the value ofkn. However, the peak
deviatoric stress used to set the coe‹cient, m, is not
in-‰uenced by the stiŠness level in the range considered here.
Friction coe‹cientm was set to m=tan (409), so that the
peak friction angle obtained with the numerical sample
was fp=309and the critical friction angle was fr=249.
The response of the numerical sample to the triaxial com-pression tests is shown in Fig. 3. All the model parameters could be set from the response of the samples in terms of stress only. The dilatancy behaviour of the
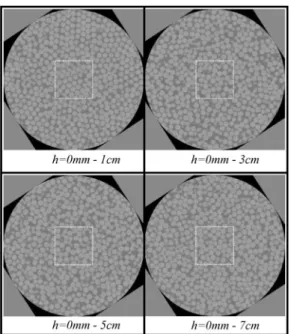
Fig. 5. Raw CT values images for initial state at diŠerent heights from bottom of container
Fig. 6. CT values obtained with 6 mm glass beads
sample in the triaxial compression tests was not used here.
In order to evaluate the dispersion of the results ob-tained with the numerical analysis, three-dimensional trapdoor tests were performed under the same testing conditions.
ANALYSIS OF CT IMAGES Binary Images
The conditions of the CT scanning gave a voxel size
e-qual to 73.2×73.2mm in plan and a height of 1000 mm.
Consequently, one single particle, 6 mm in diameter, is much bigger than the voxel size; one bead covers around 16,000 voxels. Particles could then be identiˆed on the CT images. A CT value, depending on the density at this point, is associated with each voxel. Each CT value is as-sociated with a grey value, and a total of 256 grey values are used to represent the distribution of density through-out the sample. Figure 5 shows the horizontal cross sec-tions obtained after scanning the sample in its initial state
ford=0 mm and at diŠerent heights, h, from the bottom
of the container. In our case, the specimen was made of glass beads and air; however the CT values obtained from all the cross sectional images corresponding to the initial state shown in Fig. 6, covered a much wider range than only the two single CT values corresponding to air with a CT value of -1000 and glass with an approximate CT value of 1520.
The tested samples were binary in their composition. At each point, the material is either air or glass. Conse-quently, a threshold CT value is determined to separate the voids from the glass beads. The CT image is made of 256 levels of gray, each one corresponding to a CT value
interval, called class. Each classi, i=s1, 2 ..., 256tis
as-sociated with a median CT value,CTi. Figure 6 shows the
number of voxels,ni, corresponding to each class,i. The
total volumeVtof the scanned volume can be calculated
by Vt=[ 256
S
i=1 ni (6)where[is the volume of one voxel.
Let k be the class corresponding to the threshold CT
value, namely,CTk. The volume of the glass,Vg, and the
volume of the air, Va, can be calculated.
Va(CTk)=[ k
S
i=1 ni (7) Vg(CTk)=[ 256S
i=k ni (8)Then, void ratioe, corresponding to threshold value CTk,
can be calculated as e(CTk)= Va(CTk) Vg(CTk) = k
S
i=1 ni 256S
i=k ni (9)The void ratio,e(CTk), was calculated for each classk
=s1, 2 ..., 256twith Eq. (9). Figure 7 shows the
evolu-tion of void ratioe depending on threshold CT value CTk.
Knowing the experimental value of the void ratio,e=emin
=0.562, the real threshold value, CTth, can be
deter-mined as shown in Fig. 7. The threshold CT value
corre-sponding to the void ratio, e=emin, is equal to CTth=
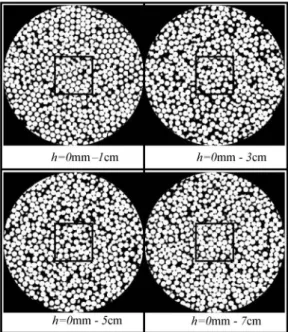
61.7. Using this threshold value, binary images of the horizontal cross sections of the sample are shown in Fig. 8 in which the black colour shows the air voids and the white colour shows the glass beads.
Comparing the Sample for DiŠerent Displacement Steps, d
Once binary images are obtained, the glass beads and the voids between them can be separated. The next step is to compare the sample in two diŠerent conˆgurations, each conˆguration corresponding to one value of the
dis-placement of the trapdoor,d.
Fig. 7. Void ratio e depending on threshold CT-value
Fig. 8. Binary images of sample in initial state obtained with threshold CT value of 61.7 at diŠerent heights from bottom of container
Fig. 9. Vertical cross section of compared conˆguration between d=0 mm and d=2 mm: a) raw compared conˆguration without erosion and b) compared conˆguration with erosion (vertical lines represent projection of trapdoor position)
Fig. 10. Illustration of erosion process
they cannot be singly identiˆed from one conˆguration to another. Consequently, the displacement of each glass bead could not be monitored. However, a comparison
process for two conˆgurations is used to diŠerentiate the areas of the sample where groups of beads are moving from the areas where beads remain ˆxed.
Initial conˆguration I and ˆnal conˆguration F are
compared. Let us call CI(x, y, z) (resp. CF(x, y, z)) the
colour values of the voxel located at the spatial coor-dinates (x, y, z) for the initial (resp. ˆnal) conˆguration. After the conversion of raw images into binary images, the conˆgurations are composed of voxels with two colour values only, namely, 0 (black) for voids and 255 (white) for glass beads. The colour value of the voxel
lo-cated at the coordinates (x, y, z), CR(x, y, z) of the
com-pared conˆguration, is calculated from CI and CF from
the following operation:
CR(x, y, z)=`CI(x, y, z)-CF(x, y, z)` (10)
where` ` represents the absolute value.
After this operation, the voxels aŠected by particle movement with colour changes from the initial conˆgura-tion to the ˆnal conˆguraconˆgura-tion are coloured in white. However, the resulting black voxels can correspond to either the areas with movement or the areas without movement. A vertical cross section of the compared
con-ˆguration corresponding to d=0 mm (CI) and to d=2
mm (CF) is given in Fig. 9(a) as an example. In order to
eliminate the small movements of the glass beads, due to the rotation and the translation of the sample during the scanning process, the compared conˆguration is eroded. In this process, each white area is reduced on its
bound-Fig. 11. Force on trapdoor versus trapdoor displacement d, for ex-perimental and numerical results
ary, as illustrated in Fig. 10. As a result, the smallest white areas that are not due to the trapdoor displacement are cancelled. The results of the erosion process are shown in Fig. 9(b).
In order to be able to compare the experimental results from the CT scanning to the numerical results from DEM, the same process of comparing conˆgurations is used with the DEM results.
Calculation of the Porosity
In addition, the conˆguration corresponding to each
displacement step,d, is analysed in terms of void ratio.
Void ratios are calculated in restricted parts of the sample from the number of voxels and the threshold CT values, as explained in Eq. (9).
COMPARISON OF X-RAY CT AND DEM RESULTS The arching phenomenon aŠects the redistribution of the forces occurring in the granular material. This eŠect is quantiˆed by measuring the force applied on the trap-door by the granular material during the tests. Arching also produces deformations in the granular layer, which are quantiˆed by the evolution of the movements in the granular layer which are displacements and also by the loosening of the granular layer. These two aspects of the trapdoor mechanisms, namely, force and deformation in the granular layer, are presented in this section.
Force Measurement
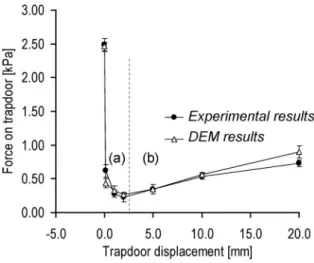
The evolution of the force on the trapdoor as the trap-door moved downward is given in Fig. 11 for the ex-perimental and the numerical results. The vertical error bars represent the standard deviation obtained at the measurement point for each series of tests conducted un-der similar conditions.
The evolution of force on the trapdoor is very similar for the experimental tests and the numerical analysis. The arching eŠect develops as soon as the trapdoor is moved. The arching eŠect results in the report of a part of the
load initially applied on the trapdoor, to the granular mass located in the vicinity of the trapdoor. Conse-quently, as soon as the trapdoor is moved downward
un-til d=0.1 mm, the force on the trapdoor decreases
sud-denly from its initial value due to the arching eŠect. A 75 z decrease in the experimental results and an 80z decrease in the numerical results are seen. The phase of force decrease continues until a trapdoor displacement of d=2.0 mm. The minimal force on the trapdoor is then very similar for both methods, namely, 0.22 N for the ex-perimental tests and 0.26 N for the numerical tests. Then, as the trapdoor displacement increases (dÀ2.0 mm), the force on the trapdoor starts to increase until the end of
the tests. For d=5.0 mm and d=10.0 mm, the
ex-perimental and the numerical results are very similar.
However, for d=20.0 mm, a diŠerence can be noticed
between the two results. The force on the trapdoor was smaller in the experimental tests than in the numerical analysis. This means that the load transfers due to the arching eŠect in the granular layer are stronger in the ex-perimental tests for the condition of a relatively large dis-placement.
Despite a slight diŠerence in behaviour between the ex-perimental and the numerical conditions for the phase of increase in force, the reproduction of the experimental conditions with the numerical analysis is satisfying, espe-cially considering the decrease in the phase of force. Until
the trapdoor displacement reaches the valued=10.0 mm,
the similarity in the results obtained with both methods is very good. The slight diŠerence between the numerical and the experimental results for the biggest displacement steps may be due to the method used to move the trap-door. In the experimental tests, the trapdoor was not re-ally moved at once, because of having to move the screw. The real eŠect of moving the screw is that the trapdoor displacement can be compared to a succession of small movements. In the modelling, the trapdoor is really moved downward. This means that from one time step to
the next (i.e., 5×10⁻⁶seconds later), the position of the
trapdoor changed. This reason may explain why the diŠerence occurred only at the end of the tests when the displacement increment is the biggest (an increment of 10
mm betweend=10 and d=20 mm).
Some models were proposed to evaluate the part of the load applied on the trapdoor. Among these, Papamichos et al. (2001) suggested that minimal pressure on the trap-door could be evaluated following a failure mechanism such as the one shown in Fig. 12(a) and extended to the three-dimensional square-shaped trapdoor shown in Fig.
12(b) and for which inclinationb is taken as being equal
tob=459-f/2, with f, the friction angle of the granular
material. A simple comparison was made between the minimal pressure predicted by Papamichos et al. (2001) and the results obtained with the trapdoor tests per-formed in this study.
The balance of vertical forces in the failure zone im-plies that the whole weight of the failure zone is transmit-ted to the trapdoor, namely, load transfer H between the failure zone and the remaining granular material is only
Fig. 12. Failure mechanism (a) proposed by Papamichos et al. (2001) for evaluation of minimal pressure on trapdoor in plane strain con-ditions and (b) extended to square-shaped trapdoor
Fig. 13. Deˆnition of cross sections
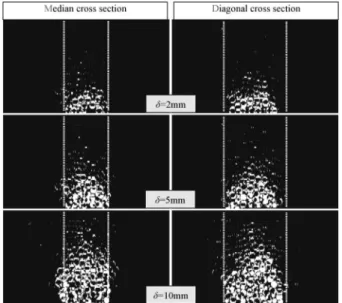
Fig. 14. Vertical cross sections of density change (from CT scanning) in median direction (left) and in diagonal direction (right) (vertical lines represent projection of trapdoor position)
Fig. 15. Vertical cross sections of displacements (from DEM) in medi-an direction (left) medi-and in diagonal direction (right) (vertical lines represent projection of trapdoor position)
horizontal. In the three-dimensional case, volume V of the failure zone can be calculated by the following equa-tion: V=B 3 2 tan
Ø
459- f 2»
, (11)whereB is the trapdoor width and f is the friction angle
of the granular material. Then, the minimal resulting
force on the trapdoor,Fmin, is
Fmin=
gB3
2 tan
Ø
459-f
2
»
, (12)whereg=2.52 g/cm3is the density of the granular
materi-al.
Considering the peak friction angle of the granular
material, Eq. (12) gives a value of minimal forceFmin=
0.29 N with a volume Vf=18.5 cm3. The value of the
predicted force is relatively close to the numerical and the experimental results. The real failure mechanism will be compared to the theoretical mechanism in the following section.
Particle Displacements
As the trapdoor is moved downward, the arching eŠect appears to redirect part of the weight of the granular material away from the trapdoor. A progressive release of vertical stress just above the trapdoor induces the rear-rangement of the granular material. The local rearrange-ment of particles creates an expansion zone above which arching can develop. This expansion process starts in the vicinity of the trapdoor at the bottom of the granular lay-er and propagates towards the top surface of the granular layer, as the trapdoor displacement increases. From now on, the volume or the area of the granular material that expanded due to the trapdoor displacement is called the ``expansion zone''. The compared conˆgurations (cf. Section ``Binary Images'') between two diŠerent dis-placement steps of the trapdoor are used to evaluate the propagation through the granular layer of the expansion zone due to the trapdoor displacement. Vertical cross sec-tions of samples in the median and the diagonal axes of the trapdoor, shown in Fig. 13, are given for the diŠerent displacement steps of the trapdoor in Fig. 14 for the ex-perimental results and Fig. 15 for the numerical results. The cross sections showed progress in the expansion zone from the bottom of the layer towards the ground surface. The comparison of the expansion zones obtained
with the experimental and the numerical results was quantitatively fairly good. For a large trapdoor displace-ment (d=10 mm), it has to be noted that in the median
Fig. 16. Horizontal cross sections of compared conˆguration (be-tween 0 mm and 10 mm) for experimental sample (a) and numerical sample (b) (square line represents position of trapdoor)
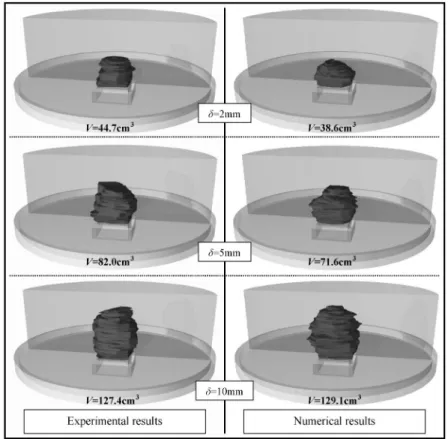
Fig. 17. Three-dimensional view of disturbed area for diŠerent displacement steps of trapdoor: experimental results (left) and numerical results (right)
axis cross sections, the expansion zone extended beyond the limit given by the trapdoor size, while it remained contained within the trapdoor size limit in the diagonal axis. As shown in Fig. 16, the horizontal cross sections of the expansion zone revealed a circular-shaped section despite the shape, even if the trapdoor was square.
In addition to the plane views, a three-dimensional reconstruction of the expansion zone was made using a s-eries of horizontal cross sectional images. The three-dimensional views are displayed in Fig. 17 and can calcu-late the volume of the granular material due to the arch-ing aŠected by the trapdoor displacement. The expansion zones extracted from the experimental results and from the numerical results are found to be very similar not only
in shape, but also in volume (see Fig. 17). This good
agreement can be obtained for all steps of the trapdoor
displacement values, namely,d=2,5 and 10 mm.
Considering the maximal load transfers in the granular
layer obtained for d=2 mm, the minimal force on the
trapdoor calculated with Eq. (12) was assumed to
cor-respond to a volume of granular material,Vf=18.5 cm3.
However, the volume of the expansion zone ford=2 mm
was equal to Vf=44.7 cm3 for the experimental tests.
Despite the relatively good prediction given by Eq. (12), the weight of the expansion zone obtained in the numeri-cal modelling was much larger than the force measured on the trapdoor. Therefore, the assumption of the horizontal direction of the load transfer between the ex-pansion zone and the remaining granular material is not veriˆed in the case presented here.
Loosening Mechanism
The void ratio of the sample was calculated for every horizontal cross section corresponding to a slice of the sample, 1 mm in thickness, from the white voxels corre-sponding to glass and the black voxels correcorre-sponding to
air (see Fig. 8). The loosening of the granular layer above
the trapdoor was evaluated from the distribution of void ratios for the sample in the height of the sample. In each horizontal cross section, the void ratio was calculated in an area corresponding to the circumcircle of the trapdoor represented in Fig. 16. Distributions of void ratio were calculated at each value of displacement for the trapdoor
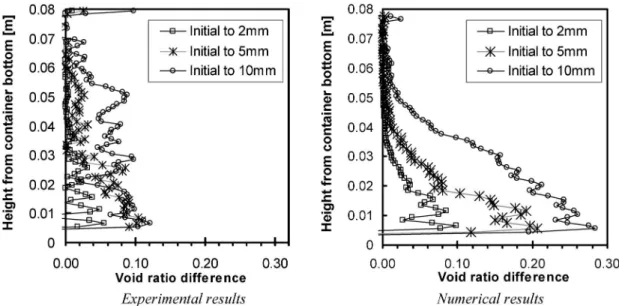
Fig. 18. DiŠerence of void ratios in granular layer above trapdoor between initial state and diŠerent displacement steps of trapdoor: experimental results (left) and numerical modelling (right) (distribution corresponding to numerical results is average distribution of three diŠerent tests)
(d=0, 2, 5 and 10 mm). Then, the initial state (d=0 mm) was subtracted from the following displacement step in order to obtain the loosening of the sample, called the ``void ratio diŠerence''. The vertical distribution of the diŠerence in void ratio in the height of the granular layer is given in Fig. 18.
The vertical distribution of the diŠerence in void ratios conˆrms the progressive vertical expansion of the dis-turbed area as the displacement of the trapdoor in-creased. However, a diŠerence in the loosening process can be noticed. In the experimental tests, the granular material progressively loosened until it reached the
max-imal void ratio of the glass beads,emax=0.652. The
diŠer-ence between maximal void ratioemaxand initial void
ra-tio of the sampleseminis equal to 0.10. Once the maximal
void ratio was reached, the disturbed area then extended higher in the granular layer. For the numerical modelling, the granular material constantly loosened as the trapdoor
displacement increased until a void ratio of e=emin+
0.30. Consequently, the loosening behaviour of the ex-perimental material and the discrete elements might present some diŠerence, due to the eŠect of dilatancy in the granular material.
CONCLUSIONS
A comparative study of the trapdoor problem under non-plane strain conditions, but in three dimensions, was conducted involving experimental tests and DEM model-ling. From the experimental point of view, an X-ray CT was used in order to observe the kinematics. The use of X-ray CT was very e‹cient for observing the local arch-ing phenomena occurrarch-ing in the layer of glass beads in three dimensions. A comparison of the diŠerent conˆgu-rations of the sample allowed the monitoring of the eŠect disturbance created by the displacement of the trapdoor. The local loosening of the sample could also be
calculat-ed. Besides these qualitative results, a force measurement apparatus was used to measure the intensity of the load transfers in the granular layer. In parallel, a numerical modelling of the experimental model test was developed using the Discrete Element Method. The numerical analy-sis reproduced exactly the tested material of the glass beads.
From a quantitative point of view, the intensities of the load transfers (force on the trapdoor) were very well reproduced by the numerical analysis. The ˆrst phase of force decrease was observed until a trapdoor displace-ment of 2 mm, followed by a phase of force increase. The repeatability of the tests was also very good, since only a very small dispersion in the results was obtained. As far as the arching mechanisms were concerned, the distur-bance due to trapdoor motion propagated in the granular layer, in the form of particle displacements, was precisely monitored in the experimental tests and very well repro-duced by the DEM analysis. The volumes of the dis-turbed areas of the granular layer were very similar for each of the displacement steps studied. Considering the loosening of the disturbed areas, a slight diŠerence in be-haviour between the numerical and the experimental results was obtained for larger displacement levels. In the numerical results, the granular material seemed to be able to loosen beyond the experimental maximal void ratio.
Now that the testing procedure for the non-plane strain conditions has been validated based on the use of an X-ray CT, attention will be focused on the eŠects of the size of the particles and the shape of the trapdoor on the arch-ing mechanisms. Furthermore, in order to extend the results of this study to the ˆeld of geomechanics, and thus, to real soils, other particle size distributions will be considered by mixing several particle sizes.
This research was conducted with a Grant-in-Aid from the Japanese Society for the Promotion of Science (JSPS 20.08818).
LIST OF NOTATIONS
CTi CT value of class i
CF(x, y, z) colour value of voxel located at coordinates (x, y, z) in
ˆ-nal conˆguration
CI(x, y, z) colour value of voxel located at coordinates (x, y, z) in
ini-tial conˆguration
CR(x, y, z) colour value of voxel located at coordinates (x, y, z) in
compared conˆguration d mean diameter of particles (m) e void ratio
emin minimal void ratio
emax maximal void ratio
F force on trapdoor (N) Fmin minimal force on trapdoor (N)
fn normal component of contact force between particles (N)
ft tangential component of contact force between particles
(N)
H load transfer force between failure zone and remaining part of layer (N)
kn normal stiŠness of contact between particles (N/m)
kt tangential stiŠness of contact between particles (N/m)
ni number of voxels in class i of CT value
P mean isotropic pressure in particle sample (Pa)
ut relative tangential displacement between two particles in
contact (m)
[ volume of single voxel (m3)
Va volume of air (m3)
Vg volume of glass beads (m3)
Vt total volume (glass beads and air) (m3)
b inclination with horizontal of failure zone for maximal load transfer phase (degree)
gg density of glass beads (g/cm3)
d trapdoor vertical displacement (mm)
e overlap distance between two particles in contact (m) k non-dimensional stiŠness level
m friction coe‹cient of contact between particles mt absorption coe‹cient of x-ray beam
mw absorption coe‹cient of x-ray beam for water
f friction angle (degree) fp peak friction angle (degree)
fr critical friction angle (degree)
REFERENCES
1) Chareyre, B. and Villard, P. (2005): Dynamic spar elements and DEM in two dimensions for the modelling of soil-inclusion
prob-lems, Journal of Engineering Mechanics, ASCE, 131(7), 689–698. 2) Chevalier, B., Combe, G. and Villard, P. (2009): Experimental and numerical study of the response of granular layer in the trap-door problem, Powders and Grains 2009: Proc. of the 6th Int. Conf. on Micromechanics of Granular Media, Springer, 649–652.
3) Combe, G. (2002): M áecanique des mat áeriaux granulaires et origines microscopiques de la d áeformation, Etudes et Recherches du Laboratoire Central des Ponts et Chauss áees.
4) Cundall, P. A. and Strack, O. D. L. (1979): A discrete numerical model for granular assemblies, G áeotechnique, 29, 47–65. 5) Dewoolkar, M. M., Santichaianant, S. and Ko, H-Y. (2007):
Cen-trifuge modelling of granular soil response over active circular trap-doors, Soils and Foundations, 47(5), 931–945.
6) Handy, R. L. (1985): The arch in soil arching, Journal of Geo-technical Engineering, 111(3), 302–318.
7) Koutsabeloulis, N. C. and Gri‹ths, D. V. (1989): Numerical modeling of the trap-door problem, G áeotechnique, 39(1), 77–89. 8) Magnier, S. A., and Donz áe, F. V. (1997): Discrete element project,
Technical report, Universit áe du Qu áebec-Montr áeal.
9) Otani, J., Mukunoki, T. and Obara, Y. (2000): Application of X-ray CT method for characterization of failure in soils, Soils and Foundations, 40(2), 111–118.
10) Otani, J., Mukunoki, T. and Obara, Y. (2002): Characterization of failure in sand under triaxial compression using an industrial X-ray CT scanner, Journal of Physical Modelling in Geotechnics, 1, 15–22.
11) Papamichos, E., Vardoulakis, I. and Heil, L. K. (2001): Overbur-den modelling over a compacting reservoir using a trdoor ap-paratus, Physic and Chemistry of Earth (A), 26(1–2), 69–74. 12) Sch äafer, S., Dippel, S. and Wolf, D. (1996): Forces schemes in
simulations of granular materials, Journal de physique I, 6(1), 5–20.
13) Tanaka, T. and Sakai, T. (1993): Progressive failure and scale eŠect of trap-door problems with granular materials, Soils and Founda-tions, 33(1), 11–22.
14) Terzaghi, K. (1936): Stress distribution in dry and saturated sand above a yielding trapdoor, Proceedings of International Confer-ence of Soil Mechanics, Cambridge University, 1, 307–311. 15) Terzaghi, K. (1943): Theoretical Soil Mechanics, New-York, John
Wiley and Sons.
16) Thornton, C. and Sun, G. (1993): Axisymetric compression of 3D polydisperse systems of spheres, Powders and Grains 93: Proc. of the 2nd Int. Conf. on Micromechanics of Granular Media, Balke-ma, 129–134.
17) Vardoulakis, I., Graf, B. and Gudehus, G. (1981): Trap-door prob-lem with dry sand: a statical approach based upon model test kinematics, International Journal for Numerical and Analytical Methods in Geomechanics, 5, 57–78.
18) Vardoulakis, I., Vairaktaris, E. and Papamichos, E. (2004): Subsi-dence diŠusion-convection: I. The direct problem, Computational Methods in Applied Mechanics and Engineering, 193, 2745–2760.