HAL Id: hal-00671224
https://hal.archives-ouvertes.fr/hal-00671224v2
Preprint submitted on 29 Nov 2012
HAL is a multi-disciplinary open access
archive for the deposit and dissemination of
sci-entific research documents, whether they are
pub-lished or not. The documents may come from
teaching and research institutions in France or
abroad, or from public or private research centers.
L’archive ouverte pluridisciplinaire HAL, est
destinée au dépôt et à la diffusion de documents
scientifiques de niveau recherche, publiés ou non,
émanant des établissements d’enseignement et de
recherche français ou étrangers, des laboratoires
publics ou privés.
The SL2S Galaxy-scale Gravitational Lens Sample. I.
The alignment of mass and light in massive early-type
galaxies at z=0.2-0.9
Raphael Gavazzi, Tommaso Treu, Philip Marshall, Florence Brault, Andrea
Ruff
To cite this version:
Raphael Gavazzi, Tommaso Treu, Philip Marshall, Florence Brault, Andrea Ruff. The SL2S
Galaxy-scale Gravitational Lens Sample. I. The alignment of mass and light in massive early-type galaxies at
z=0.2-0.9. 2012. �hal-00671224v2�
Preprint typeset using LATEX style emulateapj v. 11/26/04
THE SL2S GALAXY-SCALE GRAVITATIONAL LENS SAMPLE. I. THE ALIGNMENT OF MASS AND LIGHT IN MASSIVE EARLY-TYPE GALAXIES AT Z = 0.2 − 0.9
Rapha¨el Gavazzi1, Tommaso Treu2†, Philip J. Marshall3,4,2, Florence Brault1, and Andrea Ruff5
draft version November 29, 2012
ABSTRACT
We study the relative alignment of mass and light in a sample of 16 massive early-type galaxies at z = 0.2 − 0.9 that act as strong gravitational lenses. The sample was identified from deep multi-band images obtained as part of the Canada France Hawaii Telescope Legacy Survey as part of the Strong Lensing Legacy Survey (SL2S). Higher resolution follow-up imaging is available for a subset of 10 systems. We construct gravitational lens models and infer total enclosed mass, elongation, and position angle of the mass distribution. By comparison with the observed distribution of light
we infer that there is a substantial amount of external shear with mean value hγexti = 0.12 ± 0.05,
arising most likely from the environment of the SL2S lenses. In a companion paper, we combine these measurements with follow-up Keck spectroscopy to study the evolution of the stellar and dark matter content of early-type galaxies as a function of cosmic time.
Subject headings: galaxies: fundamental parameters — gravitational lensing: strong
1. INTRODUCTION
The last two decades have seen the emergence of a hi-erarchical model for the formation of structure in the universe. The main ingredients, dominating the overall dynamics of the universe, are non-relativistic particles that do not interact with light or baryons except through gravity (i.e., cold dark matter), and the mysterious dark energy (Perlmutter et al. 1999; Riess et al. 1998), i.e., a term in the stress-energy tensor of the universe character-ized by negative pressure (or equivalently a cosmological constant).
The familiar standard model particles move and in-teract with each other within this skeleton of unknown particles and fields (White & Rees 1978). Although stan-dard model particles represent only a small minority of the total energy budget of the universe (Komatsu et al. 2011), they play a crucial role in the formation of galax-ies, and their constituents stars and planets. In those overdense regions of the universe, interactions between standard model particles alter their dynamics and spa-tial distribution. Indirectly, through gravitational inter-actions, this so-called baryonic physics in turn modifies the properties of the underlying dark matter distribution (Blumenthal et al. 1986; Gnedin et al. 2004; Duffy et al. 2010). Understanding the interplay between baryons and dark matter at sub-galactic scales is crucial not only for any effort to understand how galaxies form and evolve, but also may shed light on the properties of the dark matter itself (e.g., self-interaction cross-section; Spergel & Steinhardt 2000; Loeb & Weiner 2011).
From an observational point of view, it is very chal-1Institut d’Astrophysique de Paris, UMR7095 CNRS –
Univer-sit´e Pierre et Marie Curie, 98bis bd Arago, F-75014 Paris, France
2Physics Department, University of California, Santa Barbara,
CA 93106, USA
3Department of Astrophysics, Oxford University, Denys
Wilkin-son Building, Keble Road, Oxford OX1 3RH, UK
4KIPAC, P.O. Box 20450, MS29, Stanford, CA 94309, USA 5School of Physics, Astrophysics, University of Melbourne,
Parkville 3010, Victoria, Australia
†Alfred P. Sloan Research Fellow
lenging to measure accurately the relative distribution of baryonic and dark matter on sub-galactic scales. By-and-large, traditional methods require the presence of a lumi-nous tracer (e.g., hot plasma, cold gas, or stars), whose kinematics are then interpreted to reconstruct the un-derlying gravitational potential (e.g., Saglia et al. 1992; Gerhard et al. 2001; Humphrey et al. 2006; Franx et al. 1994). Gravitational lensing (especially strong lensing at sub-galactic scales; Treu 2010) provides an additional
and powerful tool to shed light on dark matter. By
exploiting the deflection of light rays from background sources it need not rely on the presence of luminous trac-ers in the deflector. Furthermore, gravitational lensing is only sensitive to the total gravitational potential and therefore can provide accurate measurements of mass and mass distribution independent of its dynamical state or nature.
The combination of strong gravitational lensing with other diagnostic tools, such as stellar kinematics (e.g., Miralda-Escude 1995; Natarajan & Kneib 1996; Treu & Koopmans 2002, 2004; Koopmans & Treu 2003; Sand et al. 2004; Gavazzi 2005; Koopmans et al. 2006, 2009b;
Grillo et al. 2008; Czoske et al. 2008, 2012; Barnab`e
et al. 2009b,a, 2011; Sonnenfeld et al. 2012), weak lensing (Gavazzi et al. 2007; Lagattuta et al. 2010; Auger et al. 2010), stellar populations synthesis methods (e.g., Grillo et al. 2009; Auger et al. 2009, 2010; Thomas et al. 2011; Tortora et al. 2010; Treu et al. 2010; Spiniello et al. 2011, 2012), etc., is particularly effective. By breaking a num-ber of degeneracies inherent to each method alone one can give precise answers to a number of questions. What is the relative abundance of dark and luminous matter in the inner parts of galaxies? Are dark matter density profiles universal as those predicted by simulations? Are halos as triaxial as predicted by simulations? How much of the dark matter observed in galaxies is baryonic (i.e., low-mass stars and high-mass stars remnants) and how much is non-baryonic?
Until a few years ago, answers to these questions based on strong gravitational lensing where mostly limited by the small samples of known lenses. In fact, strong
lens-ing is a relatively rare phenomenon, and in general only ∼ 1/1000 background galaxy will have a massive fore-ground deflector sufficiently well aligned along the line of sight to produce multiple images (e.g., Turner et al. 1984; Schneider et al. 1992; Chae 2003). However, this situation is changing rapidly owing to the dedicated ef-forts of a number of groups in exploiting massive imag-ing and spectroscopic surveys such as the Sloan Lens ACS Survey (SLACS), the Boss Emission Lines Lens Survey (BELLS), the HST Archive Galaxy-scale Grav-itational Lens Survey, or the Strong Lensing Legacy Sur-vey (SL2S) to find samples of strong lenses (Browne et al. 2003; Bolton et al. 2006; Marshall et al. 2009; Treu et al. 2011; Brownstein et al. 2012). In the past few years, ded-icated searches using a variety of techniques and wave-lengths have delivered well over 200 galaxy-scale strong lenses.
1.1. The Strong Lensing Legacy Survey
The SL2S (Cabanac et al. 2007) is a dedicated effort to find strong lens systems in the Canada-France-Hawaii
Telescope Legacy Survey (CFHTLS)7with the goal of
an-swering fundamental questions about the distribution of mass and light. It consists of two main efforts: the group and cluster-scale survey (Limousin et al. 2009; More et al. 2012; Verdugo et al. 2011) and this present series that is concerned with the follow-up and analysis of the galaxy-scale sample (R. Gavazzi et al., in preparation).
The candidates are identified using the RingFinder algorithm which detects compact rings around centers
of isolated galaxies (. 1013M
), and works by
look-ing for blue features in excess of an early-type galax-ies (ETGs) smooth light distribution that are consistent with the presence of lensed arcs. After selecting a
sam-ple of bright (iAB ≤ 22.5) red galaxies in the redshift
range 0.1 ≤ z ≤ 0.8, a scaled, Point Spread Function (PSF) matched version of the i-band image was sub-tracted from the g-band image. The rescaling in this op-eration is performed such that the ETG light is efficiently removed, leaving only objects with a spectral energy dis-tribution different from that of the target galaxy. These typically blue residuals are then characterized with an object detector, and analyzed for their position, elliptic-ity, and orientation, and those with properties consistent with lensed arcs are kept as lens candidates. In prac-tice, we require the blue excess to be elongated (axis
ratio b/a < 1/2) and tangentially aligned (±25◦) with
respect to the center of the foreground potential deflec-tor. We also consider favorably multiple residual objects with similar colors. The objects are searched for within
an annulus of inner and outer radius 0.005 and 2.007,
respec-tively. The lower bound is chosen to discard fake residual coming from the unresolved inner structure of the deflec-tor, inaccurate PSFs, etc. The outer bound is chosen to limit the detection of the many singly imaged objects that only experience a modest amount of shear (see, R. Gavazzi et al., in preparation, for further details). A sample of several hundred good candidates was visually inspected and ranked for follow-up Hubble Space Tele-scope (HST) imaging and Very Large TeleTele-scope (VLT) or Keck spectroscopy. These observations are required 7 See http://www.cfht.hawaii.edu/Science/CFHLS/ and links
therein for a comprehensive description
to confirm the actual lensing nature of the systems and to allow accurate lens modeling. In practice, our selec-tion process finds about 2-3 lens candidates per square
degree. Extensive follow-up shows that the sample is
50%-60% pure (see, R. Gavazzi et al., in preparation). The SL2S galaxy-scale sample provides an ideal higher-z complement to the SLACS: the deflectors have similar distribution in size and velocity dispersion, but they have
a median redshift of ∼ 0.5 (cf. zd∼ 0.2 for SLACS),
ex-tending the baseline for evolutionary studies back to two thirds of the current age of the universe.
In this series we construct lens models for a pilot sam-ple of confirmed SL2S galaxy-scale lenses for which Keck spectroscopy is available, and interpret them by them-selves and in combination with stellar kinematics and stellar population synthesis models (Paper II; Ruff et al. 2011). This first paper presents lens models for 16 con-firmed systems as well as one candidate which proved impossible to model with simple gravitational potentials
and was therefore discarded as a strong lens.8 We use the
results of the lens modeling to discuss relative orientation of mass and light and their flattening. Following the ap-proach of many lens surveys before us (e.g., Bolton et al. 2006, 2008b; Treu et al. 2006; Koopmans et al. 2006), we carry out this pilot analysis using standard but relatively simple models, in order to provide an initial benchmark and to illustrate the quality of the data and the poten-tial of the survey. Specifically, the models presented here are based on singular isothermal elliptical potentials and simply parameterized sources. Using the Einstein radii presented here, the companion Paper II discusses the rel-ative abundance of mass and light and the evolution of the mass density profile by combining the SL2S, SLACS, and Lens Structure and Dynamics (LSD) samples. We are currently working to enlarge the sample substantially and gather more follow-up data. Future papers of this series will present the enlarged sample as well as more sophisticated lens models designed to exploit the richer dataset and sample size.
This paper is organized as follows. In Section 2 we introduce the CFHT and HST data used in the analy-sis. In Section 3 we describe our modeling techniques. Section 4 describes the lens models and presents our re-sults on the relative alignment of mass and light. A brief discussion of the properties of the lensed sources is also presented. Section 5 concludes with a brief summary.
Throughout this paper magnitudes are given in the AB system. We assume a concordance cosmology with
matter and dark energy density Ωm = 0.3, ΩΛ = 0.7,
and Hubble constant H0=70 km s−1Mpc−1.
2. OBSERVATIONS
2.1. CFHT Data
The CFHTLS consists of two main components of suf-ficient depth and image quality to be interesting for lens
searches9. Both are imaged in the u∗, g, r, i and z
bands with the 1 deg2 field-of-view Megacam Camera.
The multi epoch Deep Survey covers four pointing of
1 deg2 each. Two different image stacks were produced:
D-85 contains the 85% best seeing images whereas the 8 A successful measurement of the redshift of the blue arc-like
features might convince us to consider a more complex lens model.
D-25 only includes the 25% best seeing images. For finding lenses we only considered the better resolution stacks. In the T06 data release (Goranova et al. 2009)
10 used for this study they reach a typical depth of
u∗ ' 26.18, g =' 25.96, r ' 25.43, i ' 25.08, and
z ' 24.57 (80% completeness for point sources) with
typical FWHM PSFs of 0.0075, 0.0069, 0.0064, 0.0062 and 0.0061,
respectively. The Wide survey is a single epoch
imag-ing survey, coverimag-ing approximately 171 deg2in 4 patches
of the sky. It reaches a typical depth of u∗ ' 25.35,
g ' 25.47, r ' 24.83, i ' 24.48, and z ' 23.60 (AB mag of 80% completeness limit for point sources) with typical
FWHM PSFs of 0.0085, 0.0079, 0.0071, 0.0064 and 0.0068,
respec-tively. Owing to the greater survey solid angle, the Wide component is our main source of lens candidates.
Around each candidate lens and in each CFHTLS
band, we produce cutout images 101 pixels (i.e. 18.008)
wide. Nearby stars within 5 arcmin from a given lens are used to produce a PSF model. The 17 systems an-alyzed in this study are shown in Figures 1-4 and listed in Table 2.
2.2. HST Follow-up Imaging
In order to confirm the lensing hypothesis and allow for detailed lens modeling, 65 galaxy-scale lens candidates have been observed with the HST as snapshot programs during cycles 15, 16, 17 (GOs 10876, 11289, PI: J.-P. Kneib; GO 11588, PI: R. Gavazzi). The observations started with the Advanced Camera for Surveys (ACS), then switched to the Wide Field and Planetary Camera 2 (WFPC2) after the failure of ACS, and finally turned to the Wide Field Camera 3 (WFC3) after Servicing Mis-sion 4. Approximately, 50% of the lens candidates were confirmed as lenses in this way. A more comprehensive description of the efficiency of the SL2S lens finding strat-egy will be given by R. Gavazzi et al. (in preparation).
Ten of the galaxy-scale systems were observed with HST early enough to be included in our first Keck spec-troscopic follow-up campaign and are the subject of pa-pers I and II. The remaining systems will be presented at the end of our Keck and HST observing campaigns in the next papers of this series. Of these ten systems, three were observed in two bands, with ACS or WFC3 whereas the others were observed only in a single WFPC2 band as detailed in Table 1.
All the WFPC2 data were reduced using standard
MultiDrizzle11recipes. The cosmic ray removal worked
well because the 1200 s exposure time was split into three exposures. The “drizzling” was performed by preserv-ing the CCD frame orientation and pixel scale to avoid producing correlated noise. The ACS and WFC3 obser-vations consisted of single or double exposures only and therefore we relied on LA-Cosmic (van Dokkum 2001) on individual exposures for cosmic ray removal, before combining them with swarp (Bertin et al. 2002). As for WFPC2, images are kept in the natural CCD frame. Ex-posure times and final pixel scales are given in Table 1.
3. MODELING METHODOLOGY
10See http://terapix.iap.fr/cplt/T0006/T0006-doc.pdf 11
MultiDrizzle is a product of the Space Telescope Science Institute, which is operated by AURA for NASA (Koekemoer et al. 2002).
TABLE 1
Summary of HST observations.
name instrument/filter exp. time pixel scale (sec) (arcsec) SL2SJ021411−040502 ACS/F606W 400 0.05 ACS/F814W 800 0.05 SL2SJ021737−051329 ACS/F606W 400 0.05 ACS/F814W 800 0.05 SL2SJ022511−045433 WFPC2/F606W 1200 0.1 SL2SJ022610−042011 WFPC2/F606W 1200 0.1 SL2SJ022648−040610 WFPC2/F606W 1200 0.1 SL2SJ023251−040823 WFPC2/F606W 1200 0.1 SL2SJ140123+555705 WFPC2/F606W 1200 0.1 SL2SJ141137+565119 WFC3/F475X 720 0.04 WFC3/F600LP 720 0.04 SL2SJ221326−000946 WFPC2/F606W 1200 0.1 SL2SJ221407−180712 WFPC2/F606W 1200 0.1
In order to model the light distribution of a galaxy-scale gravitational lens, one has to disentangle the con-tribution of the foreground deflector and that of the back-ground lensed arc-like features. The former is generally a red ETG and the former a dimmer, blue, and pre-sumably star-forming, more distant source. The light distribution of an ETG generally has a regular shape
sufficiently well described by a S´ersic (Sersic 1968) or
even a de Vaucouleurs profile (de Vaucouleurs 1948) with very small color gradients. Blue background sources are
also well represented by Exponential profiles12 (Newton
et al. 2011). The separation of these two components is relatively straightforward for ETGs deflectors and they can generally be fitted independently for most applica-tions. However, very detailed investigations of the source properties of high signal-to-noise data might require a si-multaneous fit of both components (e.g., Marshall et al. 2007), especially with ground-based data (F. Brault et al., in preparation) and bright arcs. We describe our procedure to fit the foreground deflector in Section 3.1. In Section 3.2 we describe how we use the residual lensed images to model the gravitational potential of the deflec-tor and the intrinsic surface brightness of the source.
3.1. Foreground Deflector
We used the versatile galfit software (Peng et al. 2002) to perform the subtraction of the foreground de-flector as it allows to account for boxyness/diskyness of
isophotes. It generally yields good image subtraction
with a S´ersic profile (see Figure 1) but the recovered
S´ersic indices n and effective radii Reff are quite
degen-erate.
We thus used a generic S´ersic profile with more degrees
of freedom to get as good a deflector subtraction as possi-ble and we also applied a strong n = 4 prior to get a more
precise value of Reff. In the same vein, the fit of the n = 4
foreground lens also yields a robust measurement of el-lipticity and orientation of the light distribution. These values are reported in Table 2.
Fits are performed in all the available bands of a given
lens using 18.008 on a side cutout images and suitable
12 More complex models involving pixelated source will be
ex-plored in the next papers of this series with a large sample and complete HST follow-up (A. Sonnenfeld et al., in preparation).
PSF either inferred from the neighboring stars or from
TinyTim (Krist et al. 2011 )13 in the case of HST data.
The formal errors on each parameter are generally very small because they only account for statistical errors and not modeling errors associated with the mismatches be-tween the form of the assumed and observed light distri-bution. A more realistic estimate of the total uncertain-ties on the recovered ellipticity, orientation and effective radius can be made by estimating the filter-to-filter dis-persion on these parameters when HST data are missing. When HST imaging is available, shape parameters char-acterizing the deflector are more robustly measured and we adopt the formal errors from galfit.
3.2. Lensed Features and Mass Modeling
For lens modeling we used a dedicated code sl fit de-veloped for and tested on galaxy-scale strong lenses (e.g., Gavazzi et al. 2007, 2008, 2011; Tu et al. 2009). The code fits model parameters of simple analytic lensing poten-tials. It uses the full surface brightness distribution ob-served in the image plane and attempts to explain it with one or more simple analytic light components described by an exponential radial profile with elliptical shape (see, e.g., Marshall et al. 2007; Bolton et al. 2008a; Newton et al. 2011, for similar techniques).
The lensing potential is assumed to be made of a sin-gular isothermal ellipsoid (SIE), centered on the main
deflector. This is the simplest mass profile that has
been shown to yield a description of the mass distribu-tion of massive ETGs sufficient to derive Einstein radius, position angle, and ellipticity (e.g., Rusin et al. 2003; Rusin & Kochanek 2005; Koopmans et al. 2006; Gavazzi
et al. 2007; Koopmans et al. 2009a; Barnab`e et al. 2011).
The convergence profile of the central mass component is given by
κ(x, y) = b
2ξ, (1)
where the scaling parameter b is the Einstein radius REin
(e.g., Schneider et al. 1992; Kormann et al. 1994). b is re-lated to the velocity dispersion of the deflector through
b/100 = (σv/186.21 km s−1)2Dls/Ds, where Dls and Ds
are angular diameter distance between the lens and the source and between the observer and the source,
respec-tively. ξ2 = qx2 + y2/q is the radial coordinate that
accounts for the ellipsoidal symmetry of the isodensity contours and q is the minor-to-major axis ratio. The
orientation of the major axis P.A.tot is allowed to vary,
although this is not explicit in the definition of Equa-tion (1). We do not assume a priori that the orientaEqua-tion of the total mass distribution is correlated to that of the observed stellar component. In this way, the total poten-tial can capture (and mix because of substanpoten-tial degen-eracies) internal and external quadrupolar terms in the potential (Keeton et al. 1997). We also add an external shear parameter when more information is available (see the case of SL2SJ021737−051329 described below), suf-ficient to break the degeneracy between external shear and orientation of the galaxy potential.
As in the previous step, when we fitted the foreground light distribution, we weigh pixels with the image inverse
13http://www.stsci.edu/hst/observatory/focus/TinyTim
total variance (including sky, foreground, and lensed
fea-tures). The χ2term relating the observed light
distribu-tion I(xi) at pixel i and the intrinsic source light
distri-bution S(y) is thus:
χ2=X i [I(xi) − S(xi− α(xi|pp)|ps)] 2 σ2 i , (2)
where pp = [b, q, P.A.SIE] contains the parameters
that determine the gravitational potential and ps =
[xs, ys, qs, P.A.s, ms, rs] is the section of the parameter
space that describes the source light distribution, namely,
its center xs, its ellipticity qs, its orientation P.A.s, its
magnitude ms, and half-light radius rs.
The optimization of these nine parameters is performed using Monte Carlo Markov Chain techniques. Reported model parameters and confidence intervals are taken from the 0.50, 0.16, and 0.84 quantiles. However, be-cause of the simplicity of both the model potential and model source light distribution, we generally end up with very small formal errors on the recovered model parame-ters that should be substantially increased. Bolton et al.
(2008a) estimated that relative errors on REinshould be
about 5%. We thus add this dominant contribution in quadrature to the statistical errors in Table 2 and do the
same for the axis ratio qSIE by adding a ±0.07 absolute
error on consistent with Newton et al. (2011) and even more conservative than the ±0.05 error quoted by Bolton et al. (2008a).
4. RESULTS
In this section we describe the lens model of each sys-tem (Section 4.1). In addition, we study the shape and relative orientation of the light and total mass distri-butions as they do are independent of the source and deflector redshift (Section 4.2). Results depending on spectroscopic information (source and deflector redshifts and velocity dispersion) along with a novel method pro-posed to mitigate the nuisance due to the ignorance of the source redshift are presented in Paper II.
4.1. Notes on Individual Lens Models
For each lens in the sample we describe the resulting best-fit model.
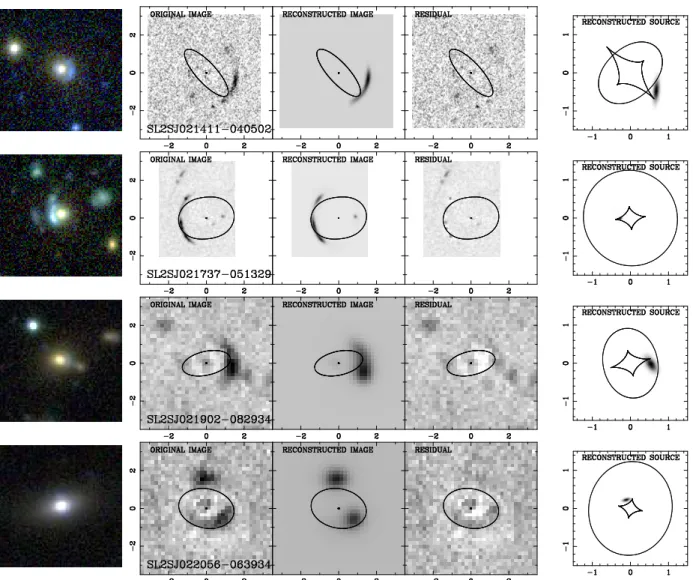
• SL2SJ021411−040502 can be reproduced by a sin-gle SIE potential + Exponential source model, lo-cated just outside the caustic. We note a small
axis ratio qSIE ∼ 0.33 this seems at odds with the
more circular light distribution q∗∼ 0.89. This can
be explained by the presence of a neighbor galaxy
at the same redshift as zdabout 800and P.A. ∼ 65◦
which enhances the elongation of the potential. An alternative solution with a slightly lower likelihood is found where the source is located just inside the caustic and the lensing configuration consists of three merging images (one of which is barely visi-ble in the HST image). This solution has a larger Einstein radius (by ∼30%), a slightly rounder po-tential, and a different position angle (elongation almost east–west). For the present study we adopt the solution with the highest likelihood although the secondary solution cannot be excluded com-pletely without deeper HST data.
Fig. 1.— Results of the lens modeling analysis. For each row, a system is shown with, from left to right, a 18.008 × 18.008 CFHTLS gri composite image of the system, the lensed features with the deflector subtracted off with galfit (data), the best-fit model prediction (model), the residual (data−model) and the associated source plane light distribution. The critical lines are overlaid in the first three panels whereas the caustics lines are shown in the last one.
• SL2SJ021737−051329 has been studied by in de-tail by Tu et al. (2009). Our results are in
agree-ment with theirs. A simple SIE + Exponential
source yields a good fit, even though a better fit is achieved by introducing both internal elliptic-ity through the SIE potential and external shear (consistent with the presence of a nearby group of galaxies). Similar conclusions were recently found by Cooray et al. (2011) using additional near-IR
CANDELS data. The source redshift is zs= 1.847
(Paper II). This implies that the source half-light
radius is Reff,s = 0.00081+0.028−0.016 ' 0.69
+0.24
−0.13kpc for
an F606W magnitude ms= 24.45 ± 0.10. The
sys-tem is lensing a second source at zs2 ∼ 2.3 that
we do not consider here for consistency with the other systems. However, regardless of whether the second source is modeled or not, the good signal-to-noise ratio and the favorable image configura-tion allows us to break the degeneracy between ex-ternal shear and inex-ternal ellipticity and we
there-fore get constraints on both. We find an
exter-nal shear γext = 0.064 ± 0.003 with an orientation
P.A.ext= 89.◦7 ± 0.◦4. We see that the light is well
aligned with the external shear and about ∼ 33 deg misaligned with the SIE component. The SIE mass component is found to have a rather circular
dis-tribution (qSIE = 0.91 ± 0.07, Table 2), we thus
do not consider this apparently strange behavior too seriously as some of the mass ellipticity (inter-nal quadrupole) could be exchanged with exter(inter-nal shear with a slightly different mass profile (Tu et al. 2009).
• SL2SJ021902−082934 is another ”cusp” configura-tion with a marginal candidate counter image on the opposite side. The lack of HST imaging im-plies that we had to consider the CFHT g-band image. We can see an additional source westward of the arc that has a color similar of the deflector and should not be considered as a lensed feature. Since we can achieve a good fit of the arc without introducing this perturbation we neglect it. • SL2SJ022056−063934 is a minor axis cusp
config-uration. The single source component does not
perfectly capture the faint tail of the inner arc al-though most of the flux is well recovered, even with
Fig. 2.— Lens models (continued).
ground-based resolution.
• SL2SJ022511−045433 is a low-redshift bright de-flector with another bright minor axis cups
config-uration. The source redshift is zs = 1.199
(Pa-per II). We report here the result with a single
source component of magnitude ms= 24.14 ± 0.04
in the F606W band and half-light radius Reff,s =
0.00125 ± 0.00003 ' 1.037 ± 0.025 kpc. Note that we
also attempted to account for the fainter exten-sion of the furthest arc (on the east of the de-flector), with a secondary component. This would even lower the residuals on the two multiple images without changing the results on the recovered po-tential parameters. Accounting for this component the source would be ∼ 0.36 mag brighter.
• SL2SJ022610−042011 is a typical large impact pa-rameter double configuration implying a substan-tial differensubstan-tial magnification of the two multiple images. In addition, these two are nearly aligned with the center of the deflector. This is consistent with the potential being close to circularly
sym-metric (qSIE ∼ 0.92). This system has a known
source redshift zs = 1.232. We can thus estimate
the source half-light radius Reff,s= 0.00160±0.00011 '
1.332 ± 0.092 kpc for an F606W magnitude ms =
25.10 ± 0.08.
• SL2SJ022648−040610 is another double configura-tion with a more balanced magnificaconfigura-tion ratio be-tween the two images involving a slightly more
elongated potential. We note that the deflector
looks like an edge-on S0 galaxy with an elongated light distribution. However, the total potential is considerably more circular.
• SL2SJ022648−090421 is also modeled using Mega-cam g band data and shows a minor axis cusp con-figuration with little deviation between light and SIE orientations. This is the faintest source we
re-construct with ms= 27.13 ± 0.14.
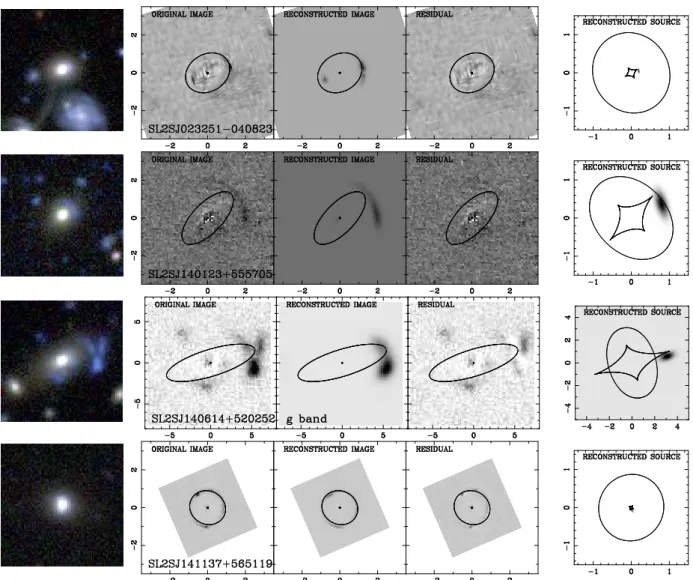
• SL2SJ023251−040823 is a double system with the source close to the cusp.
• SL2SJ140123+555705 shows a dim cusp-like arc. Even though we cannot identify the counterimage, the substantial bending of the arc breaks the degen-eracy between shear and intrinsic source ellipticity and allows us to measure the Einstein radius with
good accuracy REin= 1.0019 ± 0.0007, comparable to
Fig. 3.— Lens models (continued). Note the different plotting range for the third row corresponding to SL2SJ140614+520252.
• SL2SJ140614+520252 is another cusp
configura-tion on a larger scale, as REin= 3.0002 ± 0.0015. Some
blue light excesses are seen in the g-band image shown in Figure 3 and only the main “naked” cusp arc is captured by our model. However, we can see that the other western component is not multiply imaged as the source would fall outside the caustic. Thus, it does not provide more information and we verified that its inclusion does not change our con-clusions on the lensing potential. Even by ignoring this second singly imaged source component, we find that this system involves the brightest source
of the sample with g band ms= 23.50 ± 0.03. We
could not find a solution with a lensed source re-producing the southern and northeastern blue ex-cesses. The lens potential is highly elongated with
qSIE = 0.290 ± 0.015. This is probably due to the
additional contribution of a nearby galaxy about
8.003 in the southeast direction that corresponds to
the major axis of the already quite elongated light component.
• SL2SJ141137+565119 is the only system having WFC3 imaging presented here. The signal-to-noise ratio is good and allows us to get tight constraints on the potential and on the source whose redshift
is found to be zs = 1.420. The source half-light
radius in the F475X band is Reff,s = 0.000.058 ±
0.00001 ' 0.490 ± 0.008 kpc and its magnitude is
ms = 25.86 ± 0.04. We note that the addition of
a very compact core would improve the fit further as our single source component does not reproduce the full complexity of the source light distribution. Our best-fit model nevertheless captures most of the extended Einstein ring.
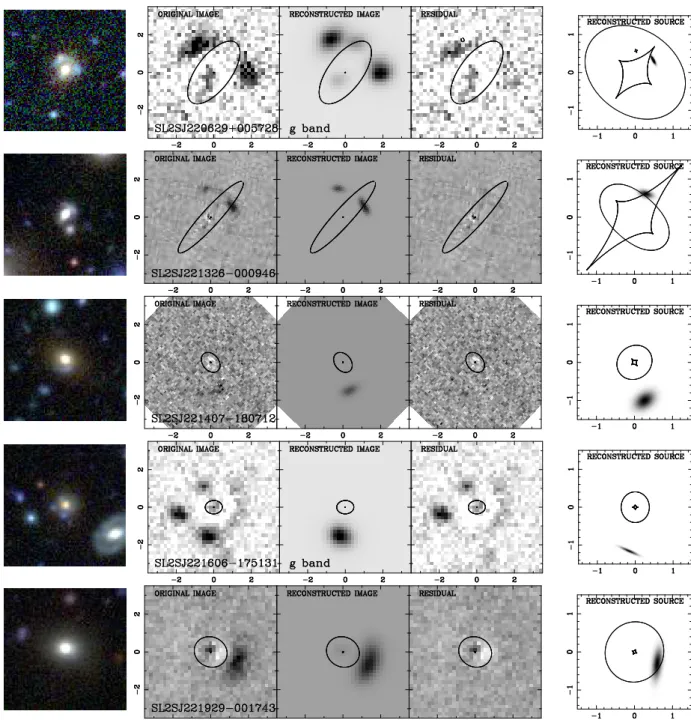
• SL2SJ220629+005728 is modeled using the g-band
Megacam image. However, we see in the color
cutout image that a small red satellite lies on top of the lensed blue features. We thus need to dis-entangle both contributions by simultaneously fit-ting to the g and i bands one lensed source and one foreground unlensed source centered in the red satellite. This satellite also contributes to the lens potential through a point mass component of un-known mass. We find that this perturbing mass has
to be Mpert≤ 2 × 10⁹M (68% CL). Getting HST
imaging data would significantly improve the accu-racy of the decomposition and the constraints on
Mpert. The Einstein radius estimate is robust with
respect to the inclusion (or not) of the perturbing potential.
Fig. 4.— Lens models (continued). Note that the system in the third row, SL2SJ221606-175131, is not a satisfying model of a lens and we disqualify it as being an actual gravitational lens.
• SL2SJ221326−000946 is an edge-on disk galaxy in which both the potential and the light distribution
are highly elongated: qSIE= 0.191±0.014 and q∗=
0.277 ± 0.007 with a small ∆P.A. ∼ 10.◦4 ± 0.◦6
misalignment.
• SL2SJ221407−180712 does not exhibit any coun-terimage nor a strong curvature of the main outer image. This implies that the model cannot be con-strained well and we can only place upper limits
on the Einstein radius REin = 0.0041 ± 0.0023. The
results on the potential elongation and orientation are thus very loose and we do not consider this sys-tem in the statistical analysis of Section 4.2. Note
that the small upper limit on REin is consistent
with other mass constraints in Paper II.
• SL2SJ221606−175131 has a relatively symmetric configuration. Its similarity to a classic quad con-figuration lead us to include it in the lens candidate sample. However, we could not find any sensible lens model able to reproduce in detail the image configuration. Therefore we cannot conclude that this system is a lens, or more precisely, that the
blue features about 100 from the center of the ETG
originate from a unique background source. We speculate that it could be due to low surface bright-ness star formation at the ETG’s redshift. We thus exclude this system from the statistical analysis be-low, although better imaging data would be useful to revisit this system by constructing more complex models of the source and potential.
Fig. 5.— Top panel: correlation between axis ratio of the light and of the mass distribution. Bottom panel: angular off-set between the major axis of the mass distribution and that of the light as a function of axis ratio of the mass distribution. SL2SJ021737−051329 is not included because this system was modeled including external shear.
• SL2SJ221929−001743 does not have HST imag-ing and the CFHT data do not allow us to con-straint tightly the potential parameters as we
can-not identify unambiguously a counterimage. In
addition, the arc does not display a strong cur-vature at the resolution of ground-based imaging. We thus get weaker constraints on the Einstein
radius REin = 0.0074 ± 0.0014 than for other
sys-tems. HST imaging would significantly improve
the mass model. Given the redshift of the source
zs = 1.023, we infer a source half-light radius
Reff,s= 0.00384+0.073−0.054' 3.03+0.59−0.43kpc and a g band
intrinsic magnitude ms= 24.08 ± 0.21.
4.2. Alignment of Mass and Light
The top panel of Figure 5 compares the ellipticity of the stellar component to that of the mass model. For the vast majority of the objects the ellipticities are tightly correlated. This is expected since stellar mass makes up a significant fraction of the total mass within the Ein-stein radius. However, there are few interesting outliers. The flattened light distribution of SL2SJ022648−040610 is consistent with a disky galaxy living in significantly rounder halo. Perhaps more surprising are the cases of SL2SJ021411−040502 and SL2SJ220629+005728, where the stars are almost round, while the potential is sig-nificantly flattened. In both cases the source of the el-lipticity of the mass distribution seems to be external shear, associated with a satellite. In general, the rela-tion between light and mass ellipticity seems to have sig-nificantly more scatter than that found for the SLACS
sample, hqSIE/q∗i = 0.95 with scatter 0.48, as opposed
to 0.99 with scatter 0.11 (Koopmans et al. 2006). As we discuss in the next paragraph this is probably due to a much more significant role played by external shear. The bottom panel of Figure 5 shows the angular offset between light and mass P.A. as a function of mass
ellip-ticity. Even neglecting the points with qSIE> 0.85, where
clearly the position angle is not very well measured since the potential is so circular, there is considerable scatter around zero. For the entire sample the rms scatter is 25
deg, while if we limit ourselves to qSIE< 0.85 the scatter
is still 18 deg. Again this is considerable higher than the
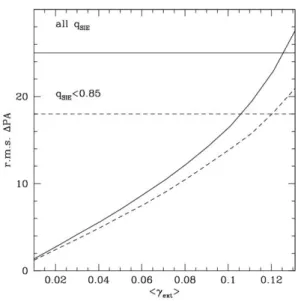
10 deg found for the SLACS sample (Koopmans et al. 2006) in general, and closer to the values found for the subset of SLACS lenses that reside in overdense environ-ments (Treu et al. 2009). A simple calculation, based on Equation (22) in the paper by Keeton et al. (1997) and assuming that the direction of external shear is ran-domly distributed with respect to that of the mass of the galaxies shows that this is consistent with a relatively large average external shear. This is illustrated in Fig-ure 6 where we show the expected rms fluctuation of the position angles as a function of average external shear. Regardless of whether the rounder objects are included
or not, it seems that external shear hγexti = 0.12±0.05 is
required on average. The mean and error on this quan-tity are estimated by propagating the sampling variance
associated with the measurement of the ±25◦ rms
dis-persion in the light-mass misalignment angle. The small sample size prevents us from further estimations like the scatter about this mean value which, in turn, will be addressed in a forthcoming paper (Sonnenfeld et al., in preparation). This level of external shear is fairly com-mon acom-mong galaxy-scale gravitational lenses (e.g., Kee-ton et al. 1997; Holder & Schechter 2003), and it is likely due to the environment of the lenses (Auger et al. 2007; Treu et al. 2009; Auger 2008; Wong et al. 2011), since massive ETGs typically reside at the centers of groups. The lower level of external shear in the SLACS sample,
hγexti . 0.035 (Koopmans et al. 2006), is most likely due
to the smaller size of their Einstein radius relative to the characteristic scale of the galaxy (half effective radius typically), and therefore the more relevant role played by stellar mass in defining the potential within the crit-ical curve. It is also possible that part of the observed misalignments between the light and the gravitational potential might arising from intrinsic misalignments be-tween the galaxy and its halo. This is also expected to be a larger effect in SL2S than in SLACS, owing to the larger size of the Einstein radius relative to the effective radius. We will explore this issue further in future papers of this series with a larger sample and better data.
Finally, we also note that, despite the likely greater in-fluence of the environment relative to SLACS, the SL2S lenses do not require as large a quadrupolar term as CLASS radio source or quasars (Keeton et al. 1997). This might be due to the fact that extended sources are not as sensitive to the magnification bias that would boost the
fraction of highly magnified quads. In turn, the only
unambiguous quad systems here are J141137+565119 and J021737−051329. Two out of 16 lenses (excluding J221606−175131) are quads.
5. SUMMARY
In this paper we presented gravitational lens models of a pilot sample of 16 galaxy-scale lenses identified as part of the SL2S Survey. HST imaging is available for 10/16 systems, while for the others the modeling is based on ground-based CFHTLS imaging. After removing the light from the foreground deflector we used the surface brightness distribution of the background source to
con-strain mass models of the deflector galaxy. For each
system we derived Einstein radius, position angle, and ellipticity of the mass distribution described as a SIE. These parameters are used in Paper II in combination with spectroscopic information to study the relative
dis-Fig. 6.— The curves represent the expected rms fluctuations of the offset in P.A. as a function of average external shear. The horizontal lines represent the values measured for the SL2S sample. The solid lines refer to the whole sample, while the dashed lines refer to the subsample with mass axis ratio qSIE< 0.85.
tribution of stellar and dark matter in ETGs and its evo-lution with cosmic time. In this paper we focused on the relative orientation and ellipticity of the luminous and total mass distribution, which does not require spectro-scopic information. We found that the ellipticity of mass and light are correlated except for three outliers. In one case the presence of a disk makes the light distribution significantly flatter than the overall mass distribution. In two cases, the presence of a nearby galaxy introduces sig-nificant external shear in the overall mass distribution. In addition, we found that the position angle of mass and light is on average aligned, albeit with rms scatter of 18-25 deg, significantly larger than what is found for the lower redshift SLAC sample. We interpreted this scatter as most likely due to substantial external shear, on
aver-age hγexti = 0.12 ± 0.05, resulting from the environment
(physically related to the main deflector galaxy or along the line of sight). The physical scale of the SL2S Einstein
radii is greater that for SLACS: REin/Reff ' 1.1 versus
0.5 for SLACS (Auger et al. 2010). In addition, we found only two quad lenses in this pilot sample, suggesting that magnification bias is less effective in boosting the statis-tics of extended lensed sources as compared with samples comprising point sources.
In Paper II we combine our lensing information with stellar kinematics to infer the cosmic evolution of the
mass density profile of massive galaxies. Given the sam-ple size in these first two papers of the series, the role of environment and external shear cannot be explored further, neither in terms of astrophysical signal, nor in terms of systematic uncertainty on the mass density slope. However, the follow-up imaging and spectroscopy of SL2S candidates are still ongoing and we plan to inves-tigate these issues with a much larger sample in future papers of this series. The parallel effort of measuring the redshift of sources with Keck and XShooter on VLT will also allow us to explore the population of lensed sources with greater detail.
We thank the anonymous referee for valuable
sugges-tions and a constructive report. R.G. and F.B. were
supported by the Centre National des Etudes Spatiales. P.J.M. was given support by the TABASGO foundation in the form of a research fellowship. T.T. acknowledges support from the NSF through CAREER award NSF-0642621, and from the Packard Foundation through a
Packard Fellowship. Based on observations obtained
with MegaPrime/MegaCam, a joint project of CFHT and CEA/DAPNIA, at the Canada–France–Hawaii Tele-scope (CFHT) which is operated by the National Re-search Council (NRC) of Canada, the Institut National des Sciences de l’Univers of the Centre National de la Recherche Scientifique (CNRS) of France, and the Uni-versity of Hawaii. This work is based in part on data products produced at TERAPIX and the Canadian As-tronomy Data Centre as part of the Canada–France– Hawaii Telescope Legacy Survey, a collaborative project of NRC and CNRS. This research is supported by NASA through Hubble Space Telescope programs GO-10876, GO-11289, GO-11588, and in part by the National Sci-ence Foundation under grant No. PHY99-07949, and is based on observations made with the NASA/ESA Hub-ble Space Telescope and obtained at the Space Telescope Science Institute, which is operated by the Association of Universities for Research in Astronomy, Inc., under NASA contract NAS 5-26555, and at the W.M. Keck Observatory, which is operated as a scientific partner-ship among the California Institute of Technology, the University of California, and the National Aeronautics and Space Administration. The Observatory was made possible by the generous financial support of the W.M. Keck Foundation. The authors wish to recognize and ac-knowledge the very significant cultural role and reverence that the summit of Mauna Kea has always had within the indigenous Hawaiian community. We are most fortunate to have the opportunity to conduct observations from this mountain.
REFERENCES Auger, M. W. 2008, MNRAS, 383, L40
Auger, M. W., Fassnacht, C. D., Abrahamse, A. L., Lubin, L. M., & Squires, G. K. 2007, AJ, 134, 668
Auger, M. W., Treu, T., Bolton, A. S., et al. 2009, ApJ, 705, 1099 Auger, M. W., Treu, T., Bolton, A. S., et al. 2010, ApJ, 724, 511 Barnab`e, M., Czoske, O., Koopmans, L. V. E., Treu, T., & Bolton,
A. S. 2011, MNRAS, 415, 2215
Barnab`e, M., Czoske, O., Koopmans, L. V. E., et al. 2009a, MNRAS, 399, 21
Barnab`e, M., Nipoti, C., Koopmans, L. V. E., Vegetti, S., & Ciotti, L. 2009b, MNRAS, 393, 1114
Bertin, E., Mellier, Y., Radovich, M., et al. 2002, in Astronomical Society of the Pacific Conference Series, Vol. 281, Astronomical Data Analysis Software and Systems XI, ed. D. A. Bohlender, D. Durand, & T. H. Handley, 228
Blumenthal, G. R., Faber, S. M., Flores, R., & Primack, J. R. 1986, ApJ, 301, 27
Bolton, A. S., Burles, S., Koopmans, L. V. E., et al. 2008a, ApJ, 682, 964
Bolton, A. S., Burles, S., Koopmans, L. V. E., Treu, T., & Moustakas, L. A. 2006, ApJ, 638, 703
Bolton, A. S., Treu, T., Koopmans, L. V. E., et al. 2008b, ApJ, 684, 248
Brownstein, J. R., Bolton, A. S., Schlegel, D. J., et al. 2012, ApJ, 744, 41
Cabanac, R. A., Alard, C., Dantel-Fort, M., et al. 2007, A&A, 461, 813
Chae, K. 2003, MNRAS, 346, 746
Cooray, A., Fu, H., Calanog, J., et al. 2011, ArXiv e-prints: 1110.3784
Czoske, O., Barnab`e, M., Koopmans, L. V. E., Treu, T., & Bolton, A. S. 2008, MNRAS, 384, 987
Czoske, O., Barnab`e, M., Koopmans, L. V. E., Treu, T., & Bolton, A. S. 2012, MNRAS, 419, 656
de Vaucouleurs, G. 1948, Annales d’Astrophysique, 11, 247 Duffy, A. R., Schaye, J., Kay, S. T., et al. 2010, MNRAS, 405, 2161 Franx, M., van Gorkom, J. H., & de Zeeuw, T. 1994, ApJ, 436, 642 Gavazzi, R. 2005, A&A, 443, 793
Gavazzi, R., Cooray, A., Conley, A., et al. 2011, ApJ, 738, 125 Gavazzi, R., Treu, T., Koopmans, L. V. E., et al. 2008, ApJ, 677,
1046
Gavazzi, R., Treu, T., Rhodes, J. D., et al. 2007, ApJ, 667, 176 Gerhard, O., Kronawitter, A., Saglia, R. P., & Bender, R. 2001,
AJ, 121, 1936
Gnedin, O. Y., Kravtsov, A. V., Klypin, A. A., & Nagai, D. 2004, ApJ, 616, 16
Goranova, Y., Hudelot, P., Magnard, F., et al. 2009, The CFHTLS T0006 Release, Tech. rep., Terapix – Institut d’Astrophysique de Paris, http://terapix.iap.fr/cplt/T0006/T0006-doc.pdf Grillo, C., Gobat, R., Lombardi, M., & Rosati, P. 2009, A&A, 501,
461
Grillo, C., Gobat, R., Rosati, P., & Lombardi, M. 2008, A&A, 477, L25
Holder, G. P. & Schechter, P. L. 2003, ApJ, 589, 688
Humphrey, P. J., Buote, D. A., Gastaldello, F., et al. 2006, ApJ, 646, 899
Keeton, C. R., Kochanek, C. S., & Seljak, U. 1997, ApJ, 482, 604 Koekemoer, A. M., Fruchter, A. S., Hook, R. N., & Hack, W. 2002, in The 2002 HST Calibration Workshop : Hubble after the Installation of the ACS and the NICMOS Cooling System, ed. S. Arribas, A. Koekemoer, & B. Whitmore, p337
Komatsu, E., Smith, K. M., Dunkley, J., et al. 2011, ApJS, 192, 18
Koopmans, L. V. E., Barnabe, M., Bolton, A., et al. 2009a, Astronomy, 2010, 159
Koopmans, L. V. E., Bolton, A., Treu, T., et al. 2009b, ApJ, 703, L51
Koopmans, L. V. E. & Treu, T. 2003, ApJ, 583, 606
Koopmans, L. V. E., Treu, T., Bolton, A. S., Burles, S., & Moustakas, L. A. 2006, ApJ, 649, 599
Kormann, R., Schneider, P., & Bartelmann, M. 1994, A&A, 284, 285
Krist, J. E., Hook, R. N., & Stoehr, F. 2011 in (SPIE, Optical Modeling and Performance Predictions V), 81270J
Lagattuta, D. J., Fassnacht, C. D., Auger, M. W., et al. 2010, ApJ, 716, 1579
Limousin, M., Cabanac, R., Gavazzi, R., et al. 2009, A&A, 502, 445
Loeb, A. & Weiner, N. 2011, Physical Review Letters, 106, 171302 Marshall, P. J., Hogg, D. W., Moustakas, L. A., et al. 2009, ApJ,
694, 924
Marshall, P. J. et al. 2007, ApJ, 671, 1196 Miralda-Escude, J. 1995, ApJ, 438, 514
More, A., Cabanac, R., More, S., et al. 2012, ApJ, 749, 38 Natarajan, P. & Kneib, J.-P. 1996, MNRAS, 283, 1031
Newton, E. R., Marshall, P. J., Treu, T., et al. 2011, ApJ, 734, 104 Peng, C. Y., Ho, L. C., Impey, C. D., & Rix, H.-W. 2002, AJ, 124,
266
Perlmutter, S., Aldering, G., Goldhaber, G., et al. 1999, ApJ, 517, 565
Riess, A. G., Filippenko, A. V., Challis, P., et al. 1998, AJ, 116, 1009
Ruff, A. J., Gavazzi, R., Marshall, P. J., et al. 2011, ApJ, 727, 96 Rusin, D. & Kochanek, C. S. 2005, ApJ, 623, 666
Rusin, D., Kochanek, C. S., & Keeton, C. R. 2003, ApJ, 595, 29 Saglia, R. P., Bertin, G., & Stiavelli, M. 1992, ApJ, 384, 433 Sand, D. J., Treu, T., Smith, G. P., & Ellis, R. S. 2004, ApJ, 604,
88
Schneider, P., Ehlers, J., & Falco, E. E. 1992, Gravitational Lenses (Springer-Verlag Berlin Heidelberg New York)
Sersic, J. L. 1968, Atlas de galaxias australes (Cordoba, Argentina: Observatorio Astronomico)
Sonnenfeld, A., Treu, T., Gavazzi, R., et al. 2012, ApJ, 752, 163 Spergel, D. N. & Steinhardt, P. J. 2000, Physical Review Letters,
84, 3760
Spiniello, C., Koopmans, L. V. E., Trager, S. C., Czoske, O., & Treu, T. 2011, MNRAS, 417, 3000
Spiniello, C., Trager, S. C., Koopmans, L. V. E., & Chen, Y. P. 2012, ApJ, 753, L32
Thomas, J., Saglia, R. P., Bender, R., et al. 2011, MNRAS, 415, 545
Tortora, C., Napolitano, N. R., Romanowsky, A. J., & Jetzer, P. 2010, ApJ, 721, L1
Treu, T. 2010, ARA&A, 48, 87
Treu, T., Auger, M. W., Koopmans, L. V. E., et al. 2010, ApJ, 709, 1195
Treu, T., Dutton, A. A., Auger, M. W., et al. 2011, MNRAS, 417, 1601
Treu, T., Gavazzi, R., Gorecki, A., et al. 2009, ApJ, 690, 670 Treu, T., Koopmans, L. V., Bolton, A. S., Burles, S., & Moustakas,
L. A. 2006, ApJ, 640, 662
Treu, T. & Koopmans, L. V. E. 2002, ApJ, 575, 87 Treu, T. & Koopmans, L. V. E. 2004, ApJ, 611, 739
Tu, H., Gavazzi, R., Limousin, M., et al. 2009, A&A, 501, 475 Turner, E. L., Ostriker, J. P., & Gott, III, J. R. 1984, ApJ, 284, 1 van Dokkum, P. G. 2001, PASP, 113, 1420
Verdugo, T., Motta, V., Mu˜noz, R. P., et al. 2011, A&A, 527, A124 White, S. D. M. & Rees, M. J. 1978, MNRAS, 183, 341
Wong, K. C., Keeton, C. R., Williams, K. A., Momcheva, I. G., & Zabludoff, A. I. 2011, ApJ, 726, 84
T AB LE 2 Summar y of key o bser v ables. name zd m i input REff REin qSIE P .A .SIE q∗ P .A .∗ source mag (AB) (arcsec) (arcsec) SL2SJ021411 − 040502 0.609 18.78 A CS/F60 6W 0 .94 ± 0 .05 0 .92 ± 0 .07 0 .33 ± 0 .08 42 .3 ± 1 .3 0 .89 ± 0 .02 53 .6 ± 4 .0 24 .30 ± 0 .12 SL2SJ021737 − 051329 0.646 19.47 A CS/F606 W 0 .77 ± 0 .04 1 .27 ± 0 .06 0 .91 ± 0 .07 124 .3 ± 2 .4 0 .92 ± 0 .02 91 .2 ± 4 .5 24 .45 ± 0 .10 SL2SJ021902 − 082934 0.390 19.33 Megacam/g 0 .90 ± 0 .08 0 .92 ± 0 .06 0 .53 ± 0 .09 102 .0 ± 4 .1 0 .73 ± 0 .01 79 .7 ± 1 .0 25 .35 ± 0 .19 SL2SJ022056 − 063934 0.330 18 .3 5 Megacam/g 1 .47 ± 0 .04 1 .25 ± 0 .06 0 .73 ± 0 .07 76 .6 ± 2 .1 0 .57 ± 0 .01 105 .0 ± 0 .5 25 .74 ± 0 .09 SL2SJ022511 − 045433 0.238 16 .8 4 WFPC2/F606W 1 .90 ± 0 .09 1 .77 ± 0 .09 0 .58 ± 0 .07 26 .3 ± 0 .2 0 .75 ± 0 .01 2 6 .0 ± 0 .7 24 .14 ± 0 .04 SL2SJ022610 − 042011 0.494 18.78 WFPC2/F606W 0 .56 ± 0 .03 1 .15 ± 0 .06 0 .92 ± 0 .08 5 .3 ± 10 .9 0 .83 ± 0 .01 5 6 .2 ± 1 .2 2 5 .10 ± 0 .08 SL2SJ022648 − 040610 0.766 20.01 WFPC2/F606W 1 .20 ± 0 .06 1 .31 ± 0 .07 0 .82 ± 0 .07 112 .1 ± 5 .2 0 .34 ± 0 .01 131 .8 ± 0 .6 26 .17 ± 0 .09 SL2SJ022648 − 090421 0.456 18.32 Megacam/g 1 .30 ± 0 .04 1 .58 ± 0 .09 0 .83 ± 0 .08 6 8 .1 ± 4 .2 0 .81 ± 0 .01 61 .6 ± 0 .9 27 .13 ± 0 .14 SL2SJ023251 − 040823 0.352 18.58 WF PC2/F606W 0 .81 ± 0 .04 1 .10 ± 0 .06 0 .80 ± 0 .07 122 .0 ± 0 .8 0 .68 ± 0 .01 110 .2 ± 0 .8 26 .39 ± 0 .08 SL2SJ140123+5557 05 0.526 19.14 WFPC2/F606W 0 .76 ± 0 .04 1 .19 ± 0 .07 0 .49 ± 0 .08 126 .7 ± 6 .5 0 .73 ± 0 .01 136 .0 ± 1 .1 25 .19 ± 0 .17 SL2SJ140614+5202 52 0.480 18.29 Megacam/g 2 .15 ± 0 .16 3 .02 ± 0 .15 0 .29 ± 0 .07 107 .2 ± 0 .1 0 .48 ± 0 .01 120 .4 ± 0 .6 23 .50 ± 0 .03 SL2SJ141137+5651 19 0.322 18.49 WF C3/F475X 0 .76 ± 0 .04 0 .92 ± 0 .05 0 .90 ± 0 .07 61 .4 ± 0 .3 0 .88 ± 0 .01 17 .7 ± 1 .4 25 .86 ± 0 .04 SL2SJ220629+0057 28 0.704 20.59 Megacam/g 2 .25 ± 0 .24 1 .34 ± 0 .07 0 .46 ± 0 .07 143 .3 ± 0 .2 0 .99 ± 0 .02 108 .8 ± 5 .1 25 .81 ± 0 .08 SL2SJ221326 − 000946 0.338 20 .0 0 WFPC2/F606W 0 .41 ± 0 .02 1 .08 ± 0 .05 0 .19 ± 0 .07 138 .0 ± 0 .5 0 .28 ± 0 .01 148 .4 ± 0 .6 25 .14 ± 0 .04 SL2SJ221407 − 180712 0.650 20.43 WFPC2/F606W 0 .57 ± 0 .03 0 .41 ± 0 .23 0 .69 ± 0 .16 62 .3 ± 46 .9 0 .73 ± 0 .01 5 7 .5 ± 0 .8 2 5 .29 ± 0 .32 SL2SJ221606 − 175131 0.860 20.68 Megacam/g 0 .93 ± 0 .08 – – – 0 .87 ± 0 .01 5 7 .4 ± 3 .1 2 5 .67 ± 0 .07 SL2SJ221929 − 001743 0.289 17.78 Megacam/g 1 .00 ± 0 .03 0 .74 ± 0 .14 0 .75 ± 0 .16 85 .3 ± 35 .5 0 .74 ± 0 .01 84 .3 ± 0 .6 24 .08 ± 0 .21 Note . — Effectiv e radii and asso ciated errors are estimated from the mean and standard deviation of a galfit de V aucou leurs fit in eac h of the r , i, and z Megacam bands when HST imaging is not a v ailable. When one or more HST bands are a v a ilable, Reff is measured on the reddest one (See table 1) but the error is still obtained from the Megacam bands. (a) As discussed in Section 4.1, w e could not mo del SL 2SJ221606 − 175131 as a lens and therefore do not rep or t lensing parameters for this system.