This article has been accepted for publication and undergone full peer review but has not been through the copyediting, typesetting, pagination and proofreading process which may
Atmospheric river impacts on Greenland Ice Sheet surface mass balance
K. S. Mattingly1, T. L. Mote1, and X. Fettweis2
1
Climatology Research Laboratory, Department of Geography, University of Georgia, Athens, GA, USA
2
Laboratory of Climatology, Department of Geography, University of Liège, Liège, Belgium
Corresponding author: Kyle Mattingly ([email protected])
Key Points:
1. Increased atmospheric river impacts contributed to Greenland Ice Sheet mass loss acceleration in recent years.
2. Atmospheric river events cause surface mass balance decreases in the Greenland Ice Sheet ablation zone during summer.
3. Strong atmospheric rivers result in much greater Greenland Ice Sheet impacts than more moderate events.
Abstract
Greenland Ice Sheet (GrIS) mass loss has accelerated since the turn of the 21st century. Several recent episodes of rapid GrIS ablation coincided with intense moisture transport over Greenland by atmospheric rivers (ARs), suggesting that these events influence the evolution of GrIS surface mass balance (SMB). ARs likely provide melt energy through several physical mechanisms, and conversely, may increase SMB through enhanced snow accumulation. In this study, we compile a long-term (1980–2016) record of moisture
transport events using a conventional AR identification algorithm as well as a self-organizing map (SOM) classification applied to MERRA-2 data. We then analyze AR effects on the GrIS using melt data from passive microwave satellite observations and regional climate model output. Results show that anomalously strong moisture transport by ARs clearly contributed to increased GrIS mass loss in recent years. AR activity over Greenland was above normal throughout the 2000s and early 2010s, and recent melting seasons with above-average GrIS melt feature positive moisture transport anomalies over Greenland. Analysis of individual AR impacts shows a pronounced increase in GrIS surface melt after strong AR events. AR effects on SMB are more complex, as strong summer ARs cause sharp SMB losses in the ablation zone that exceed moderate SMB gains induced by ARs in the accumulation zone during summer and in all areas during other seasons. Our results demonstrate the influence of the strongest ARs in controlling GrIS SMB, and we conclude that projections of future GrIS SMB should accurately capture these rare ephemeral events.
Index terms: Ice sheets, cryospheric change, climate dynamics, climate change and
Key words: Greenland ice sheet, atmospheric rivers, ice sheet mass balance, self-organizing
maps, poleward moisture transport
1. Introduction
The Greenland Ice Sheet (GrIS) contains nearly 10% of the world’s fresh water in a ~1.7
million km2 grounded ice mass that is up to 3 km thick [Noël et al., 2014; Thomas et al., 2001;
Alley et al., 2010]. It has been losing mass at an accelerating rate since the late 1990s [Hanna et al., 2013; Khan et al., 2015; Wilton et al., 2017]. Consequently, the estimated GrIS
contribution to the rate of global mean sea level rise has increased from around 5% in 1993 to over 25% in 2014, and this contemporary figure may be as high as 43% when mass losses from glaciers and ice caps along the ice sheet periphery are taken into account [Chen et al., 2017; Noël et al., 2017].
GrIS mass loss occurs when snow accumulation is exceeded by the combined losses from ablation (melting, sublimation, and wind-induced erosion of snow and ice) and solid ice discharge from marine-terminating glaciers. Mass losses from ice discharge and negative surface mass balance (SMB – the difference between surface accumulation and ablation) were roughly equivalent prior to 2005. Since 2005 the SMB component of GrIS mass loss has exceeded the ice discharge component, and SMB is projected to dominate the GrIS
contribution to global sea level rise during the 21st century [Enderlin et al., 2014; van den
Broeke et al., 2017]. The primary cause of the decreasing SMB trend is increasing melt
during summer, as there has been no significant trend in precipitation over the GrIS during this time [van As et al., 2014; Fettweis et al., 2017; Noël et al., 2017].
Spatiotemporal variability of GrIS melt and SMB has been highly significant in recent years. Total annual GrIS SMB steadily decreased from the late 1990s through the
extraordinary melt season of 2012, when GrIS melt extent and duration reached the highest levels in the modern record [Tedesco et al., 2013]. Subsequently, SMB recovered to typical pre-2000 levels in 2013, then positive but not extreme melt anomalies during 2014–2016 preceded abnormally high accumulation during fall 2016 and a below average 2017 melt season [van den Broeke et al., 2016; Lindsey, 2017; Polar Portal, 2017; Tedesco et al., 2017]. Surface melt anomalies were concentrated across the western and southern GrIS during most of the high-melt seasons from the mid-2000s through the early 2010s, after which the highest anomalies shifted poleward to the northern GrIS during the 2014–2016 melt seasons [Hall et
al., 2013; NSIDC, 2015, 2016; Tedesco et al., 2016]. The net result of these recent variations
has been continued year-on-year net GrIS mass loss but at a lesser rate than that observed from the mid-2000s through 2012, and the GrIS may have actually gained mass during the 2016–17 mass balance year for the first time in the 21st century [van den Broeke et al., 2016;
NSIDC, 2017].
Atmospheric conditions tightly control both the ablation and accumulation
constituents of SMB. The temporal evolution of overall GrIS SMB and the spatial patterns of SMB across the ice sheet therefore vary widely in response to short-term weather events as well as lower-frequency climate variability [Auger et al., 2017]. Previous studies have shown that anomalous GrIS melt episodes during the warm season often occur under slow-moving high-pressure regimes known as “Greenland blocks”, with these blocking anticyclones favored during negative NAO conditions and often preceded by extratropical cyclones tracking to the west of Greenland [Hanna et al., 2013; McLeod and Mote, 2015a; Lim et al., 2016; Ahlstrøm et al., 2017]. Greenland blocking has significantly increased in summer over the past few decades, and is an important contributor to recently enhanced GrIS melt rates
[Hanna et al., 2016, 2018]. Another, possibly related, type of synoptic atmospheric circulation feature that may exert an important influence on GrIS SMB is the transport of water vapor by atmospheric rivers (ARs). ARs are narrow corridors of strong horizontal water vapor transport that accomplish most of the annual moisture transport into the high latitudes of the Northern Hemisphere during a relatively small number of transient events [Zhu and Newell, 1998; Woods et al., 2013; Liu and Barnes, 2015].
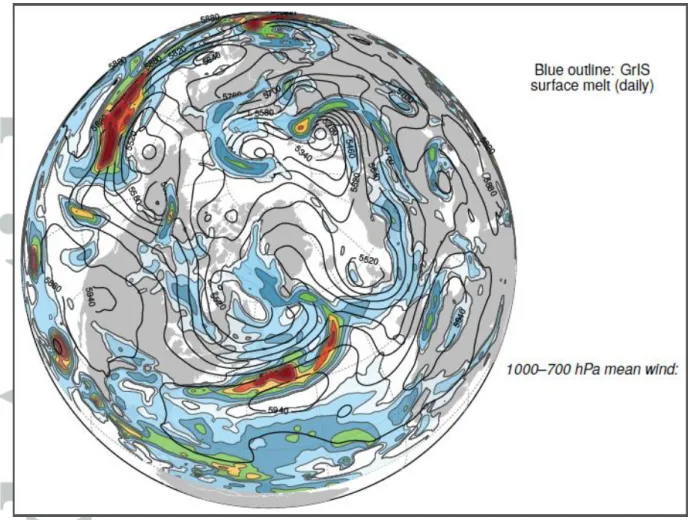
Several recent instances of exceptional GrIS melting have occurred at the same time as strong ARs affected the GrIS. These episodes include the extreme July 2012 event (Figure 1) – when virtually the entire GrIS experienced surface melt for the first time in over a century – and less extensive but highly unusual out-of-season melt during early April 2016 [Nghiem et al., 2012; Neff et al., 2014; Bonne et al., 2015; Tedstone et al., 2017]. The
physical mechanisms by which ARs may influence ice sheet melt include enhancement of the water vapor greenhouse effect, formation of clouds that retain additional longwave radiation, condensational latent heat release in the advected air mass [Binder et al., 2017], and surface melt energy provided by liquid precipitation [Doyle et al., 2015].
A growing body of recent work [e.g. H.-S. Park et al., 2015a, 2015b; Yang and
Magnusdottir, 2017; S. Lee et al, 2017; Johansson et al., 2017] has shown that atmospheric
moisture intrusions into the Arctic strongly influence sea ice conditions by increasing downwelling longwave radiation, but research into any similar AR impacts on the GrIS has been limited to a few case studies of individual moisture transport events. These studies suggest that clouds generated by influxes of water vapor help to initiate surface melt and inhibit meltwater refreezing [Bennartz et al., 2013; van Tricht et al., 2016; Solomon et al., 2017], and that turbulent fluxes of heat into the ice also contributed an abnormal amount of melt energy during two AR-coincident melt events in July 2012 [Fausto et al., 2016a, 2016b]. Although these studies point toward the probable role of warm season ARs in
enhancing GrIS melt, AR events can also provide positive inputs to SMB through snow accumulation and decrease of solar radiation over the low albedo ablation zone [Hofer et al., 2017]. Net AR impacts on SMB likely vary according to factors including season, elevation, latitude, and moisture transport intensity [Fettweis et al., 2013; Le clec’h et al., 2017].
Recent studies have found evidence of an increasing trend in poleward moisture transport toward the GrIS [Mattingly et al., 2016 – hereafter M16] and the Arctic basin [Boisvert and Stroeve, 2015; D.-S. Park et al., 2015; Woods and Caballero, 2016; Alexeev et
al., 2017; Cao et al., 2017; Gong et al., 2017; H. J. Lee et al., 2017], in accordance with
predictions of enhanced moisture transport to the Arctic in a warming climate [Gimeno et al., 2015; Lavers et al., 2015; Graverson and Burtu, 2016; Yoshimori et al., 2017]. In light of these observed and projected trends, and recent case studies suggesting that ARs may play a significant role in determining the evolution of GrIS SMB, an examination of AR trends and impacts on GrIS SMB across a much larger sample of moisture transport events is needed. Therefore, in this study, we first investigate whether AR-related moisture transport to the GrIS has increased alongside the recent downturn in GrIS SMB. We then consider the implications of these moisture transport trends by analyzing the daily, seasonal, and annual scale impacts of AR events on GrIS melt and SMB. In order to examine the GrIS response to a broad range of moisture transport conditions and ensure that any trends we find are not artifacts of a single analysis method, we use both a self-organizing map (SOM) classification as well as a conventional object-based AR identification algorithm to identify moisture transport events. We hypothesize that the cryospheric effects of AR events vary seasonally and are also sensitive to the location and intensity of AR moisture transport, and thus we present detailed analyses of AR impacts partitioned by season, area of intersection with the GrIS, and strength of moisture transport within this AR-GrIS intersection zone.
2. Data and Methods
2.1 Data
The SOM classification and AR identification algorithm were initially applied to integrated water vapor transport (IVT – see section 2.2.1) data over the Northern Hemisphere from four atmospheric reanalysis datasets: MERRA-2 [Gelaro et al., 2017], MERRA
[Rienecker et al., 2011], ERA-Interim [Dee et al., 2011], and CFSR [Saha et al., 2010]. We found close agreement between all four reanalyses regarding moisture transport trends and impacts on the GrIS (supporting information Figure S1), and the main conclusions of this study are not dependent on the choice of reanalysis. Previous studies [e.g. Jakobson et al., 2012; Lindsay et al., 2014; Liu and Key, 2016; Huang et al., 2017; Reeves Eyre and Zeng, 2017] have found that ERA-Interim and MERRA-2 are among the best-performing
reanalyses in the Arctic region, and we further note that a specific purpose of MERRA-2 is improved reanalysis of the global hydrological cycle [Bosilovich et al., 2017]. For these reasons, we describe only the MERRA-2 results in the following sections, meaning that the study period for the moisture transport trend analysis is 1980–2016.
To examine impacts of moisture transport on modeled GrIS meltwater production and SMB, we utilize daily output from the Modèle Atmosphérique Régionale (MAR) regional climate model [Gallée and Schayes, 1994]. MAR is a coupled atmosphere-land surface model that employs the 1-D Surface Vegetation Atmosphere Transfer scheme (SISVAT) to
calculate surface properties and exchange of mass and energy with the atmosphere. SISVAT incorporates a detailed 1-D snowpack model (CROCUS) that simulates energy and mass fluxes within the snowpack and is also capable of modelling changes in snow grain properties and their effects on surface albedo. MAR has been extensively validated against in situ and satellite observations over Greenland [e.g. Lefebre et al., 2005; Alexander et al., 2014;
Fettweis et al., 2011; Fettweis et al., 2017] and has been widely employed to simulate
historical and future GrIS SMB [e.g. Tedesco et al., 2013; Fettweis et al., 2017; Meyssignac
et al., 2017]. Daily total melt, snowfall, SMB, and surface temperature data used in this study
are from MAR version 3.8, run at 7.5km resolution and forced by ERA-Interim reanalysis during 1980–2016. All variables are interpolated to a resolution of 5km on the grid of Box [2013] and corrected to account for topography differences between the native 7.5km MAR results and the 5km topography based on the Greenland Ice Mapping Project (GIMP) data set. In addition to the usual bug corrections, the main improvement with respect to MAR version 3.5 (used in Fettweis et al. [2017]) is the increase of cloud life, which partially corrects the overestimation of snow accumulation inland and the underestimation of infrared radiation highlighted in Fettweis et al. [2017] for MAR version 3.5.
In addition to the MAR output, the National Snow and Ice Data Center (NSIDC) MEaSUREs Greenland Surface Melt daily dataset [Mote, 2014] is used to obtain the daily extent of surface melt during the nominal melt season (May–September). These data are derived from satellite passive microwave observations (DMSP SSMI and SSMIS, Nimbus-7 SMMR) during 1979–2015.
2.2 Methods
In the following sections, we describe the IVT calculations performed on each set of reanalysis data, then detail the SOM classification and object-based AR identification method applied to this IVT data. We employ both these methods with the expectation that their strengths will complement one another and provide a richer level of detail than either method alone. The SOM method categorizes moisture transport patterns across a continuous range of synoptic atmospheric configurations, and by virtue of its unsupervised classification
moisture transport event. Object-based AR identification methods have been successfully applied in a number of studies to advance scientific understanding of the role ARs play in the climate system, and are well suited for analyzing the impacts of discrete moisture transport episodes.
2.2.1 Integrated water vapor transport (IVT) calculation
IVT quantifies the instantaneous flux of water vapor through the depth of an atmospheric
column and is the preferred variable for AR identification in most studies [e.g., Rutz et al., 2014; Brands et al., 2016; Freoidevaux and Martius, 2016]. As in M16, IVT is calculated at 6-hourly time increments over the 1000–200 hPa atmospheric layer as follows:
IVT = (1)
where g is gravitational acceleration (9.80665 m s-2), q and V are specific humidity (in kg kg
-1
) and vector wind (in m s-1) at the given pressure level, and dp is the difference between pressure levels. Consecutive pressure levels are incremented by 50 hPa between 1000 hPa and 500 hPa and by 100 hPa between 500 hPa and 200 hPa. IVT units are kg m-1 s-1. To facilitate comparison of the AR and SOM results across reanalyses, MERRA-2 IVT data were re-gridded (using bilinear interpolation) to a 0.5° × 0.5° grid before further processing.
As in M16, the climatological percentile rank of IVT (IVT PR) is calculated to account for the seasonal cycle in the magnitude of moisture transport, which is particularly pronounced at high latitudes. IVT PR values are determined by ranking each 6-hourly IVT value at a given grid point relative to all the other 6-hourly values at that point occurring within ± 15 Julian days during the 1980–2016 study period. These 6-hourly IVT PR values form part of the input into the object-based AR identification algorithm (see section 2.2.3),
while daily mean IVT PR data for the SOM classification are the mean of the four 6-hourly IVT PR values on each day (see section 2.2.2).
2.2.2 Self-organizing map (SOM) classification of IVT patterns
SOMs are an unsupervised, iterative machine learning method used to reduce the dimensionality of large datasets and organize them into a two-dimensional array or “map” of characteristic “nodes” for easier interpretation [Skific and Francis, 2012]. The SOM
classification method has become increasingly common in the atmospheric sciences due to its usefulness in linking patterns of large-scale atmospheric variability to their finer-scale local and regional effects [Harman and Winkler, 1991; Hewitson and Crane, 2002]. Several recent studies [e.g., Cassano et al., 2007; Skific et al., 2009; Schuenemann et al., 2009;
Schuenemann and Cassano, 2009, 2010; Mioduszewski et al., 2016] have used SOMs to
analyze the impacts of synoptic atmospheric variability across the Arctic and Greenland. While most of these studies characterized the synoptic circulation by applying SOM
classifications to atmospheric pressure or geopotential height, a few recent studies [Radić et
al., 2015; Swales et al., 2016; M16] have shown that SOMs can also be used to directly
categorize IVT patterns.
We perform the SOM classification on MERRA-2 daily mean IVT PR data across the same Greenland-centered spatial domain (see supporting information Figure S2) and with the same 20-node configuration that M16 applied to ERA-Interim. We then subjectively place each node into non-overlapping “moist”, “neutral”, or “dry” groups based on the composite mean IVT PR patterns around Greenland across all days that most closely match the given node according to the SOM algorithm. We also calculate the mean daily NAO index for each node using values obtained from the Climate Prediction Center.
2.2.3 Atmospheric river (AR) identification and impacts
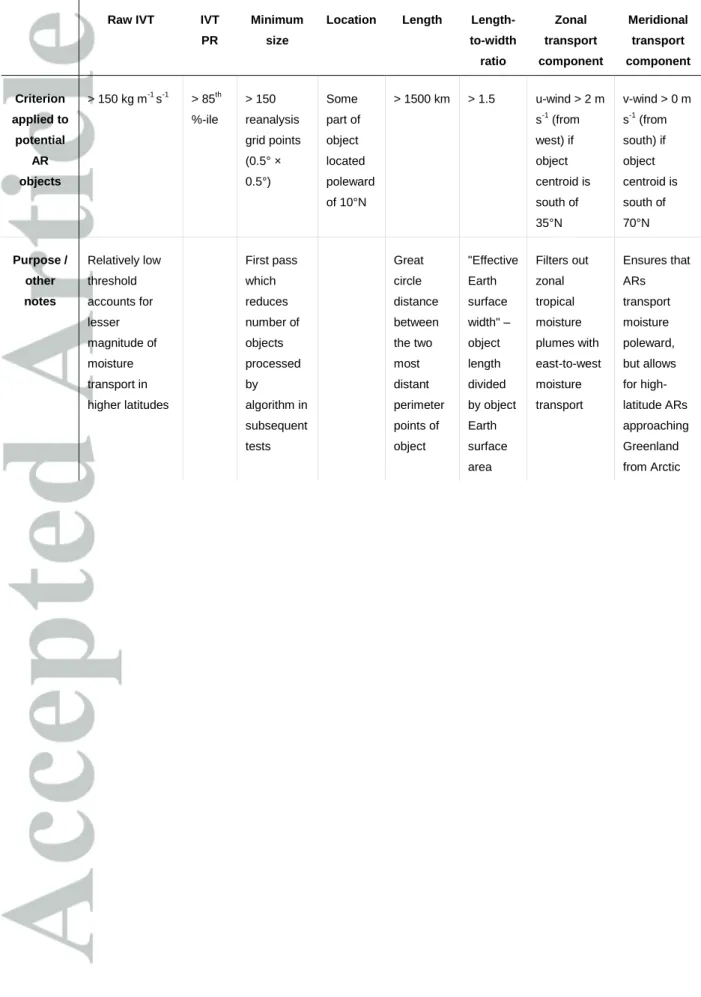
Our AR detection routine generally follows AR identification criteria employed by other researchers – particularly Guan and Waliser [2015] and Mundhenk et al. [2016] – in that potential ARs are classed as contiguous areas or “objects” where the overlap of absolute or “raw” IVT and IVT PR values above some minimum threshold occurs. Further
requirements concerning the potential AR objects’ size, location, length, shape, and location-dependent IVT transport direction (Table 1) are then applied to distill the dataset into a final catalog of AR events. As in previous studies, these requirements ensure that ARs are
relatively long, narrow, filamentary mid- and high-latitude features that transport moisture poleward (with consideration for some high-latitude exceptions in this research – see below) and are distinct from zonally oriented tropical and subtropical moisture plumes. ARs are defined separately at each 6-hourly MERRA-2 timestep with no duration criterion for AR identification.
While we maintain the > 85th IVT PR threshold common to prior studies [e.g. Guan
and Waliser, 2015; Payne and Magnusdottir, 2015; Gao et al., 2016; Nayak et al., 2016], we
alter other criteria to account for potential differences in high-latitude AR characteristics compared to typical mid-latitude AR study regions. Because a few studies [Gorodetskaya et
al., 2014; Guan and Waliser, 2015] have determined a relatively low IVT threshold is needed
to reliably detect ARs in polar regions, we fix the minimum raw IVT value for potential AR identification at 150 kg m-1 s-1 rather than the value of 250 kg m-1 s-1 common in mid-latitude AR studies [e.g. Rivera et al., 2014; Rutz et al., 2014]. We also set a relatively short
minimum AR length threshold of 1500 km and a lenient length-to-width ratio of 1.5, based on our observation that many moisture transport features affecting Greenland have a shorter length scale than lower-latitude ARs. This is especially true of some ARs that we observe approaching Greenland from the Arctic basin, which occur almost exclusively during summer
(JJA). In order to capture these events, we discard the requirement of mean poleward moisture transport for potential AR objects centered north of 70°N.
ARs were automatically detected using a python script that first ingests the required MERRA-2 data (raw IVT, IVT PR, wind) and identifies grid cells that meet the baseline raw IVT and IVT PR requirements. The algorithm then inspects the size, location, length, shape, and location-dependent IVT transport direction of contiguous grid cells that meet the baseline criteria to determine the final AR outlines (see Table 1). After all AR outlines are identified at each 6-hourly timestep, we overlay these AR outlines onto the raw IVT fields and remove raw IVT grid points located outside of AR outlines to quantify total AR-related moisture transport over longer time scales. The resulting metric, which we call “time integrated AR-related IVT” (AR-IVT), is calculated by multiplying the instantaneous IVT value at each grid point by the number of seconds in the 6-hourly time period extending -/+ 3 hours from the timestep (resulting in units of kg m-1). Because we are specifically interested in AR-related impacts, only grid points located within an AR outline at the given 6-hourly timestep are included in the calculation. We then sum or average AR-IVT values over monthly, seasonal, and annual time periods to relate AR-related moisture transport to GrIS impacts over these longer time scales.
The glaciological and climatic characteristics of the GrIS exhibit substantial regional variability [van As et al., 2014; Poinar et al., 2015; MacGregor et al., 2016; Auger et al., 2017; Langen et al., 2017; Mernild et al., 2017; Wilton et al., 2017], and we reiterate that the recent acceleration in mass loss has been most acute in western Greenland [McMillan et al., 2016; Mernild et al., 2017]. We further hypothesize based on the results of Liu and Barnes [2015] and M16 that AR moisture transport is often directed into one of two favored pathways to the west or east of Greenland depending on interactions between the North Atlantic storm track and the GrIS topography. For these reasons, we separately analyze the
character and impacts of moisture transport in western and eastern Greenland regions formed by the merging of GrIS drainage basins delineated by previous studies [e.g. Luthcke et al., 2013; Wilton et al., 2017]. See Figure 8 for the outline of these regions, which we hereafter call WG and EG. We also separately analyze AR impacts in the ablation zone (MAR grid points classified as > 50% permanent ice with annual mean SMB < 0 averaged over the entire 1980–2016 study period) and accumulation zone (> 50% permanent ice, annual mean SMB > 0) for each region. Finally, we partition AR impacts into three intensity categories – AR<85,
AR85+, and AR95+ – based on the daily maximum IVT value found in the areal overlap
between any AR and the given region on each day an AR is present in the region. The AR<85
category comprises AR events of “normal” intensity (daily maximum IVT less than the 85th percentile of the region-specific distribution), while the AR85+ (IVT between the 85th and 95th
percentiles) and AR95+ (IVT > 95th percentile) classes contain stronger AR impacts found in
the positive tail of the intensity distribution.
To analyze the characteristic time scales of AR impacts on GrIS SMB and investigate any effects extending beyond the day of the AR event, we calculate mean anomalies of MAR snowfall, total surface meltwater production (which can run-off or refreeze afterwards in the model), and SMB for 8 days before and after the beginning of each AR event (day 0). Anomalies are defined relative to the -/+ 15-day centered mean in a similar manner to the IVT PR calculations described above. To isolate the impacts of individual AR events, only days surrounding day 0 with no AR impact of the given intensity are included in the
composites. For example, if day 0 is a AR85+ impact day and AR85+ events also occur on day
-6, day -4, day +3, and day +7, only days -3 through +2 are included in the calculation of anomalies.
In section 3.3, we present composite seasonal AR-IVT anomalies before and during GrIS melt seasons categorized by mean May–September melt extent quantified by the
MEaSUREs Greenland Surface Melt data. To relate seasonal AR-IVT anomalies to their immediate GrIS melt impacts and control for the long-term increasing trend in GrIS melt extent, we detrend the 1979–2015 melt time series using the nonlinear Ensemble Empirical Mode Decomposition (EEMD) method [Chen et al., 2016]. “High melt” and “low melt” seasons are then defined relative to this background trend (supporting information Figure S3).
3. Results
3.1 Trends in AR moisture transport to Greenland
AR impacts on Greenland can occur at any time during the year but are most common during summer (JJA), with this summer peak in frequency especially pronounced in northern and western Greenland (supporting information Figure S4). Moisture transport by ARs occurs predominantly in the lowest few kilometers of the troposphere [Ralph et al., 2004; Neiman et
al., 2008; Backes et al., 2015], and thus ARs are much more common along the low-elevation
coastal regions of Greenland compared with the high interior GrIS (see supporting
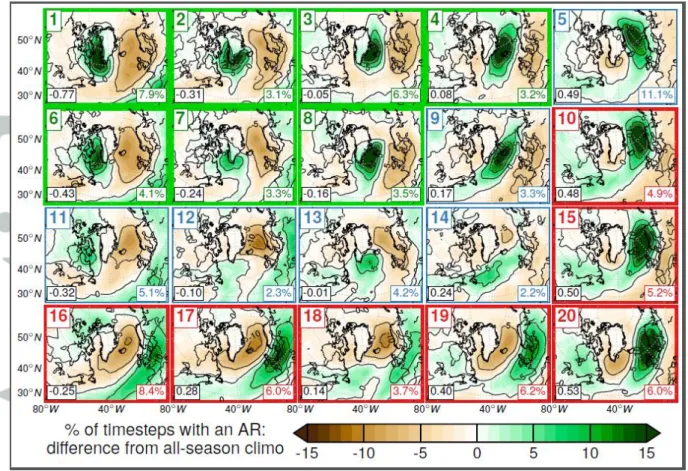
information Figure S4). Maps of AR frequency across SOM nodes (Figure 2) demonstrate the close agreement between moisture transport patterns identified by the SOM classification and the object-based AR detection algorithm (compare to supporting information Figure S2). They highlight two primary channels or “pathways” for poleward moisture transport by ARs near Greenland. One pathway is through Baffin Bay along the western coast of Greenland (Nodes 1 and 6 in top left corner of SOM grid), which is favored during negative NAO phases. The other pathway is through the Atlantic Arctic Gateway region along the southeast and east coasts of Greenland (Nodes 3, 4, 5). This pathway – along with patterns
characterized by moisture transport well to the south and east of Greenland toward northwest Europe (e.g. Nodes 15, 19, 20) – is favored during positive NAO conditions. Enhanced AR activity in the main North Atlantic storm track shifts equatorward (poleward) when the Baffin
Bay / West Greenland (Atlantic Arctic Gateway / East Greenland) pathway is active. ARs impinging on Greenland from the south may also bifurcate around the high topography in the interior of the GrIS (Nodes 2 and 7), while the pattern of AR frequency anomalies for Node 16 suggests ARs occasionally approach northern Greenland from the Arctic basin.
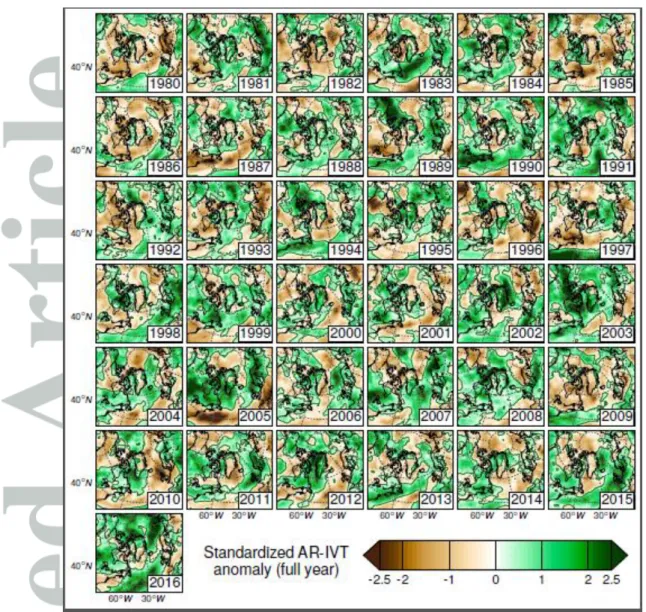
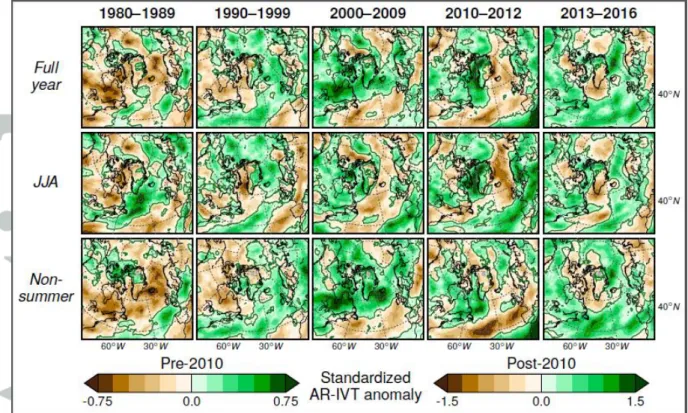
To visualize spatial variability and trends in AR-related moisture transport toward Greenland, Figure 3 maps the standardized anomalies in AR-IVT accumulated during each year from 1980–2016. The maps reveal a preponderance of negative AR-IVT anomalies around Greenland prior to the late 1990s, although positive AR-IVT z-scores were present around Greenland in some years (e.g. 1981, 1995). Beginning in 1999 there was a continuous string of years with at least moderately positive anomalies prevailing around Greenland through 2008, with highly anomalous AR-IVT (exceeding +2 standard deviations) over parts of Greenland in several of these years (e.g. 2002, 2003, 2005). Positive AR-IVT anomalies were concentrated over eastern Greenland in 2002 due to exceptional non-summer AR
activity in eastern Greenland (supporting information Figure S6), but positive anomalies were focused on western Greenland in most other years from 1999–2008. Western Greenland experienced positive AR-IVT anomalies in both summer and non-summer months (see supporting information Figures S5 and S6). After below-normal AR-IVT around Greenland in 2009, there were again positive anomalies over western Greenland from 2010–2012, with exceptionally strong (>2.5 standard deviations) and widespread AR-IVT anomalies over western Greenland during the record-breaking melt year of 2012 due to highly anomalous AR activity during JJA. The study period ended with several years of smaller anomalies from 2013–2016, and the focus of above-normal AR-IVT shifted to northern Greenland in most of these years, particularly 2016.
The above results showing enhanced AR activity over Greenland during the GrIS mass loss acceleration of the 2000s and early 2010s are further confirmed when AR-IVT
anomalies are aggregated over longer time periods (Figure 4). Mean annual AR-IVT during 1980–1989 was below the 1980–2016 average over virtually all of Greenland, with strong negative anomalies also present over central and northeast Canada, Baffin Bay, and the Greenland and Norwegian Seas. During the 1990s, weak to moderate positive AR-IVT anomalies occurred over southeast Greenland, along with much of the Nordic Seas and Arctic Basin, while negative anomalies prevailed over the western half of Greenland. From 2000– 2009 strong positive AR-IVT anomalies dominated much of Greenland, particularly its southern half. These above-normal AR-IVT values were connected to a coherent upstream belt of positive anomalies extending across most of northern North America into Baffin Bay. Positive anomalies were focused on the western half of Greenland in JJA and covered all of Greenland in non-summer months during this period.
From 2010–2012, including the unprecedented GrIS melt seasons of 2010 and 2012, strong positive AR-IVT anomalies were located over Baffin Bay and adjacent areas of western and northern Greenland, particularly during JJA. This activity over Greenland was again contiguous with positive anomalies located upstream across northeast North America. In contrast, mostly negative anomalies occurred over the Nordic Seas, the Atlantic sector of the Arctic, and adjacent areas of the eastern Greenland coast, especially during JJA. The pattern changed markedly from 2013–2016, as below-normal AR-IVT prevailed over most of southern Greenland and positive anomalies were found over northern and northeastern
Greenland.
3.2 Daily-scale AR impacts on GrIS SMB
3.2.1 GrIS melt and SMB variability across SOM nodes
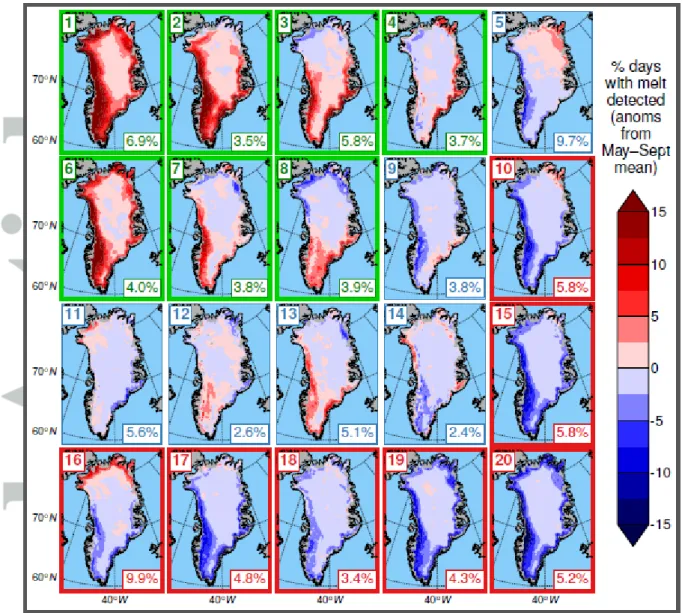
During the melt season (May–September), there is a clear connection between daily moisture transport patterns around Greenland and GrIS surface melt extent (Figure 5).
Positive melt extent anomalies occur over virtually the entire GrIS on days classified into the most common “moist” SOM pattern (Node 1 – see Figure 2). Melt extent is also anomalously high for most of the other “moist” nodes, and the location and intensity of these anomalies varies in concert with the location of anomalous moisture transport toward the GrIS. For example, positive melt extent anomalies occur over the northeastern GrIS in association with enhanced AR frequency along the northeast coast of Greenland on days classified into Node 5, and Node 13 features anomalously frequent melt along the western and southeastern fringes of the GrIS. The spatial extent of GrIS melt is much more restricted on days with anomalously low AR frequency around Greenland (bottom and right sides of the SOM grid). Only the low-elevation margins of the GrIS experience melt on an appreciable number of these days, and melt extent is below average throughout the GrIS. An exception, however, is Node 16 where enhanced AR frequency along the northern coast of Greenland corresponds to more frequent surface melt across the northern GrIS (see supporting information Figure S2). On days classified into “neutral” nodes, melt frequency is generally between the “moist” and “dry” nodes.
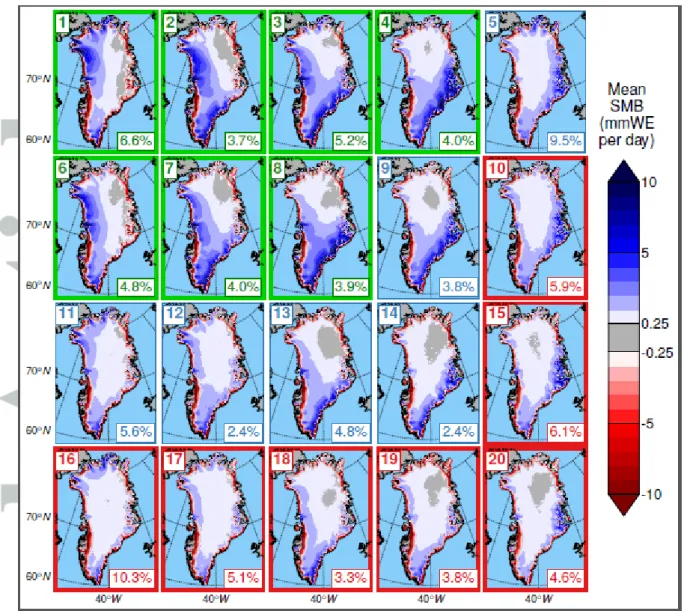
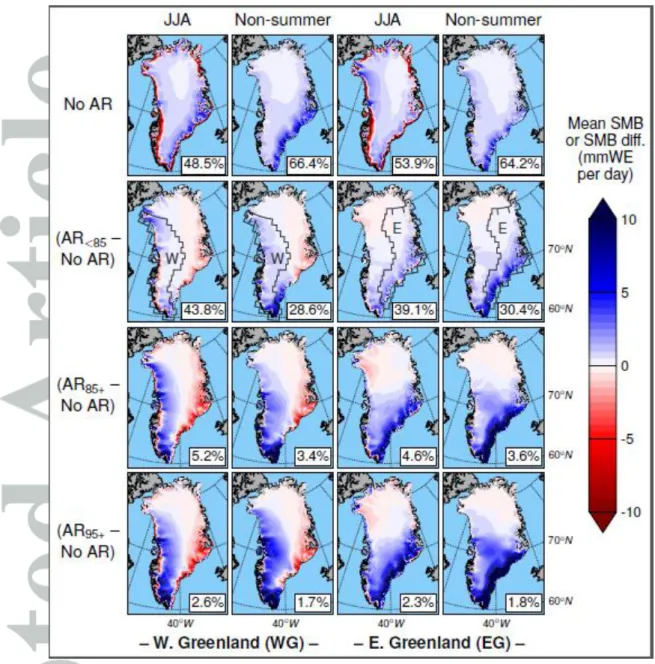
Expanding the analysis to the overall impacts of moisture transport events on GrIS SMB, we find that the tendency of ARs to induce surface melt in summer is somewhat counterbalanced by AR-induced increases in snow accumulation as simulated by MAR. There is a well-defined spatial structure to these positive and negative AR impacts on SMB during JJA (Figure 6). “Moist” SOM nodes with anomalous AR activity result
simultaneously in decreased SMB in the low-elevation ablation zone (due to increased melt – see supporting information Figure S7) and gains in SMB in the interior accumulation zone (due to greater snow accumulation – see supporting information Figure S8). As with melt extent, these SMB effects are dependent on the location and intensity of moisture transport. Nodes 1 and 6 feature above-average AR frequency over Baffin Bay and the western
Greenland coast, which causes the greatest low-elevation SMB losses and interior SMB gains to be located over the western GrIS. The scale of these elevation-dependent positive and negative AR impacts on SMB is not balanced, however. For example, mean SMB on JJA Node 1 days is -20.40 mmWE / day in the western Greenland (WG) ablation zone and 1.55 mmWE / day in the WG accumulation zone (supporting information Table S1). The highest mean SMB value in the WG accumulation zone for any node is only 2.56 mmWE / day (Node 2). In eastern Greenland (EG), JJA SMB losses in the ablation zone are most intense on days with enhanced AR activity in western Greenland (e.g. mean EG ablation zone SMB of -15.91 mmWE / day for Node 1). The more modest SMB gains in the EG accumulation zone are highest on days with increased AR frequency across southeast Greenland (e.g. mean EG accumulation zone SMB of 2.17 mmWE / day for Node 4 and 1.88 for Node 8). In localized areas where moisture transport interacts with the abruptly rising topography of southeast Greenland, mean SMB gains on these days exceed 10 mmWE / day. Most “neutral” and “dry” nodes are characterized by lesser but still substantial SMB losses in the ablation zones of both WG and EG (on the order of -9 to -15 mmWE / day), while mean SMB gains in the accumulation zone are generally less than 1 mmWE / day.
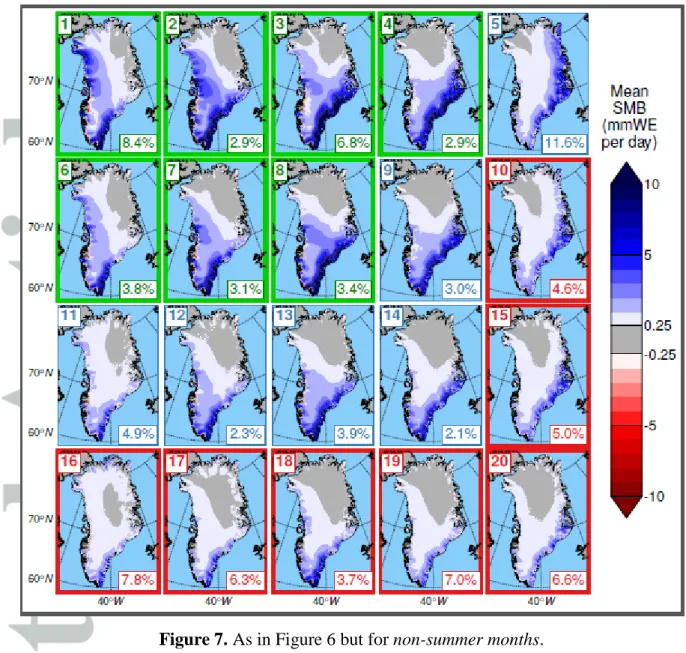
During non-summer months, mean SMB is almost universally positive throughout the GrIS (Figure 7). The effect of enhanced AR activity is to accentuate these generally modest SMB gains, with the location of greatest snowfall (see supporting Figure S8) again varying in close association with AR activity. As in JJA, there are localized areas of southeast
Greenland with mean SMB greater than 10 mmWE / day for nodes with enhanced moisture transport toward this region, but mean SMB is never greater than 3.55 mmWE / day for any node when averaged over the entire ablation or accumulation zone of WG or EG (supporting information Table S1). There are also small areas of negative mean SMB in southwest
Greenland for a few “moist” nodes, which are the imprint of occasional spring and autumn melt events triggered by strong ARs affecting western Greenland.
3.2.2 Impacts of discrete AR events on GrIS SMB
Turning to the effects of discrete AR events over western and eastern Greenland, Figure 8 shows that days with AR impacts on WG have higher mean SMB across the interior WG accumulation zone than non-AR days during all seasons. The magnitude of this positive impact on SMB increases with increasing AR intensity. AR85+ and AR95+ events affecting
WG result in higher snowfall than AR<85 events, and even though total melt in the WG
accumulation zone also increases with increasing AR intensity during JJA, the overall effect remains an increase in SMB with increasing AR intensity during all seasons (see supporting information Figures S9 and S10 and supporting information Table S2). Over the EG
accumulation zone, however, less SMB is gained on both JJA and non-summer days with WG AR impacts than on days with no AR present in WG. In the WG ablation zone, mean SMB again increases with increasing AR intensity during non-summer months. During JJA, however, mean total melt in the WG ablation zone increases sharply from 15.29 mmWE / day on days with no WG AR to 18.46, 25.79, and 31.89 mmWE / day on WG AR<85, AR85+ and
AR95+ days. JJA snowfall in the WG ablation zone is slightly higher on WG AR<85 and AR85+
days than on non-AR days, but mean snowfall on WG AR95+ days is actually less than on
WG AR<85 and AR85+ days, likely due to an increased proportion of liquid precipitation. The
overall effect is a pronounced decrease in mean JJA SMB in the WG ablation zone from -13.10 mmWE / day on days without WG AR impacts to -14.28, -16.60, and -18.51 mmWE / day on WG AR<85, AR85+ and AR95+ days.
Compared to WG AR events, GrIS SMB responds somewhat differently to EG ARs. As expected, ARs cause large SMB gains in the southeast GrIS accumulation zone during all
seasons. However, one might also expect EG AR events to result in a substantial decrease in WG accumulation given that WG AR days feature negative SMB anomalies in EG, but this is not the case. Rather, EG AR events result in enhanced SMB over nearly the entire southern two-thirds of the GrIS during all seasons, with slight negative SMB impacts over the northern GrIS accumulation zone. Even during JJA, EG AR impacts result in increased SMB in most of the southern GrIS ablation zone, with negative mean SMB values confined to much lower elevations compared to WG AR events. This is because JJA snowfall increases substantially in both the ablation zone and accumulation zone with increasing AR intensity over EG, while increases in total melt in the ablation zone are much less than occurs with WG AR events (see supporting information Figures S9 and S10 and supporting information Table S2). These findings suggest that ARs affecting western Greenland tend to be more “warm” in the
western Greenland ablation zone and induce greater JJA SMB losses than their eastern Greenland counterparts (see supporting information Figure S11).
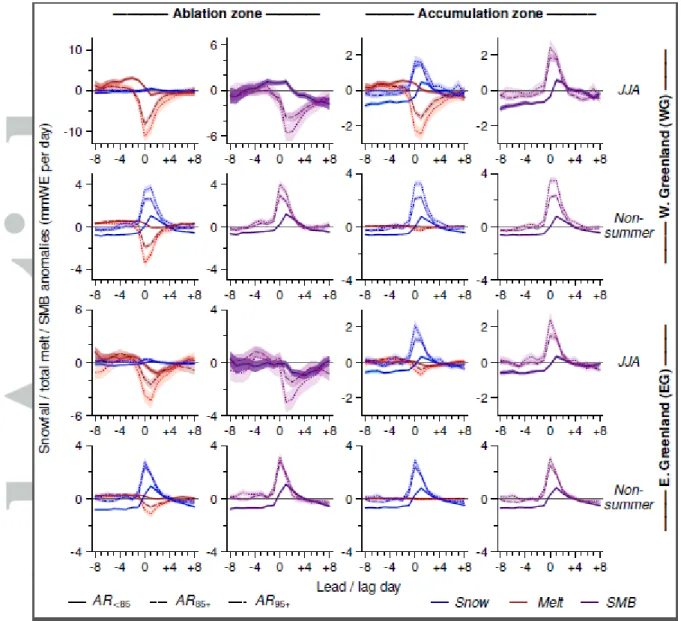
The above results establish a clear link between AR activity and GrIS SMB on the day of AR impact. Now we examine whether AR effects on GrIS surface properties extend beyond the day of the event using the lead/lag analysis described in section 2.2.3. During non-summer months, the response of SMB and total melt to AR events in both the ablation zone and accumulation zone is broadly similar across western and eastern Greenland (Figure 9). Maximum positive SMB anomalies occur on day 0 (the day of the AR impact) and day +1 (the day after the AR impact), with a rapid decrease to pre-AR levels by day +3 to day +4. AR95+ events cause the most positive SMB anomalies and AR85+ impacts also result in
pronounced increases in SMB, while AR<85 impacts are followed by a much more muted
increase in SMB that peaks roughly a day later. There is also a notable tendency for positive SMB anomalies to peak and fall more quickly in EG than in WG, with a pronounced SMB spike on day 0 followed by a steep decrease in SMB anomalies over subsequent days. Small
to moderate amounts of melt may occur in the ablation zone after non-summer AR85+ and
AR95+ impacts, particularly in WG where total melt anomalies on the order of 2–4 mmWE /
day occur. These modest melt anomalies after AR85+ and AR95+ events are typically
outweighed by snowfall anomalies along with meltwater refreezing, resulting in mean positive SMB anomalies after AR events throughout the GrIS during the non-summer months.
The effects of summer (JJA) AR events on SMB and total melt are more complex than in other seasons, with significant differences between WG versus EG and between the ablation and accumulation zone in each region. Summer melt is possible in both the ablation zone and accumulation zone in both regions, particularly after AR85+ and AR95+ events. In the
accumulation zone of both WG and EG, the relatively small anomalies in total melt are typically not enough to offset the increase in snow accumulation and refreezing of meltwater. Thus the SMB response to JJA AR events in the accumulation zone remains positive as in non-summer months, albeit with positive SMB anomalies that are slightly (1–2 mmWE / day) lesser in magnitude.
In the ablation zone of both WG and EG, JJA AR85+ and AR95+ events induce
substantial total melt anomalies that are not counterbalanced by any increase in snowfall, resulting in anomalously negative SMB during the days following AR85+ and AR95+ impacts.
The magnitude and timing of this effect differs between WG and EG. In the WG ablation zone, a steady decline into negative SMB anomalies begins on day 0 as total melt sharply increases (anomalies exceed 10 mmWE / day on the date of AR95+ impacts). Negative SMB
anomalies reach their nadir of approximately -5.53 (-3.51) mmWE around days +1–2 after WG AR95+ (AR85+) events, and SMB remains below pre-AR levels through the end of the
window (day +8) due to lingering melt anomalies. (Note that this lagged effect of ARs on melt refers only to the local production of meltwater and does not account for any delay
between melt and runoff.) A qualitatively similar SMB evolution is observed in the EG ablation zone, but negative SMB anomalies are substantially less than in WG. Total melt anomalies reach their greatest magnitude of 2.50 (4.28) mmWE / day on day +1 following EG AR85+ (AR95+) impacts and SMB anomalies reach their lowest value of -1.46 (-2.98)
mmWE / day on day +2 (day +1) after EG AR85+ (AR95+) impacts. This again indicates that
ablation zone mass losses after JJA AR85+ and AR95+ events are greater in WG than in EG.
These plots also show that AR85+ and AR95+ events have a much greater influence than AR<85
events on the evolution of SMB in the ablation zone during JJA.
3.3 Seasonal and annual relationships between AR moisture transport and GrIS SMB
At the seasonal scale, there is a clear relationship between enhanced AR-IVT over Greenland and above-normal GrIS melt extent. Figure 10 shows positive AR-IVT anomalies over all of Greenland during the MAM, JJA, and SON surrounding melt seasons with anomalously high melt extent. In a similar manner to the enhanced AR-IVT values observed over Greenland during the 2000s and early 2010s (Figure 4), these positive anomalies during the melt season are connected to an area of above-normal AR-IVT extending across North America and the Baffin Bay / Labrador Sea region of the northwest Atlantic Ocean. Note that the melt time series used to define categories of melt seasons is detrended using the EEMD method described in section 2.2.3 (see supporting information Figure S3), so these positive AR-IVT anomalies are independent of the temporal correspondence between the recent increasing AR-IVT and GrIS melt trends. During the SON and DJF preceding above-normal melt seasons, AR-IVT tends to be below normal over Greenland, which affects the amount of winter snow pack above the low albedo zone. Lower winter accumulation results in an earlier appearance of low albedo zones and greater melt during the following summer. The opposite situation occurs for GrIS melt seasons with anomalously low melt extent, as positive AR-IVT
anomalies over Greenland during the preceding SON and (to a lesser extent) DJF are replaced by negative AR-IVT anomalies over most of Greenland during MAM, JJA, and SON.
Negative AR-IVT anomalies are particularly intense over southwest Greenland during JJA. As expected given the nuances in individual AR impacts on GrIS SMB described in section 3.2, annual and seasonal relationships between AR-IVT and SMB are complex and spatially variant (Figure 11). Note that the sign of total melt has been reversed in this figure so that increased melt represents a negative contribution to SMB.
At the annual scale, the relationship between mean AR-IVT and SMB in the WG ablation zone is negative (r=-0.30) but not statistically significant. Although the positive correlation between annual mean AR-IVT and snowfall (r=0.48) is similar to the negative correlation between AR-IVT and total melt (r=-0.47), the greater magnitude of annual total melt relative to snowfall in the WG ablation zone means that melt plays a greater role in determining annual SMB. The opposite is true in the WG accumulation zone, as the greater magnitude of snowfall means that the significant positive relationship (r=0.47) between annual mean IVT and SMB is influenced more strongly by the significant positive AR-IVT – snowfall relationship (r=0.70) than the significant negative relationship with total melt (r=-0.40). The signs of these annual mean relationships between AR-IVT and total melt / snowfall / SMB are all the same in EG as in WG, but the correlation values are universally smaller. This suggests that AR activity exerts less influence on annual SMB variability in EG compared to WG, and there is also less year-to-year variability in annual mean melt, snow, and SMB in EG.
Notably, the correlation between annual mean AR-IVT and SMB in the WG accumulation zone is considerably higher (r=0.56) if an obvious high AR-IVT, low SMB outlier is removed from the calculation. That outlier is 2012, a year with record-high amounts of both AR-IVT and total melt in the WG accumulation zone. This result shows that
enhanced moisture transport by ARs generally leads to increased SMB throughout the accumulation zone of both EG and WG during all seasons, but during the exceptional melt year of 2012, unusually intense summer melt above the long-term mean equilibrium line in WG led to a negative SMB anomaly.
Similar to the daily-scale influence of ARs on SMB detailed in Figure 9, monthly relationships between AR-IVT and SMB in the ablation zone of both WG and EG are of the opposite sign during JJA compared to non-summer months. There is a significant negative correlation (r=-0.26) between JJA monthly mean AR-IVT and SMB in the WG ablation zone, as the negative AR-IVT – total melt relationship (r=-0.28) predominates over the virtually nonexistent variability in snowfall. In the WG accumulation zone, however, the magnitude of JJA snowfall and its positive relationship with AR-IVT (r=0.51) outweighs the significant negative correlation (r=-0.34) between AR-IVT and total melt, resulting in a significant positive monthly mean relationship between AR-IVT and SMB (r=0.31). Robust opposing relationships between AR-IVT versus total melt (r=-0.66) and snowfall (r=0.74) occur in the WG ablation zone during non-summer months, with the greater magnitude of snowfall resulting in a significant positive relationship between AR-IVT and SMB (r=0.31). This is also the case for the WG accumulation zone, but the much greater magnitude of snowfall relative to melt in this area during non-summer months results in a strong (r=0.85) positive relationship between AR-IVT and SMB.
Like the annual mean relationships described above, monthly correlations between AR-IVT and total melt / snowfall / SMB in EG are generally of the same sign but weaker in magnitude than in WG. In the EG ablation zone during JJA, the greater magnitude of total melt compared to snowfall means that the negative relationship between AR-IVT and total melt prevails over the significant positive AR-IVT – snowfall correlation, resulting in a significant negative relationship (r=-0.25) between AR-IVT and SMB. There is essentially no
correlation between AR-IVT and melt in the EG accumulation zone during JJA, leading to a significant positive relationship between AR-IVT and SMB (r=0.41) that is mostly
determined by the AR-IVT – snowfall relationship (r=0.62). During non-summer months the scale of total melt and snowfall in the EG ablation zone are similar, resulting in only a moderately positive (r=0.14) relationship between AR-IVT and SMB. In the EG
accumulation zone the magnitude of snowfall substantially exceeds total melt during non-summer months, resulting in a significant positive relationship (r=0.52) that is not quite as robust as the corresponding relationship in WG.
It is worth noting that our definition of the ablation and accumulation zones, based on long-term (1980–2016) mean SMB, has the effect of blending positive and negative SMB responses to AR events in areas near the equilibrium line where the sign of mean SMB may vary from year to year. If we restrict our definition of the ablation / accumulation zones to areas where mean SMB was below / above zero during every year in the study period, correlations between AR-IVT and SMB generally become more robust while retaining the same sign (supporting information Figure S12). For example, the correlation between AR-IVT and SMB in the western Greenland ablation zone decreases from -0.30 to -0.42 for the full year and the annual correlation increases from 0.47 to 0.68 in the western Greenland accumulation zone.
4. Summary and Discussion
Synthesizing our analyses of recent trends in AR activity around Greenland (section 3.1) and moisture transport impacts on the GrIS at daily and seasonal to annual time scales (sections 3.2 and 3.3), this study provides clear evidence of the key role played by enhanced AR activity in the recent GrIS mass loss acceleration. The extended period of above-normal frequency and intensity of AR events affecting Greenland during 2000–2012 coincided with a
well-documented uptick in GrIS mass loss, culminating with the extreme melt season of 2012 which also featured highly anomalous moisture transport by ARs to western and northern Greenland. Subsequent years have seen less extreme GrIS mass loss and a shift of the greatest melt anomalies to northern areas of the GrIS [Tedesco et al., 2016], as the focus of more moderately positive AR-IVT anomalies also shifted to northern Greenland. Furthermore, our investigation of the short- and long-term relationships between moisture transport events and modeled GrIS surface properties proves that this correspondence between the years of
enhanced AR activity and anomalous GrIS mass loss is not a coincidence. Strong AR impacts cause increased melt in all areas of the GrIS and decreased SMB in the ablation zone during summer, and warm seasons with above-average GrIS melt extent are characterized by anomalously strong moisture transport by ARs over Greenland. ARs typically result in SMB gains in the GrIS ablation zone during non-summer seasons and in the accumulation zone during all seasons. However, the intense summer SMB losses in the ablation zone during years of enhanced moisture transport outweigh the positive AR contributions to SMB in other regions and seasons. The scaling of melt versus snowfall in Figures 9 and 11 shows that the magnitude of mass loss from summer melt in the ablation zone has a much greater upper limit than mass gain from snowfall.
A key point to emphasize from our results is the disproportionate impact of the strongest AR events on the evolution of GrIS SMB. ARs in the highest intensity categories (AR85+ and AR95+) exert a much greater influence on SMB than “normal” (AR<85) ARs, both
in terms of highly anomalous summer surface mass loss in the ablation zone and enhanced accumulation accompanied by limited melt increases in other regions and seasons. We find that nearly all of the most intense AR events with IVT > 1000 kg m-1 s-1 over Greenland during the 1980–2016 study period occurred since 1999. A prominent example of the outsized importance of short-lived intense AR events is provided by the extraordinary
conditions observed during July 2012, when two extreme ARs resulted in the most extensive GrIS surface melt in the modern record. The lasting effects of these and other ephemeral events include the development of unusually thick buried ice layers in the GrIS percolation zone [Nilsson et al., 2015; de la Peña et al., 2015; Steger et al., 2017] and a substantial rise in the water table of firn aquifers in southeast Greenland [Koenig et al., 2014; Miège et al., 2016].
This study joins an existing body of research describing the synoptic atmospheric conditions associated with GrIS surface mass loss. Previous studies have detailed the roles of blocking high pressure systems [Hanna et al., 2013, 2014; McLeod and Mote, 2015b;
Mioduszewski et al., 2016] and warm air advection by extratropical cyclones [Mote, 1998; Schuenemann and Cassano, 2009; McLeod and Mote, 2015a] in forcing ice sheet melt. We
propose that moisture transport by ARs is a complementary and interrelated mechanism affecting GrIS SMB rather than a distinct phenomenon. In most cases, ARs are understood to form as part of the process of air mass convergence and advection in the warm sector of extratropical cyclones – according to the American Meteorological Society glossary, ARs are “typically associated with a low-level jet stream ahead of the cold front of an extratropical cyclone” [AMS, 2017]. Moreover, previous studies have linked both atmospheric blocking development and instances of extreme moisture transport into the Arctic to Rossby wave breaking events [Barnes and Hartmann, 2012; Liu and Barnes, 2015; Kim et al., 2017], suggesting that blocking and AR events may be instigated by similar atmospheric dynamics.
Liu and Barnes [2015] showed that extreme moisture transport in the Labrador Sea / Baffin
Bay region along the southwest coast of Greenland (resembling the “moist” SOM nodes and western Greenland AR events described in the present work) is favored by cyclonic Rossby wave breaking in the North Atlantic jet stream, while anticyclonic wave breaking more often results in extreme moisture transport off the eastern coast of Greenland toward Iceland and
the Nordic Seas. Episodes of extreme moisture transport may actually aid in the development and reinforcement of blocking patterns through diabatic latent heat release [Pfahl et al., 2015;
Grams and Archambault, 2016; O’Reilly et al., 2016], and thus there may be mutually
reinforcing dynamical linkages between cyclonic Rossby wave breaking, extratropical cyclones, ARs, and Greenland blocking, ultimately modulating GrIS mass loss. Future research should investigate the interrelationships between ARs and these other synoptic-scale atmospheric phenomena affecting the GrIS.
A further avenue for future research is to investigate the regional- and planetary-scale atmospheric and oceanic variability modulating the characteristics of ARs and other
atmospheric controls on GrIS SMB. Many recent studies [e.g. Yoo et al., 2014; Baggett et al., 2016; Ding et al., 2014; Flournoy et al., 2016; Gong et al., 2017; Jiang et al., 2017], focusing primarily on Arctic sea ice rather than the GrIS, have detailed the role of tropical forcing in initiating Rossby wave trains that enhance poleward energy and moisture transport to the Arctic. Ding et al. [2014] found indications of tropical Pacific forcing of recent negative NAO anomalies and associated warming in northeastern Canada and Greenland, but did not discuss how this forcing modulates synoptic atmospheric phenomena such as ARs, blocking, or Rossby wave breaking in the vicinity of Greenland. ARs, as corridors of enhanced
moisture transport that often extend from the tropics and subtropics to high latitudes, may provide an especially useful framework for evaluating tropical-extratropical interactions. Understanding any potential connections between tropical forcing, North Atlantic and Arctic ARs, Greenland blocking, and Rossby wave breaking will be crucial in evaluating model simulations of future GrIS evolution. Future projections of blocking and Rossby wave
breaking are uncertain due to the inability of models to accurately simulate the climatology of these features in the current climate [Scaife et al., 2011; Davini and D’Andrea, 2016; Pithan
spatiotemporal variability of ARs if their representation of future Greenland climate is to be reliable, particularly given the major impacts on the GrIS from relatively rare and short-lived extreme AR events detailed in this study. Increasing poleward moisture transport is a
universal feature of theoretical and model projections of a warming climate [e.g. Held and
Soden, 2006; Bengtsson, 2010; Feldl et al., 2017], but the spatial patterns of this enhanced
moisture transport will be constrained by (changing) atmospheric dynamics, with the precise details bearing critical implications for GrIS mass balance.
One final set of future research questions involves the physical mechanisms
underpinning the AR impacts on GrIS SMB described in this study. Many recent studies [e.g.
D.-S. Park et al., 2015; Mortin et al., 2016; H. J. Lee et al., 2017] have found that Arctic
moisture intrusion events cause melt or inhibited growth of sea ice due to increased cloud cover and downward longwave radiation, especially during the cold season when there is no shortwave radiation to offset the positive longwave cloud radiative forcing. No similar long-term study of the impacts of moisture transport events on the GrIS surface energy balance has been conducted to determine if a similar mechanism is at work, although a few case studies have highlighted the increased contribution of turbulent energy fluxes to the GrIS energy balance during AR events [Fausto et al., 2016a, 2016b]. Cloud influences on the GrIS are particularly uncertain, as most studies [Bennartz et al., 2013; Miller et al., 2015, 2017; Van
Tricht et al., 2016; Solomon et al., 2017] have found that clouds increase energy input to the
GrIS surface, while another recent analysis [Hofer et al., 2017] suggested that the recent GrIS mass loss has been driven by reduced summer cloud cover. Future studies should analyze how ARs affect the GrIS surface energy budget throughout a long-term record of moisture transport events and clarify the role of clouds in the GrIS energy balance during all seasons.
Acknowledgements
We thank Dr. Craig Ramseyer for his assistance with the self-organizing map classifications. K.S. Mattingly was supported by a NASA Earth and Space Science Fellowship. This work was also supported by NASA Interdisciplinary Sciences grant NNX14AD98G. ERA-Interim reanalysis data are available from the ECMWF web site (http://www.ecmwf.int), MERRA and MERRA-2 data are available from the NASA Goddard Earth Sciences Data and Information Services Center (https://disc.sci.gsfc.nasa.gov), and CFSR data are available from the NCAR Research Data Archive (https://rda.ucar.edu). The MATLAB functions used for the SOM analysis are provided by the Department of Computer Science, Aalto University (http://research.ics.aalto.fi/Software/somtoolbox). The MARv3.8 daily 7.5km outputs
extrapolated to 5km are available from
ftp://ftp.climato.be/fettweis/MARv3.8/Greenland/ERA_1979-2017_7.5km/. Greenland Surface Melt daily data for 1979–2012 are available from the National Snow and Ice Data Center (NSIDC) (http://nsidc.org/data/nsidc-0533); data for 2013–2016 are available from NSIDC via the Greenland Today site. Daily NAO index values are available from the Climate Prediction Center (http://www.cpc.ncep.noaa.gov).
References
Ahlstrøm, A. P., D. Petersen, P. L. Langen, M. Citterio, and J. E. Box (2017), Abrupt shift in the observed runoff from the southwestern Greenland ice sheet, Science Advances, 3(12), e1701169, doi:10.1126/sciadv.1701169.
Alexander, P., M. Tedesco, X. Fettweis, R. van de Wal, C. Smeets, and M. van den Broeke (2014), Assessing spatio-temporal variability and trends in modelled and measured Greenland Ice Sheet albedo (2000–2013), The Cryosphere, 8(6), 2293–2312, doi:10.5194/tc-8-2293-2014.
Alexeev, V. A., J. E. Walsh, V. V. Ivanov, V. A. Semenov, and A. V. Smirnov (2017), Warming in the Nordic Seas, North Atlantic storms and thinning Arctic sea ice,
Environmental Research Letters, 12(8), 084011, doi:10.1088/1748-9326/aa7a1d.
Alley, R. B., J. T. Andrews, J. Brigham-Grette, G. K. C. Clarke, K. M. Cuffey, J. J. Fitzpatrick, S. Funder, S. J. Marshall, G. H. Miller, J. X. Mitrovica, D. R. Muhs, B. L. Otto-Bliesner, L. Polyak, and J. W. C. White (2010), History of the Greenland Ice Sheet: paleoclimatic insights, Quaternary Science Reviews, 29(15), 1728–1756,
doi:10.1016/j.quascirev.2010.02.007.
American Meteorological Society (2017), Atmospheric river, available from http://glossary.ametsoc.org/wiki/Atmospheric_river.
Auger, J. D., S. D. Birkel, K. A. Maasch, P. A. Mayewski, and K. C. Schuenemann (2017), Examination of precipitation variability in southern Greenland, Journal of Geophysical
Research: Atmospheres, 122(12), 6202–6216, doi:10.1002/2016JD026377.
Backes, T. M., M. L. Kaplan, R. Schumer, and J. F. Mejia (2015), A climatology of the vertical structure of water vapor transport to the Sierra Nevada in cool season
atmospheric river precipitation events, Journal of Hydrometeorology, 16(3), 1029–1047, doi:10.1175/JHM-D-14-0077.1.
Baggett, C., S. Lee, and S. Feldstein (2016), An investigation of the presence of atmospheric rivers over the North Pacific during planetary-scale wave life cycles and their role in Arctic warming, Journal of the Atmospheric Sciences, 73(11), 4329–4347,
doi:10.1175/JAS-D-16-0033.1.
Barnes, E. A., and D. L. Hartmann (2012), Detection of Rossby wave breaking and its response to shifts of the midlatitude jet with climate change, Journal of Geophysical
Research: Atmospheres, 117(D9), doi:10.1029/2012JD017469.
Bengtsson, L. (2010), The global atmospheric water cycle, Environmental Research Letters,
5(2), 025202, doi:10.1088/1748-9326/5/2/025202.
Bennartz, R., M. D. Shupe, D. D. Turner, V. P. Walden, K. Steffen, C. J. Cox, M. S. Kulie, N. B. Miller, and C. Pettersen (2013), July 2012 Greenland melt extent enhanced by low-level liquid clouds, Nature, 496(7443), 83–86, doi:10.1038/nature12002.
Binder, H., M. Boettcher, C. M. Grams, H. Joos, S. Pfahl, and H. Wernli (2017), Exceptional air mass transport and dynamical drivers of an extreme wintertime Arctic warm event,
Geophysical Research Letters, 44(23), 12,028–12,036, doi:10.1002/2017GL075841.
Boisvert, L., and J. Stroeve (2015), The Arctic is becoming warmer and wetter as revealed by the Atmospheric Infrared Sounder, Geophysical Research Letters, 42(11), 4439–4446, doi:10.1002/2015GL063775.
Bonne, J.-L., H. C. Steen-Larsen, C. Risi, M. Werner, H. Sodemann, J.-L. Lacour, X.
Fettweis, G. Cesana, M. Delmotte, O. Cattani, P. Vallelonga, H. A. Kjær, C. Clerbaux, Á. E. Sveinbjörnsdóttir, and V. Masson-Delmotte (2015), The summer 2012 Greenland heat wave: In situ and remote sensing observations of water vapor isotopic composition during an atmospheric river event, Journal of Geophysical Research: Atmospheres, 120(7), 2970–2989, doi:10.1002/2014JD022602.
Bosilovich, M. G., F. R. Robertson, L. Takacs, A. Molod, and D. Mocko (2017), Atmospheric water balance and variability in the MERRA-2 reanalysis, Journal of
Climate, 30(4), 1177–1196, doi:10.1175/JCLI-D-16-0338.1.
Box, J. E. (2013), Greenland Ice Sheet mass balance reconstruction. Part II: Surface mass balance (1840–2010), Journal of Climate, 26(18), 6974–6989, doi:10.1175/JCLI-D-12-00518.1.
Brands, S., J. Gutiérrez, and D. San-Martín (2016), Twentieth-century atmospheric river activity along the west coasts of Europe and North America: algorithm formulation, reanalysis uncertainty and links to atmospheric circulation patterns, Climate Dynamics,
48(9–10), 2771–2795, doi:10.1007/s00382-016-3095-6.
Cao, Y., S. Liang, X. Chen, T. He, D. Wang, and X. Cheng (2017), Enhanced wintertime greenhouse effect reinforcing Arctic amplification and initial sea-ice melting, Scientific
Reports, 7(1), 8462, doi:10.1038/s41598-017-08545-2.
Cassano, J. J., P. Uotila, A. H. Lynch, and E. N. Cassano (2007), Predicted changes in synoptic forcing of net precipitation in large Arctic river basins during the 21st century,
Journal of Geophysical Research: Biogeosciences, 112(G4), doi:10.1029/2006JG000332.
Chen, H. W., R. B. Alley, and F. Zhang (2016), Interannual Arctic sea ice variability and associated winter weather patterns: A regional perspective for 1979–2014, Journal of
Geophysical Research: Atmospheres, 121(24), 14,433–14,455,
doi:10.1002/2016JD024769.
Chen, X., X. Zhang, J. A. Church, C. S. Watson, M. A. King, D. Monselesan, B. Legresy, and C. Harig (2017), The increasing rate of global mean sea-level rise during 1993–2014,
Nature Climate Change, 7(7), 492–495, doi:10.1038/nclimate3325.
Davini, P., and F. D’Andrea (2016), Northern hemisphere atmospheric blocking
representation in global climate models: twenty years of improvements?, Journal of
De la Peña, S., I. Howat, P. Nienow, M. van den Broeke, E. Mosley-Thompson, S. Price, D. Mair, B. Noël, and A. Sole (2015), Changes in the firn structure of the western Greenland Ice Sheet caused by recent warming, The Cryosphere, 9(3), 1203–1211, doi:10.5194/tc-9 -1203-2015.
Dee, D. P., S. M. Uppala, A. J. Simmons, P. Berrisford, P. Poli, S. Kobayashi, U. Andrae, M. A. Balmaseda, G. Balsamo, P. Bauer, P. Bechtold, A. C. M. Beljaars, L. van de Berg, J. Bidlot, N. Bormann, C. Delsol, R. Dragani, M. Fuentes, A. J. Geer, L. Haimberger, S. B. Healy, H. Hersbach, E. V. Hólm, L. Isaksen, P. Kållberg, M. Köhler, M. Matricardi, A. P. McNally, B. M. Monge-Sanz, J.-J. Morcrette, B.-K. Park, C. Peubey, P. de Rosnay, C. Tavolato, J.-N. Thépaut, and F. Vitart (2011), The ERA-Interim reanalysis: configuration and performance of the data assimilation system, Quarterly Journal of the Royal
Meteorological Society, 137(656), 553–597, doi:10.1002/qj.828.
Ding, Q., J. M. Wallace, D. S. Battisti, E. J. Steig, A. J. E. Gallant, H.-J. Kim, and L. Geng (2014), Tropical forcing of the recent rapid Arctic warming in northeastern Canada and Greenland, Nature, 509(7499), 209–212, doi:10.1038/nature13260.
Doyle, S., A. Hubbard, R. S. W. van de Wal, J. Box, D. van As, K. Scharrer, T. Meierbachtol, P. Smeets, J. Harper, E. Johansson, R. Mottram, A. Mikkelsen, F. Wilhelms, H. Patton, P. Christoffersen, and B. Hubbard (2015) Amplified melt and flow of the Greenland ice sheet driven by late-summer cyclonic rainfall, Nature Geoscience, 8(8), 647–653, doi:10.1038/ngeo2482.
Enderlin, E. M., I. M. Howat, S. Jeong, M.-J. Noh, J. H. Angelen, and M. R. Van den Broeke (2014), An improved mass budget for the Greenland ice sheet, Geophysical Research
Letters, 41(3), 866–872, doi:10.1002/2013GL059010.
Fausto, R. S., D. van As, J. E. Box, W. Colgan, and P. L. Langen (2016a), Quantifying the surface energy fluxes in south Greenland during the 2012 high melt episodes using in-situ observations, Frontiers in Earth Science, 4, 82, doi:10.3389/feart.2016.00082.
Fausto, R. S., D. As, J. E. Box, W. Colgan, P. L. Langen, and R. H. Mottram (2016b), The implication of non-radiative energy fluxes dominating Greenland ice sheet exceptional ablation area surface melt in 2012, Geophysical Research Letters, 43(6), 2649–2658, doi:10.1002/2016GL067720.
Feldl, N., S. Bordoni, and T. M. Merlis (2017), Coupled high-latitude climate feedbacks and their impact on atmospheric heat transport, Journal of Climate, 30(1), 189–201,
doi:10.1175/JCLI-D-16-0324.1.
Fettweis, X., M. Tedesco, M. van den Broeke, and J. Ettema (2011), Melting trends over the Greenland ice sheet (1958–2009) from spaceborne microwave data and regional climate models, The Cryosphere, 5(2), 359–375, doi:10.5194/tc-5-359-2011.
Fettweis, X., B. Franco, M. Tedesco, J. H. van Angelen, J. T. M. Lenaerts, M. R. van den Broeke, and H. Gallée (2013), Estimating the Greenland ice sheet surface mass balance contribution to future sea level rise using the regional atmospheric climate model MAR,
Fettweis, X., J. E. Box, C. Agosta, C. Amory, C. Kittel, C. Lang, D. van As, H. Machguth, and H. Gallée (2017), Reconstructions of the 1900–2015 Greenland ice sheet surface mass balance using the regional climate MAR model, The Cryosphere, 11, 1015–1033, doi:10.5194/tc-11-1015-2017.
Flournoy, M. D., S. B. Feldstein, S. Lee, and E. E. Clothiaux (2016), Exploring the tropically excited Arctic warming mechanism with station data: Links between tropical convection and Arctic downward infrared radiation, Journal of the Atmospheric Sciences, 73(3), 1143–1158, doi:10.1175/JAS-D-14-0271.1.
Froidevaux, P., and O. Martius (2016), Exceptional integrated vapour transport toward orography: an important precursor to severe floods in Switzerland, Quarterly Journal of
the Royal Meteorological Society, 142(698), 1997–2012, doi:10.1002/qj.2793.
Gallée, H., and G. Schayes (1994), Development of a three-dimensional meso-γ primitive equation model: katabatic winds simulation in the area of Terra Nova Bay, Antarctica,
Monthly Weather Review, 122(4), 671–685,
doi:10.1175/15200493(1994)122<0671:DOATDM>2.0.CO;2.
Gao, Y., J. Lu, and R. L. Leung (2016), Uncertainties in projecting future changes in atmospheric rivers and their impacts on heavy precipitation over Europe, Journal of
Climate, 29(18), 6711–6726, doi:10.1175/JCLI-D-16-0088.1.
Gelaro, R., W. McCarty, M. J. Suárez, R. Todling, A. Molod, L. Takacs, C. A. Randles, A. Darmenov, M. G. Bosilovich, R. Reichle, K. Wargan, L. Coy, R. Cullather, C. Draper, S. Akella, V. Buchard, A. Conaty, A. M. da Silva, W. Gu, G.-K. Kim, R. Koster, R.
Lucchesi, D. Merkova, J. E. Nielsen, G. Partyka, S. Pawson, W. Putman, M. Rienecker, S. D. Schubert, M. Sienkiewicz, and B. Zhao (2017), The Modern-Era Retrospective Analysis for Research and Applications, Version 2 (MERRA-2), Journal of Climate,
30(14), 5419–5454, doi:10.1175/JCLI-D-16-0758.1.
Gimeno, L., M. Vázquez, R. Nieto, and R. Trigo (2015), Atmospheric moisture transport: the bridge between ocean evaporation and Arctic ice melting, Earth System Dynamics, 6(2), 583–589, doi:10.5194/esd-6-583-2015.
Gong, T., S. Feldstein, and S. Lee (2017), The role of downward infrared radiation in the recent Arctic winter warming trend, Journal of Climate, 30(13), 4937–4949,
doi:10.1175/JCLI-D-16-0180.1.
Gorodetskaya, I. V., M. Tsukernik, K. Claes, M. F. Ralph, W. D. Neff, and N. P. Van Lipzig (2014), The role of atmospheric rivers in anomalous snow accumulation in East
Antarctica, Geophysical Research Letters, 41(17), 6199–6206, doi:10.1002/2014GL060881.
Grams, C. M., and H. M. Archambault (2016), The key role of diabatic outflow in amplifying the midlatitude flow: A representative case study of weather systems surrounding
Western North Pacific extratropical transition, Monthly Weather Review, 144(10), 3847– 3869, doi:10.1175/MWR-D-15-0419.1.