AVIS
Ce document a été numérisé par la Division de la gestion des documents et des archives de l’Université de Montréal.
L’auteur a autorisé l’Université de Montréal à reproduire et diffuser, en totalité ou en partie, par quelque moyen que ce soit et sur quelque support que ce soit, et exclusivement à des fins non lucratives d’enseignement et de recherche, des copies de ce mémoire ou de cette thèse.
L’auteur et les coauteurs le cas échéant conservent la propriété du droit d’auteur et des droits moraux qui protègent ce document. Ni la thèse ou le mémoire, ni des extraits substantiels de ce document, ne doivent être imprimés ou autrement reproduits sans l’autorisation de l’auteur.
Afin de se conformer à la Loi canadienne sur la protection des renseignements personnels, quelques formulaires secondaires, coordonnées ou signatures intégrées au texte ont pu être enlevés de ce document. Bien que cela ait pu affecter la pagination, il n’y a aucun contenu manquant.
NOTICE
This document was digitized by the Records Management & Archives Division of Université de Montréal.
The author of this thesis or dissertation has granted a nonexclusive license allowing Université de Montréal to reproduce and publish the document, in part or in whole, and in any format, solely for noncommercial educational and research purposes.
The author and co-authors if applicable retain copyright ownership and moral rights in this document. Neither the whole thesis or dissertation, nor substantial extracts from it, may be printed or otherwise reproduced without the author’s permission.
In compliance with the Canadian Privacy Act some supporting forms, contact information or signatures may have been removed from the document. While this may affect the document page count, it does not represent any loss of content from the document.
Université de Montréal
Étude électrophysiologique
de la mémoire visuelle à court terme.
par Rosalie Perron
Département de psychologie Faculté des arts et des sciences
Mémoire présenté à la Faculté des études supérieures
en vue de l'obtention du grade de Maître ès science (M.Sc.)
en psychologie
Faculté des études supérieures
Ce mémoire intitulé:
Étude électrophysiologique de la mémoire visuelle à court terme.
présenté par : Rosalie Perron
a été évalué par un jury composé des personnes suivantes :
Président-rapporteur
Directeur de recherche
iii
Résumé
La N2pc est une composante des potentiels évoqués visuels qui s'observe typiquement aux alentours de 180-270 ms, suite à l'apparition d'une cible visuelle. Elle est utilisée comme un outil pour étudier le déploiement de l'attention visuo-spatiale. Dans plusieurs études, une composante lente et tardive s'observe fréquemment à la suite de la N2pc. Celle-ci apparaît approximativement 300 ms après l'apparition d'une cible. En 2006, Jolicoeur, Sessa, Dell' Acqua et Robitaille lui assignaient le nom de « Sustained Posterior
Contralateral Negativity » (SPCN), en présumant que cette composante pouvait refléter la présence d'items dans la mémoire visuelle à court terme (MVCT). L'objectif de ce mémoire est d'apporter des preuves supplémentaires à la littérature actuelle, quant à l'hypothèse stipulant que la SPCN reflèterait l'activité de la MVCT. Ceci sera réalisé en tentant de démontrer des dissociations entre la N2pc et la SPCN à partir de manipulations expérimentales. Ainsi, la position des stimuli, le nombre d'items maintenus en MVCT et la longueur du délai de rétention ont été manipulés. Les résultats obtenus semblent démontrer que la SPCN reflète' l'activité de la MVCT et que celle-ci est dissociable de la N2pc.
Abstract
The N2pc is an event-related potential (ERP) component observed typically about 180-270 ms after the target onset. This component is used as a tool to study the deployment of visual spatial attention. In several studies, a slow and
late ERP is observed following the N2pc. This activity appears about 300 ms after target onset. In 2006, Jolicoeur, Ses sa, Dell' Acqua and Robitaille, called this component the "Sustained Posterior Contralateral Negativity" (SPCN) and they hypothesized that this ERP reflects the presence of items in visual short-term memory (VSTM). The goal of this research was to provide additional evidence to support the hypothesis that the SPCN reflects the maintenance of items in VSTM. This was done with experimental manipulations designed to demonstrate dissociations between the N2pc and the SPCN. The position of stimuli (upper vs. lower visual field), the number of items maintained in VSTM, and the length of the retention interval were manipulated. The results suggest that the SPCN reflects maintenance of items in VSTM and that it is separable from the N2pc.
v
Table des matières
Résumé ... iii
Abstract ... i v Table des matières ... v
Liste des figures ... vi
Liste des abréviations ... vii
Introduction ... 8
Contexte théorique ... 10
La mémoire ... 10
Le paradigme de «recherche visuelle» ... 12
La terminologie relative aux potentiels évoqués ... 14
La N2pc ... 15
La SPCN ... 21
Les hypothèses de recherches ... 23
L'article ... 25
Contributions à l'article ... 25
Présentation de l'article ... 25
Résultats sommaires et discussion ... 68
Champs visuels (supérieur vs. inférieur) ... 69
Nombre d'items (2 barres vs. 3 barres) ... 70
Champs visuels et nombre d'items ... 71
Délais de rétention (450 ms vs. 650 ms) ... 73
Conclusion ... 74
Bibliographie ... 76
Liste des figures
Figure 1. Illustration du modèle de la mémoire d'Atkinson & Shiffrin (1968). 10
Figure 2. Modèle de la mémoire de travail de Baddeley & Hitch (1974) ... 12
Figure 3. Exemple de tâche en recherche visuelle ... 13
Figure 4. Exemple d'une tâche d'appariement visuel avec délais ... 14
Figure 5. Configuration des électrodes ... 15
Figure 6. Activité électrique ipsilatérale et controlatérale ... 16
Figure 7. N2pc ... 17
Figure 9. Grande moyenne des courbes ipsilatérales et contralatérales ... 68
Figure 10. Courbe controlatérale moins ipsilatérale ... 69
1 .
Liste des abréviations
CDA: Contralateral Delay Activity EEG: électroencéphalogramme ERP: event related potential MCT : mémoire à court terme Ms: millisecondes
MVCT : mémoire visuelle à court terme
PRE : potentiels reliés aux évènements
SPCN: Sustained Posterior Contralateral Negativity VI: cortex visuel primaire
V2 : cortex visuel secondaire
La mémoire est un système complexe incluant une variété de mécanismes cognitifs tels que l'encodage, l'autorépétition, la récupération, l'allocation de ressources attentionnelles, etc. Ces mécanismes distincts, ayant des propriétés et des fonctions spécifiques, fonctionnent toutefois d'une manière fortement interconnectée (Gazzaniga, Ivry, & Mangun, 2000). Par exemple, le
déploiement de l'attention visuo-spatiale permet de sélectionner des informations perçues pour l'encoder en mémoire à court terme (MCT). Cependant, en raison de la proximité temporelle des mécanismes cognitifs et de la complexité de l'organisation de la mémoire, il est souvent difficile de déterminer quels sont précisément les mécanismes en cause dans un phénomène étudié. Une meilleure compréhension des mécanismes cognitifs et de l'organisation de la mémoire est un défi important dans le domaine des neurosciences. En fait, cette ligne de recherche peut avoir un grand impact non seulement sur l'accroissement de nos connaissances scientifiques, mais aussi sur les différents aspects de notre société, tels que la santé et l'éducation.
La but de ce mémoire est de présenter, par le biais d'une étude en électrophysiologie, des preuves supplémentaires à la littérature actuelle, quant à l'hypothèse stipulant que la SPCN reflète un mécanisme de maintien d'informations de la mémoire visuelle à court terme (MVCT) et que celle-ci est
9
dissociable de la N2pc qui est associée au déploiement de l'attention visuo-spatiale.
La prochaine section abordera une revue sommaire de certains concepts reliés à la mémoire ainsi qu'à l'électrophysiologie. Ensuite, les hypothèses de l'étude réalisée seront présentées. Ces sections précèderont l'article scientifique résultant de cette étude. Ce mémoire se terminera par un retour sur les résultats et sur la discussion de l'article.
La mémoire
De nombreux modèles de la mémoire humaine ont été proposés depuis le dernier siècle. Ceux-ci se classent généralement sous trois catégories : classique, structural ou unitaire (Versace, Nevers, & Padovan, 2002). Le
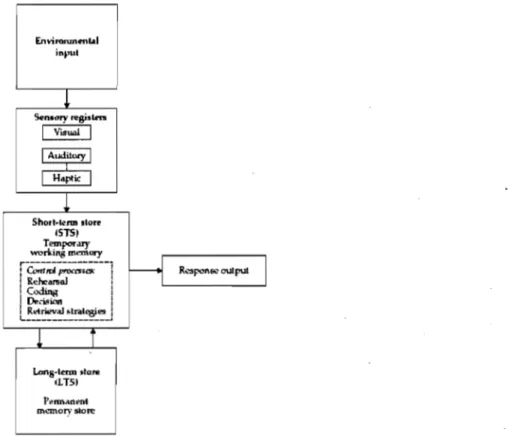
modèle modal d'Atkinson et Shiffrin (1968), un modèle de type structural, subdivise la mémoire en trois sous-systèmes spécifiques (Figure 1), caractérisés par des durées et des capacités de stockages variables: la mémoire sensorielle, la MCT et la mémoire à long tenne.
Envirarun ... input
L
5.!n.""Y "'gi.1mi 1 Viswù 1 1 Audilnty 1 1 1 ! H<tptk 1l
Sho,t·"'rm 1I0re iSTSI Tempordl'f working rnemory ,.---_ ... _---..-1
11 Cent ml f"'OO'S'<7: 1 R""po1\"" output
1 Rehca .. oJ 1 Coding 1 1 o"d.iI.m 1 1 Retrieval .tmtegi... 1 L _______________ J
1
T Lons·tomn store tUS) rorman""t memorystore:Figure 1. Illustration du modèle de la mémoire d'Atkinson & Shiffrin (1968). Figure reproduite d'Atkinson & Shiffrin (1968).
11
La mémoire sensorielle, appelée également registre sensoriel, saisit l'information perçue par les sens et la conserve pour une très courte durée. Le temps de conservation de l'information est en fonction de la modalité sensorielle auquel les registres sont destinés (registre tactile, registre visuel, registre auditif). Par exemple, suite à la présentation de' stimuli visuels, l 'humain conserve en mémoire sensorielle une trace de presque tous les stimuli, durant un délai de moins de 300 millisecondes (ms). Passé ce délai, les informations qui peuvent être éventuellement récupérée sont limitées à un nombre beaucoup plus réduit (Sperling, 1960).
L'attention évalue la pertinence de rallier l'information aux systèmes suivants. L'attention de type visuo-spatiale (en opposition, par exemple, à l'attention de type auditive) se définit par la capacité à sélectionner rapidement les informations les plus pertinentes de l'espace visuel, un mécanisme indispensable pour l'analyse en temps réel de l'environnement.
L'information ayant transité par l'attention se retrouvera dans la mémoire de travail. D'après le modèle tripartite (Figure 2), élaboré par Baddeley et Hitch (1974), la mémoire de travail se scinderait en une composante phonologique, une composante visuelle/spatiale et un système exécutif central. Ce dernier contrôlerait l'attention, en supervisant et en coordonnant les opérations de traitement. La composante phonologique (la boucle phonologique) assurerait le stockage et la disponibilité temporaire des informations verbales tandis que la
composante visuelle/spatiale (le calepin visuo-spatial), pennettrait l'encodage, le maintien temporaire ainsi que la récupération des infonnations visuelle et spatiales. Le calepin visuo-spatial représenterait ce que l'on nomme la MVCT. Ainsi, notre représentation mentale du monde visuel serait maintenue provisoirement dans ce sous-système (Baddeley, 1986; Todd & Marois, 2004).
...-
-...
Visuœpatial ...- rCentral
:1"'11'
Phonological aketch-pad...
l...executive loopFigure 2. Modèle de la mémoire de travail de Baddeley & Hitch (1974). Figure reproduite de Baddeley & Hitch (1974).
Le paradigme de «recherche visuelle»
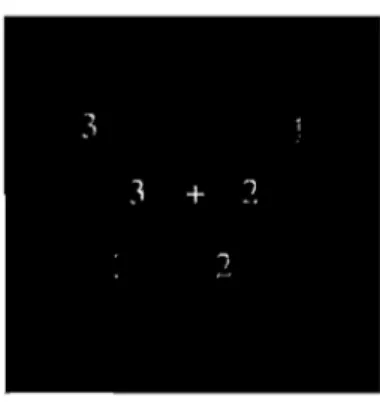
Le déploiement de l'attention visuo-spatiale est couramment étudié à l'aide d'un paradigme expérimental appelé «recherche visuelle». Dans une tâche typique de ce paradigme, un ensemble de stimuli visuels sont présentés durant un bref moment à un observateur. Le rôle de celui-ci est de repérer le plus rapidement possible un stimulus précis, la cible, parmi les autres stimuli, les dis tracteurs (Figure 3). Les tâches de recherche visuelle peuvent également ne contenir que deux stimuli, une cible et un distracteur, affichés d'une part et d'autre du centre de l'affichage (i.e. une présentation bilatérale).
13
Figure 3. Exemple de tâche en recherche visuelle. Le chiffre rouge (la cible) et les chiffres verts (les distracteurs) sont présentés durant un bref moment (e.g. 150 ms). Le participant doit rapporter l'identité de la cible rouge.
Une des variantes du paradigme ci-dessus est le paradigme d'appariement visuel avec délais (delayed matching task). Suite à la recherche de la cible par l'observateur, un délai de rétention (intervalle de temps d'attente) est imposé à celui-ci. Un nouvel affichage est présenté après ce délai, contenant un stimulus qui sera nommé ici «stimulus-test».
L'observateur doit déterminer et indiquer si ce stimulus-test est identique à la cible ayant été maintenue en MVCT (Figure 4). Les tâches d'appariement avec délais impliquent des processus de sélection, d'encodage et de maintien d'information, ce qui permet d'étudier l'attention visuo-spatiale ainsi que la mémoire à court terme.
1 1 1 '!t Présentation des stimuli durant 200 ms. 1 1 1 '!t Délai de rétention: 500 ms. 1 1 1 '!t Stimulus-test: Ce stimulus correspond t'il à la cible.
Figure 4. Exemple d'une tâche d'appariement visuel avec délais. Le chiffre rouge (la cible) et le chiffre vert (le distracteur) sont présentés durant un bref moment (e.g. 200 ms) Suite à un délai de rétention (e.g. 500 ms), un stimulus-test est présenté au participant. Celui-ci doit indiquer si la cible retenue s'apparie avec le stimulus-test.
La terminologie relative aux potentiels évoqués
L'électroencéphalogramme (EEG) est utilisé pour mesurer l'activité électrique brute du cerveau captée par des électrodes qui sont placées sur la surface du cuir chevelu (Figure 5). Isoler les processus neuronaux spécifiques dans l'EEG est toutefois difficile car l'EEG fournit des informations que sur l'ensemble des sources d'activité électrique du cerveau. La technique des potentiels reliés aux évènements (PRE) ou communément appelée «event related potential» (ERP) permet d'extraire les réponses neuronales mesurées par l'EEG et de les associer à des évènements cognitifs précis. Quant à la dénomination «composante»,
15
celle-ci réfère habituellement à un agencement de PRE associée à des patterns spatio-temporel de processus cognitifs.
Figure 5. Configuration des électrodes. Configuration standard de 64 +2 électrodes placées à la surface du cuir chevelu du System International 10120. Figure reproduite de (http://www.biosemi.comlheadcap.htm).
LaN2pc
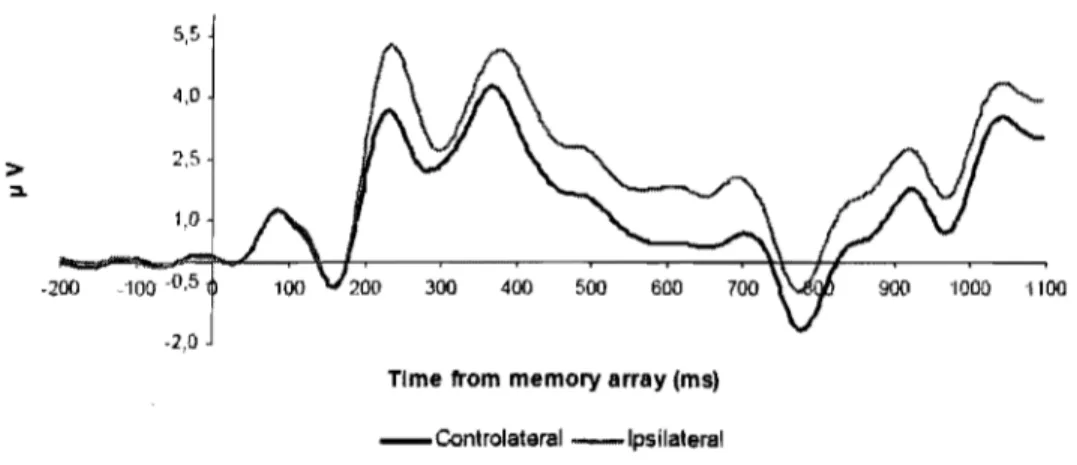
La N2pc est une composante des PRE visuels reflétant le déploiement de l'attention visuo-spatiale. Celle-ci s'observe typiquement aux alentours de 180-270 ms après l'apparition d'une cible dans une tâche de recherche visuelle. La N2pc est obtenue par la soustraction de l'activité électrique moyenne ipsilatérale à la cible, de l'activité électrique moyenne controlatérale à la cible de chacune des paires d'électrodes latéralisée. L'activité observée aux
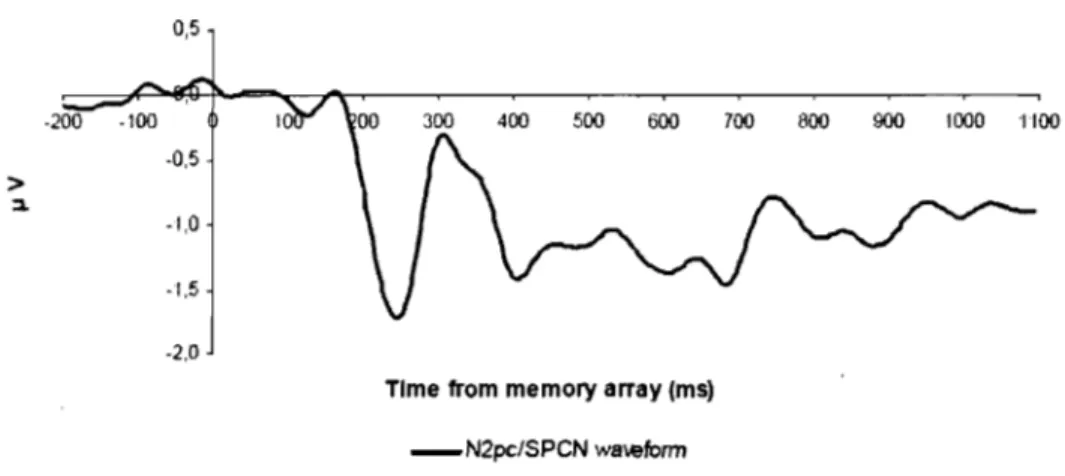
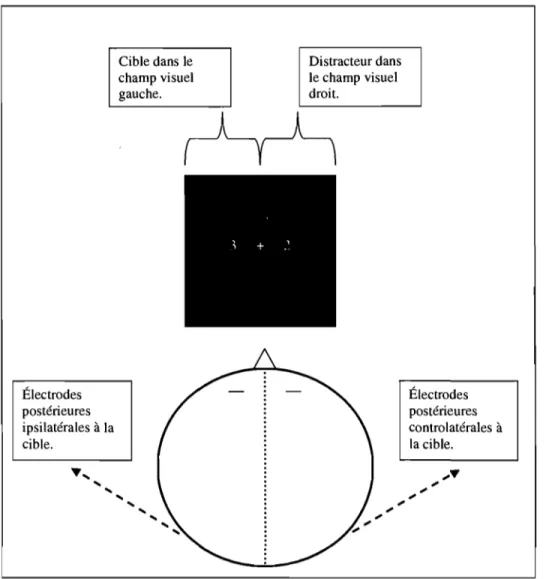
électrodes de la région postérieure du cerveau, est de plus grande amplitude du côté ipsilatéral à l'hémicharnp dans lequel l'attention est déployée comparativement au côté controlatéral à l'hémichamp dans lequel l'attention est déployée (Figure 6). Le calcul de la N2pc est basé sur le moyennage de cette la différence de voltage (courbe controlatérale moins courbe ipsilatérale) au cours de plusieurs essais (Figure 7).
5,5 4.0 2,5 1,0 -200 100 -0,5 -2,0
Tlme from memory array (ms)
-Controlateral -Ipsilateral
Figure 6. Activité électrique ipsilatérale et controlatérale. Exemple de l'activité électrique moyenne ipsilatérale à la cible et de l'activité électrique moyenne controlatérale à la cible des paires d'électrodes latéralisées de la région postérieure du cerveau.
17
0,5
-2,0
Tlme from memory array (ms)
_N2pc/SPCN w8wform
Figure 7. N2pc. Exemple de courbe résultante de la soustraction de la courbe ipsilatérale de la courbe controlatérale (controlatérale moins ipsilatérale) de paires d'électrodes latéralisée de la région postérieure du cerveau.
Par exemple (Figure 8), un sujet fait une tâche en recherche visuelle durant laquelle il doit rapporter un chiffre rouge (la cible) présenté en même temps que le chiffre vert (le dis tracteur), plusieurs fois (e.g. 900 essais) au cours d'une expérimentation. La moyenne de l'activité électrique générée par le traitement des stimuli visuels sera calculée pour l'ensemble des essais de la tâche. La N2pc sera obtenue par la soustraction de l'activité électrique moyenne ipsilatérale à la cible, de l'activité électrique moyenne controlatérale à la cible de chacune des paires d'électrodes latéralisée.
Ainsi, dans l'appellation «N2-p-c», le «p» signifie qu'une activité électrique est observée à la région postérieure du scalp. Le «c» indique que cette activité postérieure est supérieure aux électrodes controlatérales à la position de la cible
que celle observée aux électrodes ipsilatérales à la position de la cible. Le «N»
fait référence à la négativité obtenue de par la soustraction de la courbe
ipsilatérale de la courbe controlatérale et le «N2» renvoi au moment où cette activité est observée, soit approximativement au même moment (180 ms à 300 ms) que les autres composantes de la famille des «N2». Cependant, cette composante n'est pas associée aux autres caractéristiques de cette famille (Luck
& Hillyard, 1994a).
Électrodes postérieures ipsilatérales à la cible. ~'"
'"
'"
Cible dans le champ visuel gauche.'" '"
'" '"
'" '"
Distracteur dans le champ visuel droit. Électrodes postérieures controlatérales à la cible.19
Luck et al. (1997) ont démontré que dans une tâche en recherche visuelle, l'amplitude de la N2pc était généralement plus grande pour une cible présentée dans le champ visuel inférieur que pour une cible présentée dans le champ visuel supérieur. Cette différence pourrait découler, d'abord, de la position des stimuli visuels dans l'espace en fonction des voies empruntées par l'information pour être relayée au cortex visuel. En effet, après avoir été captée par la rétine, la majorité de l'information visuelle provenant du monde visuel est envoyée au corps genouillé latéral du thalamus pour parvenir au cortex visuel primaire (V 1) du lobe occipital. Les premiers traitements de l'information visuelle ont lieu dans l'aire VI ; cependant cette information n'est pas directement utilisable dans le monde visuel (Luck et al., 1997). Le cortex visuel primaire envoie une grande proportion de ses connexions au cortex visuel secondaire (V2) et, par la suite aux autres aires visuelles de plus haut niveau.
Kandel, Schwartz et Jessell (2000) de même que Sereno et al. (1995) ont également démontré des différences entre le champ visuel supérieur et inférieur. Le champ visuel supérieur aurait davantage de projections dirigées vers la portion ventrale du cortex visuel tandis que le champ visuel inférieur aurait un plus grand nombre projections dirigées vers la portion dorsale du cortex visuel. Cette segmentation quant aux différents relais des informations visuelles pourrait soutenir un début d'explication quant à l'effet du champ visuel sur l'amplitude de la N2pc.
Selon Luck et al. (1997), l'activité électrique provenant des voies dorsales du système visuel serait plus près du crâne (et peut-être mieux orientés) que l'activité provenant des voies ventrales. En effet, l'activité provenant des voies dorsales serait mieux captée par les électrodes occipitales (e.g. P07 et P08) que l'activité provenant des voies ventrales.
Une autre raison a été proposée pour expliquer l'effet du champ visuel sur l'amplitude de la N2pc, le déploiement de l'attention pourrait être davantage important pour un stimulus se situant dans le champ visuel inférieur que supérieur. Selon He, Cavanagh et Intriligator (1996) une asymétrie fonctionnelle existerait quant à l'attribution de l'attention; plus d'attention serait déployée dans le champ visuel inférieur que supérieur. Ils ont suggéré que cela émanait d'une asymétrie anatomique de la représentation des champs visuels dans le cortex visuel primaire de l'homme. En effet, Maunsell et Newsome (1987) ont trouvé davantage de projections entre les aires visuelles primaires vers la région pariétale pour le champ visuel inférieur que pour le champ visuel supérieur.
Quelle que soit l'explication de l'effet de la position sur l'amplitude de la N2pc (déploiement inégale de l'attention ou d'une limite technique de l'EEG), ce qui nous intéresse pour l'instant est le consensus quant à l'obtention d'un effet de la position dans le cortex visuel sur l'amplitude de la N2pc.
21
LaSPCN
Une autre composante négative des PRE visuels, la SPCN (Sustained Posterior Contralateral Negativity), est souvent détectée dans la région postérieure du cerveau à la suite de la N2pc. La SPCN s'observe approximativement 300 ms après la présentation d'une cible dans une tâche en recherche visuelle. Les caractéristique de cette composante sont sensiblement les mêmes que celles de la N2pc. Ainsi, l'activité électrique de la SPCN, est de plus faible amplitude du côté ipsilatérale à l'hémi-champ dans lequel la position du stimulus est encodée comparativement à celle du côté contalatéral à l'hémi-champ dans lequel la position du stimulus est encodée. La SPCN est obtenue par la soustraction de l'activité ipsilatérale à l'activité controlatérale à la cible encodée, pour chacune des paires d'électrodes latéralisées. Selon certains auteurs (e.g. Klaver, Talsma, Wijers, Heinze & Mulder, 1999) ; Jolicoeur, Sessa, Dell' Acqua, & Robitaille, 2006a, 2006b) la SPCN reflèterait la présence d'items visuels dans la MVCT.
Todd et Marois (2004), suggérèrent que le principal emplacement neuronal de notre représentation mentale du monde visuel serait situé dans le cortex pariétal postérieur et occipitaL En effet, l'activité observée dans le cortex pariétal postérieur et occipital semble sensible principalement durant le maintien de l'information.
Vogel et Machizawa (2004) ont également investigué la MVCT. Ils ont rapporté une activité électrophysiologique négative qui apparaissait
fréquemment à la suite de la N2pc. Ils attribuèrent à cette activité, similaire à la
SPCN, le nom de « Contralateral Delay Activity » (CDA). Cette composante se
traduisait par une grande négativité au-dessus de l'hémisphère controlatéral à l'hémichamp mémorisé, principalement au-dessus des régions postérieures pariétales et latérales occipitales du cerveau. Selon eux, la CDA pourrait refléter l'encodage et le maintien de la représentation des informations en MVCT. Le nombre d'items mainténus en mémoire semble moduler l'amplitude de la CDA et sa durée temporelle semble correspondre à la durée de l'activité en MVCT.
Les hypothèses de recherches
Le but de cette étude était de vérifier l'hypothèse stipulant que la SPCN reflète un mécanisme de maintien d'informations de la MVCT et que celle-ci est dissociable de la N2pc, associée au déploiement de l'attention visuo-spatiale. Un des moyens pour parvenir à cet objectif était de tenter de moduler de manière indépendante ces deux composantes afin de permettre leur dissociation respective. C'est dans une tâche de détection de changement que trois stratégies ont été établies pour se rapprocher du but. Le raisonnement est le suivant:
1) Si la SPCN et la N2pc sont effectivement des composantes distinctes, il est probable que celles-ci soient produites par des générateurs neuronaux différents. Ainsi, contrairement à l'amplitude de la N2pc qui est influencée par la position de la présentation (champ supérieur vs. inférieur) des stimuli d'intérêt, l'amplitude de la SPCN pourrait ne pas être aff~ctée (ou être affectée différemment). Cette situation constituerait une preuve neurophysiologique de la dissociation de ces composantes. Ainsi, la position des stimuli a été manipulée par la présentation de ceux-ci soit dans le champ visuel supérieur ou inférieur.
2) Si la SPCN représente effectivement le maintien en MVCT, le nombre d'items maintenus en mémoire devrait moduler l'amplitude de cette composante. Quant à l'amplitude de la N2pc, celle-ci ne devait pas être affectée car cette composante reflète plutôt l'attention visuo-spatiale. Pour évaluer l'effet
du nombre d'items sur ces composantes, le nombre de barres a été varié (segment de ligne horizontale). Ainsi, selon cette hypothèse, les stimuli contenant trois barres devraient produire une SPCN plus grande que les stimuli ne contenant que deux barres.
3) Si la SPCN représente effectivement le maintien en MVCT, la durée de celle-ci devrait être corrélée avec le délai de rétention (le temps imposé à l'observateur entre la fin de l'affichage et le moment où il donne sa réponse) de la tâche expérimentale. La longueur du délai de rétention ne devrait en aucun cas agir sur la N2pc car cette manipulation survient après le moment d'apparition de celle-ci et que le délai de rétention ne devrait agir sur le déploiement visuo-spatial. La SPCN devrait donc durer plus longtemps pour un délai de rétention plus long. Pour évaluer cet effet, la longueur du délai de rétention a été manipulée soit de 450 ms ou de 650 ms.
L'article
Contributions à l'articleÀ priori, l'idée principale de cette recherche, soit la dissociation entre la N2pc et la SPCN, a été exposée par Pierre Jolicoeur. La cueillette et l'analyse des données ont été principalement effectuées par Rosalie Perron. Certaines analyses ont été toutefois poursuivies par Christine Lefebvre. Les premières-versions de l'article ont été élaborées par Rosalie Perron, corrigées et modifiées par Christine Lefèbvre. Quant aux autres auteurs, Nicolas Robitaille, Benoit Brisson, Frédéric Gosselin, Martin Arguin et Pierre Jolicoeur, ils ont collaboré à l'ensemble de cette étude par leurs recommandations, commentaires et suggestions.
Présentation de l'article
Cet article intitulé «Attentional and anatomical considerations for the representation of simple stimuli in visual short-term memory: Evidence from human electrophysiology» a été accepté pour être publié dans un numéro spécial de la revue «Psychological Research ».
Evidence from human electrophysiology.
Rosalie Perron, Christine Lefebvre, Nicolas RobitaiIle, Benoit Brisson, Frédéric
Gosselin, Martin Arguin, & Pierre Jolicœur
Université de Montréal
Correspondance to: Pierre Jolicœur
Département de Psychologie Université de Montréal
Running head: VSTM - Anatomy and Attention
C.P. 6128 Succursale Centre-ville Montréal, Québec, Canada
27
Observers encoded the spatial arrangement of two or three horizontal line segments relative to a square frame presented for 150 ms either in left or right visual field and either above or below the horizontal midline. The target pattern was selected on the basis of col our (red vs. green) from an equivalent distractor pattern in the opposite left-right visual hemifield. After a retention interval of 450 ms or 650 ms a test pattern was presented at fixation. The task was to decide whether the test was the same as the encoded pattern or different. Selection of the to-be-memorized pattern produced an N2pc response that was not influenced by the number of line segments nor by the length of the retention interval, but that was smaller in amplitude for patterns presented in the upper visual field compared with patterns presented in the lower visual field. A sustained posterior contralateral negativity (SPCN) followed the N2pc. The SPCN was larger for patterns with three line segments than for two, was larger for patterns encoded from lower visual field than from upper visual field, and returned to baseline sooner for the shorter retention interval than for the longer interval. These results, and others, provide an interesting and complex pattern of simiIarities and differences between the N2pc and SPCN, consistent with the view that N2pc reflects mechanisms of attentional selection whereas the SPCN reflects maintenance in visual short-term memory.
The main goals of the present research were to investigate the neural basis of selective visual spatial attention and of visual short-term memory, and the relationship between these two important cognitive functions in the
neurologically intact adult human brain. We used the event-related potential (ERP) method to analyze the electroencephalogram recorded while observers performed a task that required both visual selection based on colour and the encoding and retention of simple visual patterns in the context of a task designed to isolate visual short-term memory (VSTM). The N2pc component was used to index the moment-to-moment deployment of visual spatial
attention. The SPCN (sustained posterior contralateral negativity) was used to index encoding and retenti on in VSTM.
The N2pc is an ERP component that has been argued to reflect the locus of visual spatial attention (Eimer, 1996; Luck & Hillyard, 1994a, 1994b; Luck, Girelli, McDermott, & Ford, 1997). This component is observed typically about 180-270 ms after target onset and is computed by taking the voltage difference between corresponding pairs of electrodes over left and right posterior scalp (e.g., P07 and P08), taking into account the hemifield in which attention is deployed. The voltage at the electrode on the contralateral side relative to the attended hemifield is more negative than the voltage at the ipsilateral electrode. Usually, researchers compute an average contralateral waveform by averaging the voltage at the right-sided electrode (e.g., P08) when attention is deployed to the left with the voltage at the left-sided electrode (e.g., P07) when attention is deployed to the right. An average ipsilateral waveform is computed by
29
averaging the voltage at the left-sided electrode when attention is deployed to the left with the voltage at the right-sided electrode when attention is deployed to the right. In a final step, the ipsilateral waveform is subtracted from the contralateral waveform, yielding the N2pc waveform. The name of this component, N2pc, thus signifies a negative-going deflection in the "N2" time range (180-270 ms) that is largest at posterior "p" scalp sites and contralateral "c" to the location of the attended visual item. The designation "N2" is not meant to associate this component with other N2 components, but rather merely indicates the approximate time range of the component (Luck & Hillyard,
1994a).
The N2pc has proven to be a sensitive measure of the locus of visual spatial attention in visual search (e.g., Luck & Hillyard, 1994a, 1994b;
Woodman & Luck, 2003), under dual-task conditions, such as the attentional
blink (e.g., Dell'Acqua, Sessa, Jolicœur, & Robitaille, 2006; Jolicœur, Sessa,
Dell'Acqua, & Robitaille, 2006a, 2006b; Robitaille, Jolicœur, Dell'Acqua, &
Sessa, 2007) or the psychological refractory period (e.g., Brisson & Jolicœur,
2007a, 2007b), and under conditions where attention could be captured by distracting peripheral stimuli (e.g., Hickey, McDonald, & Theeuwes, 2007;
Kiss, Jolicoeur, Dell' Acqua, & Eimer, 2008; Leblanc, Prime, & Jolicœur,
2008).
In many experiments designed to elicit the N2pc researchers have also found a slower and later wave in the contralateral-minus-ipsilateral waveforms. We will refer to this ERP component as the SPCN (sustained posterior
contralateral negativity; e.g., Jolicœur et al., 2006a). Jolicœur et al (2006a, 2006b) suggested that the SPCN reflects information storage in VSTM, des pite the fact that their experiments were not specifically designed to study memory. J olicœur and colleagues argued that passage through VSTM was required in order for visual stimuli to make contact with mechanisms that exercise cognitive control over subsequent behaviour. As for the N2pc, the SPCN is observed following the visual encoding of a stimulus presented off the vertical midline, either in the left or right visual field. In order to deconfound memory encoding from low-Ievel stimulus differences, the target stimuli in one visual field are presented with an equivalent set of distractor stimuli in the other visual field. Klaver, Talsma, Wijers, Heinze, and Mulder (1999) were the first to argue that the SPCN reflects activity specifically related to encoding and retenti on in VSTM, a view that received additional support from the elegant work by Vogel and colleagues (Vogel & Machizawa, 2004; McCollough,
Machizawa, & Vogel, 2007). Importantly for present purposes, Vogel and
colleagues showed that the amplitude of the SPCN increased as the number of target items is increased, reaching a maximum when the number of stimuli to be encoded equalled or exceeded the estimated capacity of VSTM (on a subject-by-subject basis; Vogel & Machizawa, 2004). There is also a strong
association between the probability of a correct response and the amplitude of the SPCN in several studies (e.g., Dell'Acqua et al., 2006; Jolicœur et al., 2006a, 2006b; Robitaille et al., 2007).
31
Given that the N2pc and SPCN are observed following the same
contralateral minus ipsilateral waveforrn subtraction, just at different times, one may wonder whether the SPCN is simply additional activity of the same sort as that which generated the N2pc. In other words, is the SPCN a reflection of additional activity due to spatial attention, as opposed to activity associated with VSTM, as some have argued? Jolicœur, Brisson, and Robitaille (2008) examined this issue by varying the number of items to be encoded in a task requiring an immediate response. They found an effect of the number of items on the amplitude of the SPCN and the absence of a similar effect for the N2pc. One goal of the present study was to provide further evidence for the daim that the SPCN is a component distinct from N2pc that reflects primarily activity in VS TM whereas N2pc reflects spatial attention. Thus, one goal was to
dissociate these two ERPs. To achieve that goal, we first addressed a possible methodological confound that could provide an alternative, attentional account of the SPCN. Then, we used two different manipulations to link the SPCN to VSTM.
In the work of Vogel and colleagues, the test items were always presented at the same, lateralized location as the memory items (Vogel &
Machizawa, 2004; McCollough, Machizawa, & Vogel, 2007). Thus, the
resulting SPCN could reflect the maintenance of stimuli in VSTM at that particular location, or simply be the result of sustained attention to a lateralised location, resulting in a prolongation of the N2pc. We therefore designed our experiment specifically to discourage subjects from maintaining attention at the
location of encoding, by al ways presenting the test array at fixation instead of at the lateralised memory location. Consequently, the most important spatial location immediately following encoding of the memory items was the region around the fixation point. Sustained attention to the central fixation point could not yield an SPCN, because of the lateralised nature of this compone nt. We note that Klaver et al. (1999) tested memory for polygons either at the same location, or on the opposite side relative to side of encoding and nonetheless found an SPCN, suggesting that anticipating a test shape at the same location on aIl trials is not necessary in order to observed the SPCN, and one might argue that their procedure would have encouraged subjects to attend to the middle or to spread attention to the en tire display in anticipation of the test array.
Nonetheless, in 50% of their trials the memory probe was on the same side as the encoded shape, and this may have been sufficient to encourage subjects to maintain an attentional focus on that side (with attention shifting to the other side when required). As such, our procedure provides a stronger test because the test array was never presented at the site of the memory array, providing no reason to maintain attention at that location, unless part and parcel of the creation and maintenance of a visual memory require continued attention at the spatial locations of encoded items.
We also used two strategies to link the SPCN with VSTM. First, we manipulated the number of items to be encoded and retained in the memory task. The stimuli consisted of two or three small horizontal bars in a square frame, illustrated in Figure 1. Based on previous research (e.g., Jolicoeur et al
33
2008; Vogel & Machizawa, 2004), we anticipated that the amplitude of the
SPCN would be greater for three bars than for two bars, to the extent that observers encoded them as distinct objects within the frame. At the same time . we could determine whether the N2pc was also affected by this manipulation. Here we expected that the N2pc would likely not vary in amplitude as a function of the number of items to be encoded. This pattern of results greater SPCN amplitude for three bars than two, with no difference for N2pc -would constitute a dissociation of SPCN from N2pc in terms of the effects of the quantity (or perhaps complexity) of the information to be encoded and retained in VSTM.
INSERT FIGURE 1 ABOUT HERE
The second way of providing a link between retention in VSTM and the SPCN was to vary the duration (450 vs. 650 ms) of the retenti on interval (the time between the termination of the memory array and the onset of the test array). On the assumption that observers would maintain a representation of the memory array only as long as necessary, we expected that the SPCN would return to baseline earlier (by about 200 ms) for the shorter retention interval than for the longer one, sorne time after the presentation of the test array. The N2pc should not be affected by the retention interval because this manipulation occurred ·after the usual time range of the N2pc.
There is a final way in which the SPCN and the N2pc could be
distinguished. Luck et al. (1997) found that N2pc amplitude was sm aller when the items in the search array were in the upper visual field compared to
equivalent items in the lower fiel~. One account of this difference is based on the way in which receptive fields of visually-sensitive cells project to primary and secondary visual cortex depending on the position of the stimuli in visual space. Stimuli in the upper visual field project from the retina to more ventral portions of the primary visual cortex (not to be mistaken with the ventral stream) whereas stimuli in the lower visual field project from the retina to more dorsal portions of the primary visual cortex (Kandel, Schwartz, & Jessell, 2000; Sereno et al., 1995). This anatomical distinction is maintained, although less so, in other (later) visual areas. One interpretation of the effect of visual fields on the amplitude of the N2pc is that projections to neural generators in more dorsal portions of visual cortex are doser and/or perhaps oriented more
optimally to produce large potentials at typical posterior electrode sites such as P07 and P08. In contras t, stimulation of the upper visual field would lead to
the activation of more distant (and perhaps less optimally oriented) generators in visual cortex, leading to smaller voltages at occipital electrodes. Another account that has been proposed hinges on the notion that attentional
mechanisms receiving projections from the upper versus lower visual fields are different, with higher spatial resolution for the lower visual field than or the upper visual field (He, Cavanagh, & Intrilligator, 1996). Based on several psychophysical results differentiating performance for stimuli in the upper
35
versus lower visual field, but not for adaptation believed to occur in VI, He, Cavanagh, and Intriligator (1996) argued that an attentional filter acts beyond the primary visual cortex, in one or more higher visual cortical areas, with different filter characteristics for upper and lower visual field inputs. The evidence suggests a functional asymmetry in the allocation of the attention in favour of the lower visual field (better spatial resolution in lower visual field compared to upper), and perhaps this is the result of an anatomical difference between projections from VI to the dorsal versus ventral paths in early visual processing. This could be taking place very locally, rather than at the scale of the larger ventral-dorsal distinction associated with the what-where distinction, although, for example, Maunsell and Newsome (1987) found more numerous projections between early visual areas to parietal region for the lower visual field than the upper visual field.
Although we cannot yet determine whether the difference in the amplitude of the N2pc for upper versus lower visual field stimuli is due to simple anatomical differences in terms of direct projections from the retina to early visual cortex (ventral vs. dorsal projections for VI and V2; Luck et al., 1997) or to more complex wiring differences across cortical areas representing upper and lower visual fields in terms of connections to other brain regions, implementing different attentional filtering properties (He et al., 1996), this is not critical. We know of no experimental work that has examined the effects of upper versus lower visual field encoding on the SPCN, and presumably on the
representation of objects in VSTM. This was one of the key manipulations in the present work. Stimuli to be encoded in VSTM were presented either in the upper or lower visual hemifield. We expected this manipulation to have a large impact on the amplitude of the N2pc (replicating results of Luck et al., 1997), and we sought to discover whether this manipulation would have any effect on the SPCN. If the SPCN is not affected by the upper/lower field manipulation but the N2pc is, as expected, then we would conclude that the N2pc and SPCN are generated by different neural generators because this would constitute an obvious neurophysiological dissociation. If both the N2pc and SPCN are affected, in similar ways, by the upper/lower visual field manipulation,
however, then the interpretation would be more complex. Given the convincing prior evidence for a functional difference between these components
(corroborated further by results of the present work), we might conclude that the same neural generators produce the observed activity (N2pc and SPCN), but that they perform different functions at different times. We will discuss these possibilities at greater length in the Discussion section of the article.
METHODS Participants.
Twenty-three undergraduate student volunteers were tested and paid for their participation. They reported no history of neurological problems, normal or corrected-to-normal acuity, and normal colour vision. Signed informed consent was provided by each participant prior to participation. Ten subjects were excluded because their electroencephalogram (EEG) included too many
37
artefacts (as explained in details in the electrophysiological recording section); leaving thirteen subjects (nine females, four males, ranging from 20-26 years in age). AH females and one male were right-handed.
Stimuli.
The stimuli were displayed on a 17-inch colour cathode-ray tube (CRT) controlled by a microcomputer running E-prime 1.04 software. The stimuli were two outline white squares (two frames), presented at the same time, each containing horizontal bars. The center of each frame was located 3.0° above or below and 3.2° on the left and right of the fixation point (at a distance of 57 cm from the computer screen). Each frame subtended a visual angle of 5.0°. A fixation point (0.2°) was present at the center of display. The layout is illustrated (not to scale) in Figure 1.
In a given trial, the two frames were presented in the upper visual field or the lower visual field, randomly from trial to trial. Each frame in a trial contained the same number of bars, two or three (varied randomly from trial to trial). The total number of pixels in two and three bar displays was the same and thus bars in two-bar and three-bar displays had different lengths, but the overall stimulus energy was the same. The position of each bar in each frame was randomly generated at run time, under following constraints: the bars did not have the same position, did not go outside of the frame, or overlap other bar(s), the vertical distance between two bars had a minimum of 0.02°.
The target was defined by bar colour: red for half of the participants and green for other half, counterbalanced across subjects. The green and red bars were always in opposite visual field. The relevant side changed randomly from trial to trial. The colours of the bars were approximately equiluminant to equate their early sensory responses. The luminance of the stimuli was
measured with a Minolta CS-IOO chroma meter. The luminance of the green color was 26 cd/m2 (CIE xy coordinates of x = .297, Y
=
.579; Wyszecki &Stiles, 1982), red was 26 cd/m2 (x = .391, Y = .282), the fixation point and
frame were 26 cd/m2 (x = .276, Y = .271) and luminance of the background was
.70 cd/m2 (x = .249, Y
=
.271).Procedure.
The participant was seated at a distance of 57 cm from the computer screen in a dark electrically shielded chamber. The space bar on the keyboard was pressed to start each trial. After trial initiation, a fixation point appeared in the center of the screen followed by the memory stimulus array. As iIlustrated in Figure 1, the memory array consisted of a 150 ms symmetric bilateral display of two white frames - one containing green bars; the other containing red bars. After the offset of the visual display, a delay of 450ms (short-retention
condition; 600 ms, stimulus onset asynchrony (SOA» or 650ms (long-retention condition; 800 ms SOA) was imposed, followed by the presentation of a probe displayat fixation. The retention interval (450 or 650 ms) varied randomly from trial to trial. The fixation point remained visible during the retenti on interval.
39
The memory probe array was a white frame with bars in the target colour. Participants were instructed to decide whether probe bar positions were identical (in the positions of all bars) or different from the memory array, as fast as possible, while making as few errors as possible. When different, the probe display varied from the memory display in the position of one bar. When different, one bar was moved by a minimum of 20 pixels, (visual angle of .7°) but remained inside the white frame. The trials in which a bar position was changed represented 50% of trials (randomly throughout the experiment). Participants responded with the right hand using a specific key on the numeric keypad of a computer keyboard when target and probe were identical (the key was "1") and another key when they were different (the key was "2"). Accuracy feedback was provided at the end of each trial. A plus sign appeared wh en participant made a correct response and a minus sign wh en they made an error. Participants pressed the space bar on the keyboard to start the next trial. Each subject performed one practice block of 64 trials followed by 15 experimental blocks of 64 trials for a total of 960 experimental trials. Participants were required to maintain fixation on the centrally located point throughout each trial. They were instructed to blink and move their eyes only between trials.
EEG RECORDING AND DATA ANALYSIS
EEG recordings were made with a Biosemi Active-two system, with 64 active Ag-AgCI scalp electrodes positioned using the Intemational10-10 system: Fp1, Fp2, Fpz, AF3, AF4, AF7, AF8, AFz, FI, F2, F3, F4, F5, F6, F7,
F8, Fz, FCl, FC2, FC3, FC4, FC5, FC6, FCz, Fr7, Fr8, Cl, C2, C3, C4, C5, C6, Cz, T7, T8, TP7, TP8, CPl, CP2, CP3, CP4, CP5, CP6, CPz, Pl, P2, P3, P4, P5, P6, P7 , P8, P9, PlO, Pz, P03, P04, P07, P08, POz, 01, 02, Oz, Iz. In
addition, activity was also recorded at the two mastoids. The EEG was algebraically re-referenced to the average of the left and right mastoids during post-recording analyses. The electrooculogram (EOG) was recorded with active Ag-AgCl electrodes placed at the left and right canthi (HEOG) and above and below the left eye (VEOG). The horizontal electrooculogram (HEOG) was obtained by subtracting the signal at the left electrode from the signal recorded at the right electrode. The vertical electrooculogram (VEOG) was obtained by subtracting the signal at the electrode above the left eye From the signal at the electrode below the left eye. For three participants, the vertical
electrooculogram (VEOG) was obtained by subtracting the signal at FPl, above the left eye, from the signal at the electrode below the left eye. The signaIs were amplified, low-pass filtered with a cut-off frequency of 67 Hz, and digitized at 256 Hz during the recordings.
During post-recording analysis, a 5 Hz, 48db Hz low-pass fil ter was applied to the HEOG and VEOG waveforms, white a filter with a 0.1 Hz, 12 db high-pass was applied to aIl electrode waveforms. A derivation of more than 50 Il V over 100 ms in the VEOG was considered as an eye blink A derivation of more than 35 Il V within a period of 200 ms (> 20
, Hillyard & Galambos,1970
41
the HEOG was considered as an eye movement. Trials with incorrect responses, eyes blinks, or eyes movements, were removed during post-recording analysis. The remaining trials were submitted to a final inspection, where a derivation of more than 100 J.l V over 200 ms during a trial was considered an artefact, and trials with such artefacts were removed from the average for this electrode.
Participants were excluded from behavioural and electrophysiological analyses if the trials with incorrect responses, eyes blinks, eyes movements, and artefacts represented more than 40% of the trials. For each participant and each condition we also computed an average HEOG waveform for trials on which the memory items were on the left and an average for trials on which the
memory items were on the right. Participants were also excluded if the average HEOG waveform for left or right trials exceeded residual 3.0 jlV,
corresponding to an eye movement of about 0.20
in the direction of the to-be-encoded items (Hillyard & Galambos, 1970; Lins, Pieton, Berg & Scherg,
1993; see Luck, 2005 for a review). Eight participants were excluded because of eye movements toward the memory items exceeding 0.20
and one participant was excluded because eyes blinks contaminated too many trials. One
participant was excluded from the analysis because a technical problem resulted in the loss of more than 50% of this subject' s data.
In most analyses we segmented the continuous EEG starting 200 ms prior to, and ending 1100 ms after, the ons et of the memory array. The EEG at each electrode was baseline corrected by subtracting the mean voltage during the 200 ms pre-stimulus period from the voltage during the entire segment. The
EEG from artifact-free trials was averaged, separately for each condition, as detailed below. However, evaluation of the effects of the retention interval manipulation required longer segments (-200 to 1800 ms, relative to the onset of the memory array). Unfortunately, many subjects had a tendency to blink, or move their eyes, towards the end of the trials, and lengthening the segments caused the rejection of a very large proportion of trials for several subjects. To deal with this issue, we analyzed the data differently for the analyses focusing on the manipulation of the duration of the retenti on interval. For these analyses only, after removing trials contaminated by eye movements, we did not reject trials with blinks, but instead corrected the EEG using the Gratton-Coles algorithm (Gratton, Coles, & Donchin, 1983), which enabled us to retain a
sufficient number of trials. Although we prefer to reject trials contaminated with ocular artefacts, here we adopted a simple correction procedure and compared the waveforrns obtained in analyses in which artefact trials were rejected with the waveforms obtained after the application of the correction procedure. The general appearance of the waveforms was not changed, suggesting that the application of the ocular artefact correction procedure did not distort the waveforrns signifièantly. No formaI test was used to test the effect of the ocular correction. As will be described in full details below, the N2pc and the SPCN are lateralized components resulting from the subtraction of activation measured on one side from the activation measured on the other side of the scalp. Eye blink artefacts, however, are bilateraL Therefore, even if the correction did not completely remove eye blinks, and residual artefacts were
43
still present in the posterior sites that are of interest in this paper, it would not have an effect on the N2pc or the SPCN. Indeed, the bilateral residual
activation would be cancelled in the subtraction of one side from the other. The N2pc and SPCN waveforms were obtained by subtracting the average ipsilateral waveform from the average contralateral waveform, for each lateralized electrode pair, using the following formula:
V N2pc,SPCN
=
~
(V left Stinr-right + V right Stinr-left ) -~
(V left Stinr-left + V right Stinr-right )where Vleftstim-right is the voltage at a left-sided electrode (e.g., P07) for
trials on which the to-be-encoded bars were in the right visual field.
The N2pc was quantified by computing the mean voltage in a window of 180-270 ms relative to the onset of the memory array. The SPCN was generally quantified by computing the mean voltage in a window of 450-600 ms from the onset of the memory array. However, there were a number of other measures used to highlight various aspects of the SPCN, and these are described in the Results section.
RESULTS
The analyses are reported in two sections: behavioural and electrophysiological results. Only the trials with a correct response were analysed in reaction time and electrophysiological results.
Behavioural results.
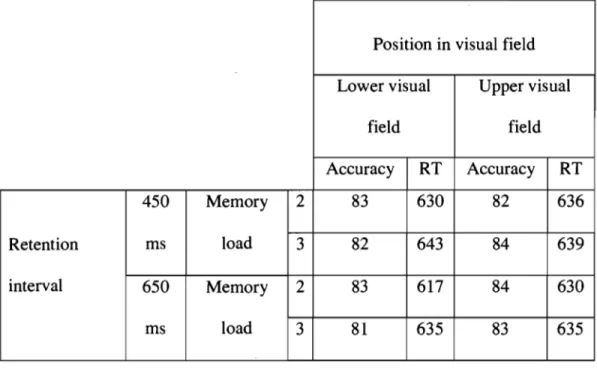
Both success rate and reaction time were analysed. For each measure we performed an ANOV A in which position (upper vs. lower field), memory load (two vs. three bars), and retention interval (450 vs. 650 ms) were treated as within-subjects factors. Mean accuracy and mean reaction time are shown in Table 1. The only statistically significant effect was the main effect of number of items in the analysis of response times; the mean RT was 628 ms when verifying memory for 2 bars and 638 ms when verifying memory for 3 bars,
F(l, 12) =11.92, MSE = 225.8, p < .01. AlI other Fs were smaller than 2.20,
while aIl Fs for accuracy data were smaller than 2.13. These results suggest a slightly longer process of comparison when more bars were to be retained in memory.
INSERT TABLE 1 ABOUT HERE
Electrophysiological results.
Initial electrophysiological analyses examined mean amplitudes
measured for the six posterior lateralized electrode pairs: (01,02), (P03, P04), (P3, P4), (P5, P6), (P7, P8), and (P07, P08). The N2pc and SPCN had a maximum voltage at (P07, P08), and so we performed aIl further analyses for the waveforms measured at these sites.
Figure 2, top panel, shows the ipsilateral and contralateral waveforms for the electrodes P07 and P08 for aIl conditions and the bottom panel shows
45
the grand average difference N2pc/SPCN waveforms at P07IP08 for ail conditions. It is clear that the experiment produced a clear-cut N2pc followed bya long-lasting SPCN. The impact of our experimental manipulations on these components is examined in detail in the following paragraphs.
INSERT FIGURE 2 ABOUT HERE
The mean N2pc and SPCN amplitudes were submitted to a three-way ANOVA where component (N2pc vs SPCN), memory load (2 or 3) and visual field (upper vs lower) were ail within-subject factors. White we have no
specifie hypothesis for the effect of visual field on the SPCN, we expect stimuli presented in the lower visual field to yield a larger N2pc than stimuli presented in the upper visual field. We also expect that a higher memory load will create a greater SPCN, but that factor will not have an effect on the size of the measured N2pc, therefore producing at least an interaction between component and memory load. As can be anticipated from the observation of Figure 3, the ANOVA yielded a three-way interaction, F
0,
12) = 5.01, MSE = Il, p < .046. There was no main effect of component, F0,
12)=
.01, MSE=
2.62, p>
.972, nor memory load, F (1, 12)=
1.6, MSE=
.81, p > .229. Since we are mostly interested in the differential effect of load and visual field on the N2pc and SPCN, we decomposed the interaction separately for the N2pc and the SPCN.INSERT FIGURE 3 ABOUT HERE
N2pc. As we expected, there was no main effect of memory load on the N2pc, F (1, 12)
=
.07, MSE=
.67, p > .800. However, there was a main effect of visual field, F (1, 12)=
25.59, MSE=
.29, p < .001) stimuli in the lower visual field (-1.51JlV) generating a larger N2pc than stimuli presented in the upper visual field (-0.75JlV). The interaction between memory load and visual field was not significant, F (1, 12)=
2.68, MSE=
.24, p > .127.SPCN. As expected from the overall interaction, the pattern of results for the SPCN differed from that of the N2pc. Contrary to the N2pc, there was an interaction between memory load and visual field. Decomposition of this interaction revealed that the memory load effect was significant in the lower visual field, F (1, 12)
=
8.72, MSE=
0.60, p < .013, a memory load of 3yielding a larger SPCN ( -1,93 J..l V) than a memory load of 2 (-1.03 J..l V), but not
for the upper visual field, a memory load of 2 yielding a slightly larger SPCN
(-0.81 Jl V) than a memory load of 3 (-0.69 J..l V), F (1, 12)
=
0.48, MSE=
0.20, p>.503 . Note that this interaction could not be due to the absence of an SPCN in the load 2 condition: at-test revealed that the mean amplitude during the 450-600ms interval was significantly different than 0, t(12)
=
-2.95, P < .01347
Retention interval (450 vs. 650 ms). We examined the effects of the
duration of the retenti on interval by segmenting the EEG into longer segments (-200 to 1800 ms relative to the onset of the memory array) than for the previous analyses. As explained earlier, rather than exclude trials with ocular artefacts we applied a correction algorithm. The corrected EEG was then averaged separately for each retenti on interval. These curves were baseline corrected based on the mean amplitude in a window of 400-600 ms (200 ms prior to the presentation of the test array, at the shortest retention interval). We chose this new baseline to equate the curves as much as possible just prior to when they might start to deviate from each other, given that, in princip le, aIl conditions were identical up to that point. The resulting curves, given that they start from a time during which the SPCN was in full force, should deviate toward the positive when the SPCN retums to baseline.
The grand average ERPs resulting from these procedures are shown in Figure 4. The reader will note that the data were filtered in a lowpass, 3Hz, 48dB/o, in accordance with the J ackknife procedure. The waveform for the short retention interval condition deviates toward the positive about 200 ms earlier than the waveforms for the long retention interval. We used ajackknife approach to determine whether the waveforms retumed to baseline at different latencies for the two retenti on intervals. In the jackknife approach each of the n
subjects was removed once from n grand average based on n - 1 subjects (see Kiesel, Miller, Jolicœur, & Brisson, 2007; Miller, Patterson, & Ulrich, 1998;
estimated, for each jackknifed waveform, the latency at which the waveform crossed a voltage of .6 Il V separately for the short and long retention interval waveforms, and subjected these estimates to an ANOV A that considered
,
retention interval as a within-subjects factor. Given that the measurements are taken on a curve that includes virtually the same subjects, the variance of the resulting set of measurements is smaller than the variance of the measurements that would have been obtained from each individual subject curves. The results of the ANOVA were therefore corrected to take into account the smaller
variability of the jackknifed estimates (see Miller, Patterson, & Ulrich, 1998;
Ulrich & Miller, 2001). The analysis confirmed that the SPCN returned to
baseline earlier in the shorter retention interval condition (mean = 1092ms)
than in the longer retention interval condition (mean
=
1296ms), F(1, 12)=
11.73, MSE = 159.78, p < .006.
INSERT FIGURE 4 ABOUT HERE
In Figure 5 we show maps of the distributions of mean voltage during the N2pc (170-280 ms) and SPCN (450-600 ms). The voltage maps were quite similar across the N2pc and SPCN, suggesting that the neural generators of the two components are both in posterior visual areas.
49
DISCUSSION
In this study we used a paradigm that combined a simple visual spatial task with a VSTM task. Stimuli to be encoded in VSTM first had to be selected from a more complex display on the basis of a pop-out colour (e.g., green) from one side of a left-right bilateral display in which an equal amount of distractor information (e.g., in red) on the other side was to be ignored. The purpose of this manipulation was to induce a c1ear and distinct N2pc component on the basis of the deployment of visual spatial attention to the to-be-memorized items, which could, in princip le, be isolated from the later expected SPCN component associated with maintenance in VSTM (e.g., Jolicœur et al., 2006a, 2006b; Vogel & Machizawa, 2004). In previous work (e.g., Klaver et al., 1999;
Vogel & Machizawa, 2004) focusing on VS TM, the relevant information was
cued weIl ahead of the onset of the memory array, making the isolation of N2pc from SPCN more difficult. As can be seen in Figure 2, our procedure was successful in eliciting distinct N2pc and SPCN waves, enabling us to target analyses on each component designed to evaluate the impact of our
experimental manipulations.
VSTM was tested by presenting a pattern at fixation (Figure 1). This aspect of the experimental design was intended to require a deployment of visual spatial attention in the region surrounding the fixation point, at the time of the memory test. If the SPCN reflected ongoing deployment of visu al spatial attention at the location of previously encoded visual objects - in other words a prolonged N2pc - rather than a distinct component reflecting activity in
VSTM, then the SPCN should have disappeared 600 ms after the onset of the memory array. because this was the time at which the test array was presented in half of the trials (short retention interval condition). As can be seen in Figure 6. the SPCN waves began to attenuate significantly (indicated by a positive-going shi ft in Figure 6) long after the presentation of the test array. for both retention interval conditions. If the SPCN was just a long N2pc, presenting the test array at fixation would cause a disappearance of the SPCN about 200 ms following the onset of the test array (because the test array was at fixation. and neither in left nor right visual field, attention to this stimulus cannot generate an N2pc). Thus, the fact that the positive-going shifts in Figure 4 begin long after an expected cancellation of the N2pc. associated with a shift of attention towards fixation, provides further evidence for the distinctive nature of the SPCN. This finding suggests that the SPCN reflects activity specifically related to VSTM, rather than ongoing visual spatial attention.
We gathered more evidence of the association between the SPCN and VSTM through our manipulation of the retenti on interval. We used two different retenti on intervals to test whether the SPCN would return to baseline later with a longer retention interval, which it did. Moreover, the difference in return to baseline was about the same (204 ms) as the difference between intervals (200ms). If we assume that stimuli are maintained in VSTM only as long as necessary, then this pattern of return to baseline is consistent with a link
51
The SPCN was also influenced by the number of items in the memory array, the larger memory load yielding a greater SPCN, whereas the N2pc was not influenced by memory load, as shown in the decomposition of the three-way interaction. This difference constitutes a clear functional dissociation between the two components, as weil as evidence in favour of a link between VSTM and the SPCN~
However, the interaction of memory load with visual field, for the SPCN, makes the portrait a bit more complex, and will be discussed below. As can be seen in Figure 2, the field of presentation of the memory array (upper vs. lower visual field) had a major impact both on the amplitude of the N2pc and of the SPCN. The lower N2pc amplitude for upper visual field stimuli was
expected on the basis of results of Luck et al. (1997). Here we show for the first time that the amplitude of the SPCN is also affected in a very similar way by presentation in the upper versus lower visual field. This finding is
important because it shows that the anatomical, and/or attentional, field effects that influence the N2pc also have a commensurate impact on the SPCN. AIso, the effect of the field of presentation (upper vs. lower) was similar across the components, suggesting that the neural generators of the N2pc and of the SPCN are structured in the same orientation relative to the recording electrodes, with receptive fields in upper versus lower visual fields projecting to more ventral and dorsal portions of visual cortex, respectively. Perhaps the very same generators are involved but they perform different functions at different times. The N2pc might reflect an initial deployment of attention to the general region