HAL Id: hal-00270440
https://hal.archives-ouvertes.fr/hal-00270440
Submitted on 4 Apr 2008
HAL is a multi-disciplinary open access
archive for the deposit and dissemination of
sci-entific research documents, whether they are
pub-lished or not. The documents may come from
teaching and research institutions in France or
abroad, or from public or private research centers.
L’archive ouverte pluridisciplinaire HAL, est
destinée au dépôt et à la diffusion de documents
scientifiques de niveau recherche, publiés ou non,
émanant des établissements d’enseignement et de
recherche français ou étrangers, des laboratoires
publics ou privés.
Motion blur estimation on LCDs
Sylvain Tourancheau, Kjell Brunnström, Borje Andrén, Patrick Le Callet
To cite this version:
Sylvain Tourancheau, Kjell Brunnström, Borje Andrén, Patrick Le Callet. Motion blur estimation
on LCDs. SID International Symposium, Seminar and Exhibition, May 2008, Los Angeles, United
States. pp.P92. �hal-00270440�
P-92 / S. Tourancheau
P-92: Motion Blur Estimation on LCDs
Sylvain Tourancheau ¹, Kjell Brunnström ², Borje Andrén ² and Patrick Le Callet ¹
¹ IRCCyN, Polytech’Nantes, University of Nantes, 44300 Nantes, France
² Video and Display Quality Lab, Acreo AB, SE-16440 Kista, Sweden
[email protected], [email protected]
Abstract
Today there is no requirement concerning LCD motion blur in TCO Requirements ( e.g. TCO'06 Media Displays). The primary goal of this study is to find a measurement method for motion blur which is easy to carry out and gives reproducible results lab to lab. This method should be able to take in account motion blur reduction systems such as backlight flashing. Measurement results and method proposal are given.
1. Introduction
Despite recent improvements to LCD technology such as response time compensation, LCD motion blur remains very annoying for sequences with rapid movements. In fact, even if the response time of a liquid crystal matrix was reduced to zero, motion blur would still appear. This is due to sample-and-hold behaviour of the display; the light intensity is sustained on the screen for the duration of the frame, whereas on a CRT light intensity is a pulse which fades over the frame duration. LCD displays are so called hold-type displays. The main difference happens when the eyes of the observer are tracking a moving object on the screen; for a given frame, the picture is still on the screen while the eye is still moving slightly anticipating the movement of the object. Edges of this object are integrated on the retina while moving, resulting in a blur [1].
The most common metric to characterize LCD motion blur is the MPRT (motion picture response time) [2] and its relative indexes BET and BEW1. A lot of measurement systems have been developed in order to measure MPRT [3], but they are generally quite expensive and complicated to carry out. As a consequence, alternative approaches have been proposed, based on the theoretical analysis of the display spatial and temporal apertures. It has been shown that MPRT can be obtained from the temporal impulse response [4][5] or from the temporal step response [6][7] instead of measuring the blur width spatially. First comparisons between the results of simulation methods and those of measurement systems showed that both approaches are very close [3][8]. However, these investigations only concerned few displays. Further measurements should be done in order to analyse the difference between the results of these two approaches. Today there is no requirement concerning LCD motion blur in TCO'06 Displays [9] and the requirements concerning response time is not sufficient to guarantee a low level of motion blur annoyance. In particular, display devices with impulsive driving techniques to reduce motion blur such as backlight flashing (BF) and black data insertion (BDI) have difficulties to obtain the TCO label concerning response time. Actually, it's difficult to measure response time in a classical way when these motion-blur reduction techniques are present. The primary goal of this study is to find a
1 respectively blurred edge time, blurred edge width.
measurement method of motion blur which is easy to carry out and which can be reproduce from one lab to another assuming the less variations possible of the results. For these reasons, measurement systems such as those using tracking camera are of less interest. Moreover, it could be interesting to relate this motion blur measurement to response time measurements already obtained for TCO'06 Displays, simulation approaches such as the use of temporal step-responses could be useful, especially concerning display with impulse driving techniques.
In this paper, both methods have been carried out. Five displays have been tested and results from both spatial and temporal measurements are compared and discussed.
2. Measurements
Two types of measurements have been studied in this paper. Some spatial measurement of a moving edge have been performed using a high-framerate stationary camera. We also used a number of temporal step-responses, obtained from TCO'06 response-time requirements measurements [9]. The blurred edge profile is obtained from the spatial measurements by motion compensation and temporal integration [3][8]. It can also be deduced from the step-response by convolution with a window having a width of one frame-period [4][7][3][8].
2.1
Spatial measurements of a moving edge
The apparatus used for the experimental measurements consisted in a high-framerate CCD camera and a PC used to control the camera, to store grabbed frames, and to display stimuli on the test display. A JAI PULNiX's Gigabit Ethernet CCD camera, the TM-6740GE, has been used for these measurements. It was linked to the control PC via Ethernet, using a Gigabit Ethernet Vision (GigE Vision) interface which permits to reach high framerate. Its framerate has been set to 1200 Hz with a resolution of 224x160 pixels. The display framerate has been set to 60 Hz, thus we obtain 20 CCD frames for each display frame. The distance between the measured display and the camera has been set precisely in such a way that one pixel on the display array is pictured by 4x4 pixels on the CCD array. This permitted us to obtain a good approximation of the 56x40 pixels of the display by computing the mean of each 4x4 blocks in the CCD frame. One example of frames grabbed by the camera is shown in Figure 1. Stimuli were generated with Matlab on a PC using the PsychToolbox extension [10]. They consist of a straight edge moving from left to right. Three values can be set: the start gray level value Ns which is the gray level of the right part of the screen, the final gray level value Nf which is the gray level of the moving part, on the left of the screen, and the velocity V in pixels per frame. Five gray levels have been used in the measurements: 0, 63, 127, 191 and 255. Thus, 20 transitions have been studied.
P-92 / S. Tourancheau
As mentioned before, the blurred profile was obtained by motion compensation of each CCD frames to simulate the smooth pursuit of the eyes. The high camera framerate and the precise calibration of apparatus to have 4x4 CCD camera pixels to picture one display pixel permit us to achieve this motion compensation precisely. Next, all frames are added to each other to simulate the temporal integration on the retina. An example of blurred edge obtained with this method is shown in Figure 2a for a edge moving with a velocity V = 10 pixels per frame. The blurred edge width BEW (in pixels) is computed as illustrated. The normalized blurred edge width NBEW can be expressed by dividing BEW by the velocity V (in pixels per frame): NBEW = BEW/V.
2.2 Temporal
step-response
measurements
The sensor of the response time measurement system consists of a fast photo diode connected to an oscilloscope. The diode is housed in a special purpose box with an opening of 2 mm by 2 mm surrounded by black velvet. The sensor box is attached directly on the screen surface. The temporal response of the displays is sampled with a sample time of 0.1 ms.
For these measurements, the stimulus consisted in a set of 20 transitions from one gray level to another among five. Each gray patch is displayed during 20 frames. The following gray levels (DAC values) have been used: 0, 63, 127, 191, 255. We obtained thus 20 step-responses, 10 rise responses (when the start level is lower than the final level) and 10 fall responses (when the start level is higher than the final level).
Example of the temporal step-response for a transition from 0 to 255 is shown in Figure 2b. The response time value τ is computed from this step-response according to recommendations [11] between 10% and 90% luminance level. The blurred edge profile can then be obtained by convolving the temporal step-response with a window which has a width of one frame-period. For an edge moving from left to right with a start value Ns and a final value Nf as defined previously, the pixels before the edge will change from Ns to Nf . As a consequence, their temporal response
corresponds to the step-response from Ns to Nf but it has to be flipped horizontally in order to match with the blurred profile as it appears on the display [8]. The blurred edge profile corresponding to the temporal step response of Figure 2b is shown in Figure 2c. The blurred edge time BET (in seconds) is obtained as illustrated. The normalized blurred edge time NBET is expressed in frames by dividing BET by the frame period T (in seconds): NBET = BET/T . As a result, both NBEW and NBET values are expressed in frames. This permits to compare both methods of measurement.
Table 1 – Specifications of tested displays
Id Type Size Resolution RT (ms) Notes A IPS 20’’ 1600x1200 8
B IPS 26’’ 1920x1200 5 Backlight flashing C IPS 30’’ 2560x1600 5 Backlight flashing D VA 22’’ 1680x1050 8
E TN 24’’ 1920x1200 5
3. Results
Five very recent monitor displays have been tested in this work. They were all AM-TFT LCD with a refresh frequency of 60 Hz, with different types of panel, sizes and resolutions as depicted in Table 1. In the following, they are identified with letters from A to E. Both B and C were equipped with backlight flashing (BF). The response time (RT) given by the manufacturers is also mentioned. Despite of having different types of TFT panels, the five displays are said to have almost similar grey-to-grey response times. For each display, and for each transition, the normalised blur width has been computed with both approach: from the spatial measurements (called NBEW in the following) and from the temporal step-response measurements (called NBET in the following). The VESA response time [11] has been computed as well from the temporal step-response measurements.
(a) (b) (c)
Figure 2 - Illustration of measurement performed for a transition from Ns = 0 to Nf = 255: blurred edge profile obtained by spatial measurement of an edge moving at V = 10 pixels per frame (a), temporal step-response (b) and blurred edge profile
obtained from the step-response (c).
Frame 0 Frame 5 Frame 10 Frame 15 Frame 20
Figure 1 - CCD camera frames (224x160 pixels) taken during one display refresh period.
Mean values (across the 20 transitions) of response time (τ), NBEW and NBET are presented in Table 2 for the five displays under test. The root mean square error (RMSE) between NBEW and NBET values has been computed as well. We can first observe that the values of grey-to-grey response times are very far from those given by manufacturers.
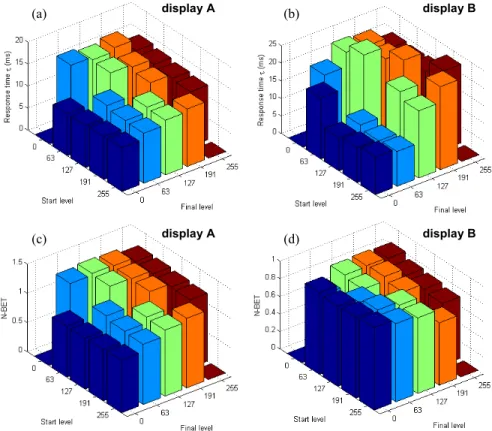
As expected, NBET values for displays with backlight flashing (B and C) are the lowest although their response time are quite high. Figure 3 gives the response times and the NBET values of displays A and B for each transition. It can be observed that both histograms are very similar for display A which do not have backlight flashing. The linear correlation coefficient between both sets of values is 0.977. On the other hand, for display B, with backlight flashing, both quantities are less correlated (-0.762). Moreover, display A has a response time which is 28% lower than the one of display B, whereas the motion blur width on it will be 30% higher than on display B.
Table 2 - Results of measurements (mean values)
Id τ (ms) NBEW NBET RMSE
A 12.7 1.19 1.12 0.112 B 17.6 0.86 0.86 0.034 C 14.3 0.90 0.89 0.042 D 19.5 1.01 1.39 0.519 E 20.4 1.28 1.39 0.143
4. Discussion
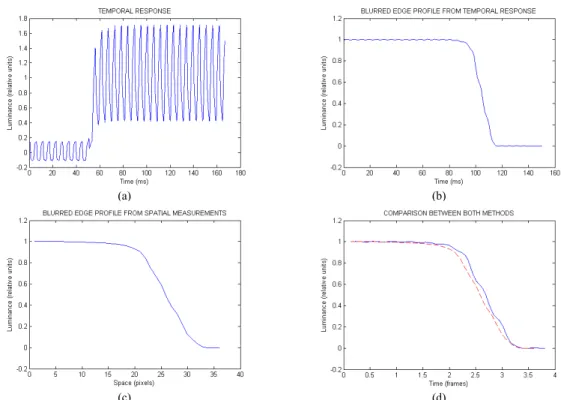
Results obtained from the two different approaches on a display with backlight flashing (display C) are compared in Figure 4. The
blurred edge profiles shown in Figures 4b and 4c are plotted together in Figure 4d, as a function of time (by scaling the space domain with the velocity V [7]). It can be noticed that both spatial and temporal measurements of the blurred edge profile give some clean results on which it is easy to compute blur width values, and this despite of the high frequency modulation on the temporal response (Figure 4a) due to backlight flashing. All these measurements confirm that spatial blurred edge profile can be easily drawn from some classical temporal step-response measurements [7][8]. Even for LCD displays with impulse-type improvements such as backlight flashing.
However, although NBET and NBEW should theoretically be the same, some differences occur between both methods of measurement (Table 2). For displays B and C, these differences are not so important (RMSE below 0.1) despite of the temporal modulations due to backlight flashing. For the three first displays NBEW is always slightly larger than NBET (for each of the 20 transitions), which is the opposite result of the one reported by Feng et al. [8]. On the other hand, for displays D and E, NBEW is globally lower to NBET (depending on the transition) and the difference is quite high, especially for display D.
Globally, the differences could be explained by measurement errors, particularly concerning the spatial measurements. Grabbed frames could have been quite noisy especially for low luminance transitions (the more significant differences between NBET and NBEW occur for transitions between low levels of luminance). Temporal measurements may be considered more accurate because they are generally sampled with a higher sample rate and they do not require any image processing or motion compensation. Moreover, temporal measurements are easier to carry out and reproducible from one lab to another.
Figure 3 – VESA response times (a) and NBET (c) of display A for each transition, idem for display B (b) and (d).
(a) (b)
(c) (d) display A
display B display A
display B
P-92 / S. Tourancheau
However, some display improvements with spatial variations suchas black data insertion, scrolling backlight or for example area-adaptive LED backlight would not be taken in account with purely temporal measurements.
4. Conclusion
In this paper, we presented some results of motion blur measurements on LCD displays. Two methods have been used to obtain blurred edge profiles. First one used a stationary camera to picture the moving edge. Second one consists in the convolution of a one-frame-period large window with the temporal step-response of the display. Measured blur indexes are compared between them and with the response time. Both approaches give quite similar results, even for displays with impulse-type motion blur reduction such as backlight flashing, but temporal measurements are easier to perform and seem to be more reliable.
5. Acknowledgement
This work has been financed by TCO Development and VINNOVA (The Swedish Governmental Agency for Innovation Systems), which is hereby gratefully acknowledged. It has also been supported by the French région Pays de la Loire.
The authors would also like to thank Intertek Semko Sweden for their assistance in the study.
6. References
[1]
T. Kurita, “Moving picture quality improvement for hold-type AM-LCDs”, SID Symposium Digest, Vol. 32, pp. 986-989, 2001.[2]
K. Oka and Y. Enami, “Moving picture response time (MPRT) measurement system”, in SID Symposium Digest, Vol. 35, pp. 1266-1269, 2004.[3]
M. E. Becker, "Motion blur measurement and evaluation: From theory to the laboratory", SID Symposium Digest, Vol. 38, pp. 1122-1125, 2007.[4]
M. A. Klompenhouwer, "Temporal impulse response and bandwidth of displays in relation to motion blur", SID Symposium Digest, Vol. 36, pp. 1578-1581, 2005.[5]
H. Pan, X.-F. Feng, and S. Daly, "LCD motion blur modeling and analysis", IEEE International Conference on Image Processing, ICIP 2005, 2, pp. 21-24, September 2005.[6]
X. Li, X. Yang, and K. Teunissen, "LCD motion artifact determination using simulation methods", SID Symposium Digest, 37, pp. 6-9, June 2006.[7]
A. B. Watson, "The Spatial Standard Observer: A human vision model for display inspection", SID Symposium Digest, 37, pp. 1312-1315, 2006.[8]
X. F. Feng, H. Pan, and S. Daly, "Comparison of motion blur measurement in LCD", SID Symposium Digest, 38, pp. 1126-1129, 2007.[9]
TCO Development AB, "TCO'06 Media Displays", Tech. Rep. TCOF1076 version 1.2, Stockholm, Sweden, 2006.[10]
D. H. Brainard, "The Psychophysics Toolbox", Spatial Vision 10(4), pp. 433-436, 1997.[11]
VESA, "Flat Panel Display Measurements", Tech. Rep. Version 2.0, Video Electronics Standards Association, 2005.(a) (b)
(c) (d)
Figure 4 - Results of measurements on display C (with backlight flashing), temporal step-response (a), blurred edge profile from temporal response (b), blurred edge profile from spatial measurements (c), comparison of both methods (d).