JOURNAL OF GEOPHYSICAL RESEARCH, VOL. 85, NO. A3, PAGES 1285-1290, MARCH 1, 1980
Satellite
Studies
of N(2D) Emission
and Ion Chemistry
in Aurorae
D. W. RUSCH
Laboratory for Atmospheric and Space Physics, University of Colorado, Boulder, Colorado 80309 J-C. GERARD
Institut d'Astrophysique, Universite de Lidge, 4200 Lidge, Belgium
Space Physics Research Laboratory, University of Michigan, Ann Arbor, Michigan 48105 The incident particle flux ion and neutral composition data taken on the AE-D satellite have been used to investigate the quantal emission of N2 + at 4278 A, N(2D) at 5200 A, and the ion chemistry in aurorae. The results of a time dependent auroral model have been compared to the data. The calculated 4278 A emission of N2 +, the 5200 A emission of N(2D), the densities of O2 +, NO +, N2 +, O +, and the electron
density are generally in agreement with the measured values. These results are consistent with the branching ratios and quenching rates deduced from previous studies of the N(2D) densities in the day-
time, mid-latitude ionosphere. It is found that in an auroral arc, the measured atomic oxygen density is lower than predicted by the MSIS model.
INTRODUCTION
The simultaneous and broad-based measurement capability
of the Atmosphere Explorer (AE) satellites allows us to obtain unique data on auroral events as the satellite passes through an active region. Two previous studies [Torr et al., 1975; Kas- ting and Hays, 1977] have taken advantage of the satellite's ca- pability in order to investigate the ion chemistry and the en- ergy degradation of electrons in aurorae. In this paper, the electron energy spectrum measured by the low-energy elec- tron experiment (Lee) [R. Hoffman et al., 1973] and the neu- tral atmosphere densities of N2 and O measurd by the open source mass spectrometer (OSS) [Nier et al., 1973] are used as input to a time dependent model of the auroral ionosphere. The model has been previously applied to mid-latitude calcu- lations of odd nitrogen and ion densities in the thermosphere, for comparison to satellite data [Rusch et al., 1977; Cravens et al., 1979], and to the calculation of auroral odd nitrogen and
ionospheric
densities,
for comparison
to rocket and satellite
data [G•rard and Rusch, 1979].
The model is used here to calculate the ionization and dis- sociation rates in the atmosphere and the time dependent de- velopment of the auroral ionospheric and the odd nitrogen
densities.
We then compare
the calculated
airglow
(4278 /•
and 5200 /•,) intensities
and ionospheric
densities
to those
measured on the satellite in an attempt to verify under auroralconditions the validity of mid-latitude odd nitrogen chemistry deduced by Rusch et al. [1975] and Frederick and Rusch
[1977].
DATA
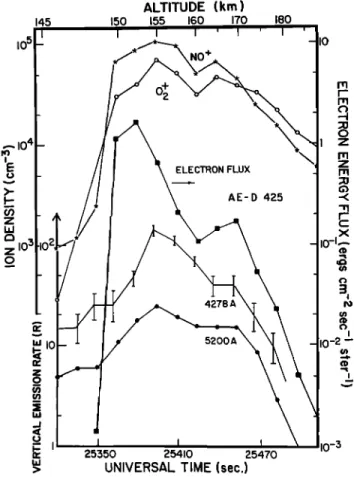
In this study we have concentrated on data from two AE-D orbits, 431 and 425, for which perigee is located in the auroral zone during a period of bright nighttime aurorae. On one of the orbits (425), we have performed individual calculations at
two different times. The basic data are shown in Figures 1 and
2. The vertical intensities of the 4278/• and 5200/•, emissions
are taken from the visible airglow experiment (VAE) [Hays et
al., 1973], the electron density is from the cylindrical elec- trostatic probe (CEP) [Brace et al., 1973], the ion densities of
NO + and 02 + are from the magnetic ion-mass spectrometer
Copyright ¸ 1980 by the American Geophysical Union.
(Mims) [J. Hoffman et al., 1973], and the electron energy flux
from Lee is displayed versus universal time and satellite alti- tude. In both cases, AE-D was operating in a spinning mode, cart-wheeling along its orbit. In this mode, vertical intensities
may be measured by both VAE channels, although not pre-
cisely at the same time.
The VAE data were averaged in the sector of the spin within 20 ø of the vertical. Dark count and galactic background emissions were removed by using data from the high-altitude segments of the orbits. The laboratory calibration was then
applied to the data. The statistical error involved in this pro-
cedure is about 15% for the 15 R signal measured on orbit 425 and about 5% for the 29 R signal of orbit 431.
The low-energy electron experiment on AE-D scans the en- ergy range from 0.2 Kev to 20 Kev in I second. The Lee spectra were averaged over the upward-looking hemisphere during one-haft of a spin period, and each sum included seven
or eight spectra. The individual spectra used in the averages
did not show any significant pitch angle dependence, so we as- sume the distribution to be isotropic at all energies. The aver- aged Lee spectra for the three cases studied below are shown in Figure 3 and exhibit differences in the flux distribution and total energy. Note in particular the very rapid decrease in flux at high energies and the strong 'inverted V' event of orbit 431. The collected data used for comparison to the calculation are
given in Table 1, where H is the satellite altitude.
The vertical distribution of the neutral atmosphere is needed as input for the calculations. To obtain this distribu- tion we used the MSIS model [Hedin et al., 1977] and normal- ized the N2 density, by varying the Ap value in the model, to that measured by the OSS. We then normalized the atomic oxygen by multiplying the model O density by the ratio of the measured O density to the model O density at the value of Ap where the N2 densities agreed. We found, in each case, that
the model O densities had to be decreased by approximately a
factor of two to match the measurement. The neutral temper- ature profile corresponding to the normalized MSIS model was adopted. A further difficulty arises in determining the ap- propriate molecular oxygen density profiles. For initial model calculations in each case we used the O2 density profile at- tached to the MSIS model, realizing that no attempts were made to quantitatively describe the O2 distribution in the
Paper number 9A 1642. 0148-0227 / 80 / 009 A- 1 64 2501.00
1286 RUSCH AND GI•RARD: N(2D) EMISSION AND CHEMISTRY IN AURORAE ALTITUDE (krn) •45 •50 •55 •60 •70 •80
511
I
I
I ' I ' I '!
Io I-
+
11ø
t
4278
A
•
I 5200A 10-2 -- i [ 10-3 25:350 25410 25470UNIVERSAL TIME (sec.)
Fig. 1. The measured vertical intensities of 5200-/• and 4278-/•
emission, ion densities, and electron flux for AE-D orbit 425 as a
function of Universal Time in seconds and satellite altitude.
ALTITUDE (kin) 145 150 160
I05 )L.e•..
N' , ' I0
rrl I'llo
z rrlIO
4
i
z
ELECTRON FLUX rrl•'
AE--D
431
-11
•
x
i- io 3 io-I •n Z o Z •n 0 a) I z • • •0-3•69650 69660 69690 69720 69750
UNIVERSAL TIME (sec.)
Fig. 2. Same as Figure I for orbit 431, except the electron density is
included. .-- 108 I-
z 106-
i,i s n,- _ bJ - LL _ • - Z - 0 o io 5 bJ 0.1 i I I i i i i i I i I i I I I II I I I I"-.,.
i.o io.o ENERGY (keV) i/ I 1 5OFig. 3. The measured electron differential flux for orbit 425 at 25,425 seconds UT (...), 25,455 seconds UT (•), and for orbit 431 at 69,680 seconds UT (---).
model. In subsequent runs the O2 density profile was adjusted,
guided by the calculated ionospheric densities and airglow
emissions. The final neutral atmosphere model adopted in each case resembled that used by Gkrard and Rusch [1979] in their analysis of a coordinated satellite-rocket auroral experi-
ment.
THE MODEL
The chemical model used in these calculations has been de- scribed in several papers [Rusch et al., 1977; Cravens et al.,
1979; G•rard and Rusch, 1979]. The basic features of the model are given here.
The ionization rate profile is calculated by using a method
developed in Lazarev [1967] for the case of monodirected-
monoenergetic beam of electrons. This formula gives an ana-
lytical expression for the total ionization rate as a function
of the penetration depth and depends on the energy of the primary electrons and the local mass density [G•rard, 1970]. The validity of this formulation was demonstrated in G•rard and Rusch [1979]. The ionization rate profile is calculated by assuming that the electron energy spectrum measured by the Lee detectors at the spacecraft altitude represents the spec- trum of the primaries outside the atmosphere. This approx- imation would mostly affect the soft electron component (en- ergies below --• 500 ev) whose energy is degraded above the altitude of the spacecraft. Neglect of this component would influence the calculated 4278 and 5200/!• column intensities. The ionization rate is integrated over the energy spectrum, and an isotropic pitch angle distribution from 0 ø to 80 ø is as- sumed to be in agreement with the angular distribution mea- sured by the detectors. The volume emission rate of the 4278-
/!• band of the N2
+ first-negative
system,
rt(4278),
is sub-
sequently calculated from the total ionization rate q by using0.88[N2] 1
•1(4278)
= q 0.88[N,]
+ 0.5[0]
+ [O,]
'5•
The production rates of individual ions are obtained from the total ion production rate q by following the method de-RUSCH AND Gf•RARD: N(2D) EMISSION AND CHEMISTRY IN AURORAE 1287 O + ions in the three lower levels 4S, 2D, and 2p is 0.48, 0.32, and 0.20, respectively, of the total O + production IT off and Tort, 1978]. The ion and odd nitrogen densities are then cal- culated with a time-dependent model which uses a general second-order differential equation solver developed at the Na- tional Center for Atmospheric Research by Hastings and Robie [1977]. The continuity equations are solved for N2 +,
NO +, O2
+, N +, O+(4S), O+(2D), O+(2P), N(2D), N(2p), N(4S)
and NO with the chemical reactions listed in Table 2. The NO and N(4S) calculations include molecular and eddy diffusion
and appropriate
fiux•
conditions
at the lower (50 km) and up-
per (300 km) boundaries. Most of the reaction rates and their temperature dependence that are used in the calculations have been measured in the laboratory and their values confirmed
by the analysis of the AE (satellite) measurements of the ther-
mospheric ion composition [Torr and Torr, 1978]. However, a few branching ratios and quenching rates have not been mea- sured, and a choice must be made on the basis of the odd ni-
trogen daytime chemistry. The reaction of N2 + with O (reac- tion 7) is assumed to produce only N(2D) atoms, and the dissociation of N2 by fast electron impact yields 60% N(2D), and 20% of N(4S) and 20% N(2P) in the model. In the model, effective quenching of N(2p) by atomic oxygen to the N(2D)
state makes the overall efficiency
of this reaction for N(2D)
production near 80%. These values are in agreement with the
[NI] 5200/• airglow
analysis
by Frederick
and Rusch
[1977]
and give satisfactory agreement with the nitric oxide densities observed in the mid-latitude lower thermosphere [Cravens et al., 1979].
ANALYSIS AND RESULTS
The measured airglow and ionospheric parameters are com- pared in detail to the results of the model calculations in Ta-
bles 3, 4, and 5. The 4278-/• and 5200-/• emission rates listed
are obtained by integrating the calculated volume emission rates above the spacecraft altitude.
Two calculations are presented for each time selected, for it
is instructive to show the results as specific parameters are var-
ied. The comments refer to the parameter variations. In all the calculations, except case 2 of Table 5, the densities and emis-
sions shown are for the fully developed ionosphere. The satu-
ration time for the ionosphere at these altitudes is on the order of 500 seconds. The comparisons are difficult, of course, as we
have no knowledge of the history of the event. It does appear, however, that for the two cases of orbit 425, the ionosphere
was fully developed, and for the case of orbit 431 it was not.
This is consistent
with the known lifetimes
(• 10 seconds)
of
inverted-V events, such as the one which occurred on orbit 431.In each case the [O] density was normalized to the MSIS model, as described earlier. The objective of each calculation
was to reproduce the observed optical emissions, then to see if
the calculated ion densities compared favorably with the mea- surements. We were guided in our choice of the O2 profiles
primarily by their effect on the calculated 02 + and O + den-
sities. We found good agreement with the airglow, the NO +
and 02 + densities could be achieved, but N2 + and O + were not in as good agreement. Note that it was necessary to triple the O2 densities in the cases of Tables 3 and 4, but this resulted in a calculated to measured O + ratio of 0.15 for case 2 of Table 4. This case for orbit 431 was one of hard precipitation, probably short lived, and the results of the calculation after 6.0 seconds
1288 RUSCH AND GœRARD: N(2D) EMISSION AND CHEMISTRY IN AURORAE
TABLE 2. Reactions and Reaction Rates
Reaction Reaction Rate* Source
1. O + e--• O+(4S, 2, 2D, 2p) + 2e see text:j'(nS) -- 0.484, f(2D) -- 0.323, f's from Torr and Torr [1978]
f(2p) = 0.194
2. 02 + e --• 02 + + 2e see text
3. 02 + e --• O + O+(nS, 2D, 2p) + 2e see text (J(nS),f(2D),f(2P), same as RI) 4. N2 + e --• N2 + + 2e see text
5. N2 + e --. N(nS) + N(2D, 2p) + e see text 6. N2 + e--• N(4S, 2D, 2p)+ N + + 2e see text
7. N2 + + O--• NO + + N(2D) 1.4 x 10-•ø(T/300) -ø-• McFarlandetaL [1974]
8. N2 + + 02 '• 02 + + N 2 5 X 10-•(T/300) -ø's Lindinger et aL [1974]
9. N2 + + e--• N(4S) + N(2D) 1.8 X 10⁻⁷(Te/300) -ø'39 Mehr and Biondi[1969]
10. O + + N 2 --• NO + + N(4S) 5 X 10 -•3 Lindinger et aL [1974]
11. O + + 02 '--• 02 + + O 2 X 10-•(Tn/300) -ø'4 McFarland et al. [1974]
12. 02 + + NO--• NO + + 02 4.4 x 10 -•ø Lindinger et al. [1974] 13. 02 + + N(2D)--• NO + + O 1.8 x 10 -•ø Goldan et al. [1966]
14. 02 + + e -• O + O I X 10-STe -ø'7 D. Torr et al. [1976]
15. N + + 02 --• NO + + O 2.75 x 10 -•ø McFarland et al. [1973]
16. NO + + e --• N(nS, 2D) + O 4.2 X 10⁻⁷(Te/300) -ø'ss Walls and Dunn [1974]
17. N(4S) + 02 --• NO + O 2.4 x 10 -• exp (-3975/Tn) Wilson [1967]
18. N(2D) + 02 --• NO + O 6 X 10 -•2 Lin and Kaufman [1971]
19. N(2D) + e --• N(nS) + e 6 x 10-•ø(Te/300) ø's Frederick and Rusch [1977]
20. N(2D) + O --• N(4S) + O 5 X 10 -13 Frederick and Rusch [1977] 21. N(nS) + NO--• N 2 + O 2.1 X 10 -• Phillips and Schiff[1962]
22.
N(2D)--•
NOS)
+ hv52oo
z12o
701•7
x 10
-s
s-'
Garstang
[1956]
23. O+(2D)
+ N2
--• N2
+ + O
I X -
Rutherford
and
Vroom
[1971]
24. N(2p) + O --• N(2D) + O I x 10 -• Young and Dunn [1975]
25. N(2p) + e--• N(2D) + e 6 x 10-•ø(Te/300) 's Assumed
26. N(2p) --• N(2D) + hi, A = 0.079 s -• Garstang [1956]
27. N(2p) --• N(nS) + hi, A = 0.0054 s -• Garstang [1956]
28. O+(2p)+o--•O+(2D)+O 5.2x 10 -• RuschetaL[1977]
29. O+(2P) + e --• O+(2D) + e 1.89 x 10 -7 (Te/300) -ø's Henry et aL [1969]
30. O+(2P)--• O+(2D) + hv A -- 0.17 s -• Seaton and Osterbrock [1957]
31. O+(2P) --• O+(4S) + hv A = 0.048 s -• Seaton and Osterbrock [1957]
32. O+(2P) + N2--• N2 + + O 4.8 x 10 -•ø Rusch et al. [1977]
33. N(2D) + NO--• N2 + O 7 x 10 -• Black et al. [1969]
34. N(2p) + O2--• NO + O 2.6 x 10 -•2 Husain et al. [1974]
*Rates are in units of cm3s -l unless otherwise noted.
TABLE 3. Data and Theory for Orbit 425 at 25,425 Seconds UT
14278 1 5200 NO + 02 + N2 + O + N + •N i Ne Comment Data 60 15 5 (4) 3.1 (4) 1.5 (3) 8.7 (3) 4.5 (2) 9.1 (4) 6.3 (4) Theory 1. 28 20 6.2 (4) 1.2 (4) 6.4 (2) 6.4 (3) 2.4 (2) 8.1 (4) 8.1 (4) 0.6 x [Ol 2. 28 13 6.4 (4) 1.7 (4) 5.8 (2) 3.6 (3) 8.2 (1) 8.5 (4) 8.5 (4) 0.6 x [O] 2.9 x [02]
TABLE 4. Data and Theory for Orbit 425 at 25,455 Seconds UT
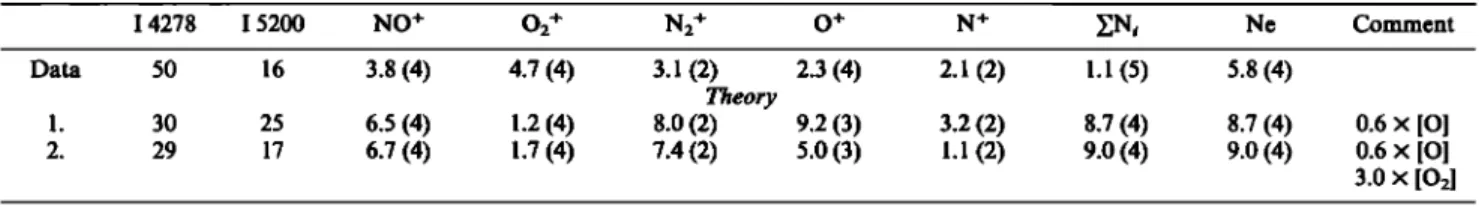
14278 1 5200 NO + 02 + N2 + O + N + Yj•I i Ne Comment Data 50 16 3.8 (4) 4.7 (4) 3.1 (2) 2.3 (4) 2.1 (2) 1.1 (5) 5.8 (4) Theory 1. 30 25 6.5 (4) 1.2 (4) 8.0 (2) 9.2 (3) 3.2 (2) 8.7 (4) 8.7 (4) 0.6 x [O] 2. 29 17 6.7 (4) 1.7 (4) 7.4 (2) 5.0 (3) 1.1 (2) 9.0 (4) 9.0 (4) 0.6 x [O] 3.0 x [O•]
TABLE 5. Data and Theory for Orbit 431 at 69,680 Seconds UT
14278 1 5200 NO + 02 + N2 + O + N + Y. Ni Comment Data 200 29 1.2 (5) 9.7 (3) -- 6.2 (3) q 1.2 (5) Theory 1. 198 62 1.6 (5) 2.5 (4) 3.7 (3) 1.6 (4) 8.4 (2) 2.0 (5) 0.5 x [O] 2. 198 26 8.9 (4) 2.7 (4) 1.5 (3) 6.5 (3) 3.6 (2) 1.2 (5) 0.5 x [O] t -- 6.0 seconds
RUSCH AND GERARD: N(2D) EMISSION AND CHEMISTRY IN AURORAE 1289 260
240
I_
F
ß
.'
.;::%
'-
120
••...•
IO0
•"'•'•-••
'"•
10-2 iO-= i0 o I0 [ IO 2 I0 $ 2xlO $VOLUME EMISSION RATE (Ph cm -$s -•)
Fig. 4. The'calculated altitude distribution of 4278-A and 5200-A
emission
for orbi
t 425
at 25,425
seconds
UT for case
3 of Table
3 (...),
for orbit 425 at 25,455 seconds UT for case 2 of Table 4 (•), for orbit 431 at 69,680 seconds UT for case 2 of Table 5 (---).The agreement between the calculated and measured 4278-
A emission rates is within a factor of two for orbit 425. A simi-
lar discrepancy was encountered by Kasting and Hays [1977]
upon comparing
the 4278-A intensities
measured
by VAE
with those calculated from the particle flux.In Figure 4 we show the volume emission rate profiles for
case 2 of Tables 3, 4, and 5. The maximum volume emission
rates for 4278-A intensities
are 26, 100, and 1.6 x 10³ ph
cm-3s
-•, which
correspond
to 5200-A
maximum
volume
emis-
sion rates of 0.93, 1.3, and 2.1 ph cm-3s -•, respectively. This indicates that the shape of the incident energy flux and the neutral atmosphere play important roles in determining the5200-A
intensity
profile.
Note that the peak intensity
of 5200
for orbit 431 occurs at 140 km.
DISCUSSION AND CONCLUSIONS
Detailed comparison of the production and loss rates for
N(2D) in the aurora and in the mid-latitude daytim,
e iono-
sphere [Frederick and Rusch, 1.977] show that the dominantsources
of N(:D) are different
in the aurorae.
The production
rates for N(2D) are displayed
in Figure 5 for case 2 of orbit
425, at 25,425 seconds for the individual reactions. In the day-
time, dissociative recombination of NO + (reaction 16) and ionization interchange of N: + with O (reaction 7) dominate at
al{itudes
above
150 km, and dissociative
excitation
of N: by
energetic electrons (reaction 5) is a 10% source. In the aurora, at the altitudes studied, the three sources are very nearly equal
if the efficiency
for production
of N(:D) by reaction
5 is effec-
tively 80%. Also, the major quenching species in the standard model in. ,the aurora is molecular oxygen due to the relatively low atomic oxygen density. At mid-latitudes, quenching by atomic oxygen dominates in the 200- to 240-km region, a fact which led Frederick and Rusch [1977] to infer the low quench-ing rate of N(2D) by O.
In the aurora, about four nitrogen atoms are produced for each N2 ionization. Two nitrogen atoms are produced from each N2 + ion, one from reaction 7 and one from the sub-
sequent NO + recombination, reaction 16. Further, the total
cros section for the dissociation of N2 by electrons [Winters,
1966] is nearly equal to the ionization cross section, so the rate
of ionization of N2 is nearly equal to the rate of N2 dis-
240 220 200 180 160 140 120 I00 I0 o
I lk I II&ll[ I\'•d I IllIll I I I IIIll I I I I IllIll
'. ß a •.. I
_'.. \. aaa x•,,.
... e++N
z
".A
•
•
.... •+ o
/
-
"•
•
•
... NO
+ + e
_
-.._
%. .... .:+e
_
_
,
%.
-
I ß / • 'x •_
}
io [ io z io • 5xlo •PRODUCTION RATE (c•5s -I)
Fig. 5. The calculated production rates for N(:D) for case 2 orbit 425 at 25,425 seconds.
sociation. Thus four N atoms are produced for each N: ioni- zation.
If we accept
the ei•ciencies
for the production
of N(:D) by
reactions 5, 6, 7, and 16 as 80%, 80%, 100%, and 80%, respec-
tively, the total auroral ei•ciency for all sources for N(:D) production is 83%. This extremely high ei•ciency is required
to satisfy
the 5200-A measurements.
The ei•ciency
for pro-
duction
of N(2D) by reaction
26 has been measured
in the lab-
oratory by Kley et al. [1977], and the 100% efficiency for reac- tion 6 is required by the dayglow measurements [Frederick and Rusch, 1977] and supported by the theoretical calculations of Oran et al. [1975]. However, there has been no firm in- dication of the combined ei•ciency of reactions 5 and 6. From this study we infer that this ei•ciency must be large, probably near 80%, in agreement with the value inferred from studies of the nitric oxide density in the lower thermosphere [Cravens et al., 1979].
The calculations are subject to uncertainties, because the auroral histories are unknown, and time variations in the elec- tron precipitation during the measurement period are difficult to discern.
We conclude that the chemistry adopted adequately ex-
plains the measured
5200-A emission
in the aurora. This
chemistry is consistent with the requirements of the daytime
mid-latitude
ionosphere
and measurements
of the N(:D) den-
sity in the mid-latitude dayglow.
•4cknowledgments. This work was supported by the National Aeronautics and Space Administration under grants NSG5372 at the University of Colorado and NAS5-23006 at the University of Mich- igan. One of the authors (J-C. Gtrard) is supported by the Belgian Foundation for Scientific Research (FNRS). We thank the National Center for Atmospheric Research for computer time. The National Center for Atmospheric Research is supported by the National Sci-
ence Foundation.
The Editor thanks J. F. Noxon and A. Vallance-Jones for their as-
sistance in evaluating this paper. REFERENCES
Black, G., T. G. Slanger, G. A. St. John, and R. A. Young, Vacuum ultraviolet photolysis of N:O, 4, Deactivation of N(:D), d. Chem.
Phys., .51, 116, 1969.
Brace, L. H., R. T. Theis, and A. Dalgarno, The cylindrical elec- trostatic prob• for Atmosphere Expl0rer-C,-D, and -E, Radio $ci., 8, 341, 1973.
Cravens, T. E., J-C. G6rard, A. I. Stewart, and D. W. Rusch, The lati- tudinal gradient of nitric oxide in the lower thermosphere, d. Geophys. Res., 84, 2675, 1979.
Frederick, J. E., and D. W. Rusch, On the chemistry of metastable atomic nitrogen in the F region deduced from simultaneous satellite
1290 RUSCH AND GœRARD: N(2D) EMISSION AND CHEMISTRY IN AURORAE
measurements
of the 5200-• airglow
and atmospheric
composition,
J. Geophys. Res., 82, 3509, 1977.Garstang, R. A., Transition probabilities of auroral lines, in The •lir-
glow and •lurorae, edited by E. B. Armstrong, p. 324, Pergamon, New York, 1956.
G6rard, J-C., Metastable oxygen ions distribution and related optical emission in aurora, •lnn. Geophys., 26, 777, 1970.
G6rard, J-C., and D. W. Rusch, The theory of the auroral ionosphere: Comparison of a time-dependent model with composition measure- ments, J. Geophys. Res., 84, 4335, 1979.
Goldan, P. D., A. L. Schmeltekopf, F. C. Fehsenfeld, H. I. Schiff, and E. E. Ferguson, Thermal energy ion-neutral reaction rates, 2, Some reactions of ionospheric interest, J. Chem. Phys., 44, 4095, 1966. Hastings, J. T., and R. G. Robie, An automatic technique for solving
coupled vector systems of non-linear parabolic partial differential equations in one space dimension, Planet. Space $ci., 25, 209, 1977. Hays, P. B., G. Carignan, B.C. Kennedy, G. G. Shepherd, and
J. C. G. Walker, The visible-airglow experiment on atmosphere ex-
plorer, Radio $ci., 8, 369, 1973.
Hedin, A. E., C. A. Reber, G. P. Newton, N. W. Spencer, H. C. Brin- ton, H. G. Mayr, and W. E. Potter, A global thermospheric model based on mass spectrometer and incoherent scatter data MSIS, 2, Composition, J. Geophys. Res., 82, 2148, 1977.
Henry, R. J. W., P. G. Burke, and A. L. Sinfailam, Scattering of elec- trons by C, N, O, N +, O +, and O ++, Phys. Rev., 178, 218, 1969.
Hoffman, J. H., W. B. Hanson, C. R. Lippincott, and E. E. Ferguson,
The magnetic ion-mass spectrometer on atmosphere explorer, Ra-
dio $ci., 8, 315, 1973.
Hoffman, R. A., J. L. Burch, R. W. Janetzke, J. F. McChesney, S. H.
Way, and D. S. Evans, Low-energy electron experiment for Atmo-
sphere Explorer-C and-D, Radio $ci., 8, 393, 1973.
Husain, D., S. K. Mitra, and A. N. Young, Kinetic study of electroni-
cally excited atoms N(22Dj, 22Pj) by attenuation of atomic reso-
nance radiation in the vacuum ultraviolet, J. ½hem. $oc., Faraday Trans. II, 70, 1721, 1974.
Kasting, J. F., and P. B. Hays, A comparison between N2 + 4278-A
emission and electron energy flux in the auroral zone, J. Geophys. Res., 82, 3319, 1977.
Kley, D., G. M. Lawrence, and E. J. Stone, The yield of N(2D) atoms
in the dissociative recombination of NO +, J. Chem. Phys., 66, 4157,
1977.
Lazarev, V. I., Absorption of the energy of an electron beam in the upper atmosphere, Geomagn. •leron., 7, 219, 1967.
Lin, C-L., and F. Kaufman, Reactions of metastable nitrogen atoms, J. Chem. Phys., 53, 3760, 1971.
Lindinger, W., F. C. Fehsenfeld, A. L. Schmeltekopf, and E. E. Fer-
guson, Temperature dependence of some ionospheric ion-neutral
reactions from 300 ø to 900øK, J. Geophys. Res., 79, 4753, 1974. McFarland, M., D. L. Albritton, F. C. Fehsenfeld, E. E. Ferguson,
and A. L. Schmeltekopf, A flow-drift technique for ion mobility and ion-molecule rate constant measurements, J. Chem. Phys., 59, 6620, 1973.
McFarland, M., D. L. Albritton, F. C. Fehsenfeld, E. E. Ferguson, and A. L. Schmeltekopf, Energy dependence and branching ratio of the N2 + + O reaction, J. Geophys. Res., 79, 2925, 1974.
Mehr, F. J. and M. A. Biondi, Electron temperature dependence of re- combination of 02 + and N2 + ions with electrons, Phys. Rev., 181, 264, 1969.
Nier, A. O., W. E. Potter, D. R. Hickman, and K. Mauersberger, The
open-source neutral-mass spectrometer on Atmosphere Explorer-C,
-D, and -E, Radio $ci., 8, 271, 1973.
Oran, E. S., P.S. Julienne, and D. F. Strobel, The aeronomy of odd
nitrogen in the thermosphere, J. Geophys. Res., 80, 3068, 1975. Phillips, L. F., and H. I. Schiff, Mass spectrometer studies of atom re-
actions, 1, Reactions in the atomic nitrogen-ozone system, J. Chem. Phys., 36, 1509, 1962.
Rusch, D. W., A. I. Stewart, P. B. Hays, and J. H. Hoffman, The NI (5200-JQ dayglow, J. Geophys. Res., 80, 2300, 1975.
Rusch, D. W., T. E. Cravens, G. R. Carignan, A. I. Stewart, and J-C. G6rard, A theoretical model of odd nitrogen in the earth's thermo-
sphere and mesosphere, EO$ Trans •IGU, 58, 1198, 1977. Rutherford, J. A., and D. G. Vroom, Effect of metastable O+(2D) on
reactions of O + with nitrogen molecules, J. Chem. Phys., 55, 5622,
1971.
Seaton, M. J., and D. E. Osterbrock, Relative (OII) intensities in gase- ous nebulae, •lstrophys. J., 125, 66, 1957.
Torr, D. G., and M. R. Torr, Review of rate coefficients of ionic reac- tions determined from measurements made by the Atmosphere Ex-
plorer satellites, Rev. Geophys. Space Phys., 16, 327, 1978.
Torr, D. G., M. R. Torr, J. C. G. Walker, A. O. Nier, L. H. Brace, and
H. C. Brinton, Recombination of 02 + in the ionosphere, J.
Geophys. Res., 81, 5578, 1976.
Torr, M. R., D. G. Torr, R. A. Hoffman, W. B. Hanson, J. H. Hoff- man, W. K. Peterson, and J. C. G. Walker, An auroral F-region study using in situ measurements by the Atmosphere Explorer-C satellite, Planet. Space $ci., 23, 1669, 1975.
Vallance-Jones, A., A model for the excitation of electron aurora and some applications, Can. J. Phys., 53, 2267, 1975.
Walls, F. L. and G. H. Dunn, Measurements of total cross sections for
electron recombination with NO + and 02 + using storage tech-
niques, J. Geophys. Res., 79, 1911, 1974.
Wilson, W. E., Rate constant for the reaction N + O2 --• NO + O, J. Chem. Phys., 46, 2017, 1967.
Winters, H. F., Ionic absorption and dissociation cross section for ni- trogen, J. Chem. Phys., 44, 1472, 1966.
Young, R. A., and O. J. Dunn, The excitation and quenching of N(2P), J. Chem. Phys., 63, 1150, 1975.
(Received August 22, 1979; revised November 14, 1979; accepted November 15, 1979.)