HAL Id: hal-01534057
https://hal.sorbonne-universite.fr/hal-01534057
Submitted on 9 Jun 2017HAL is a multi-disciplinary open access archive for the deposit and dissemination of sci-entific research documents, whether they are pub-lished or not. The documents may come from teaching and research institutions in France or abroad, or from public or private research centers.
L’archive ouverte pluridisciplinaire HAL, est destinée au dépôt et à la diffusion de documents scientifiques de niveau recherche, publiés ou non, émanant des établissements d’enseignement et de recherche français ou étrangers, des laboratoires publics ou privés.
Knee and hip intra-articular adipose tissues (IAATs)
compared with autologous subcutaneous adipose tissue:
a specific phenotype for a central player in osteoarthritis
Florent Eymard, Audrey Pigenet, Danièle Citadelle, Joan Tordjman, Louise
Foucher, Cindy Rose, Charles-Henri Flouzat Lachaniette, Christine Rouault,
Karine Clément, Francis Berenbaum, et al.
To cite this version:
Florent Eymard, Audrey Pigenet, Danièle Citadelle, Joan Tordjman, Louise Foucher, et al.. Knee and hip intra-articular adipose tissues (IAATs) compared with autologous subcutaneous adipose tissue: a specific phenotype for a central player in osteoarthritis. Annals of the Rheumatic Diseases, BMJ Publishing Group, 2017, 76 (6), pp.1142-1148. �10.1136/annrheumdis-2016-210478�. �hal-01534057�
1
Knee and hip intra-articular adipose tissues (IAATs) compared to autologous
subcutaneous adipose tissue: a specific phenotype for a central player in
osteoarthritis
Florent Eymard1, 2, Audrey Pigenet1, Danièle Citadelle1, Joan Tordjman3,4, Louise Foucher1, Cindy Rose1, Charles-Henri Flouzat Lachaniette5, Christine Rouault3,4 , Karine Clément3,4, Francis Berenbaum1, 2*6, Xavier Chevalier2 and Xavier Houard1
1 Sorbonne University, UPMC Univ Paris 06, INSERM, Centre de Recherche Saint-Antoine (CRSA), F-75012, Paris, France.
2 Department of Rheumatology, AP-HP Henri Mondor Hospital, F-94010, Créteil Cedex, France. 3 Sorbonne University, UPMC Univ Paris 06, INSERM UMR_S1166, Pitié-Salpêtrière Hospital, Paris, France.
4 Institute of Cardiometabolism and Nutrition, Assistance Publique-Hôpitaux de Paris, Pitié-Salpêtrière Hospital, Paris, France.
5 Department of Orthopedic Surgery, AP-HP Henri Mondor Hospital, F-94010, Créteil Cedex, France.
6 Department of Rheumatology, Inflammation–Immunopathology–Biotherapy Department (DHU i2B), AP-HP Saint-Antoine Hospital, F-75012 Paris, France.
*Address for correspondence: Francis Berenbaum
INSERM UMR-S 938
“Metabolism and Age-related joint diseases” Saint Antoine research center
27 rue Chaligny
F-75571 Cedex 12, Paris, France francis.berenbaum@aphp.fr
Running title: intra-articular adipose tissues phenotyping
Word count: 3348
2
Abstract
Objectives. As compared to subcutaneous adipose tissue (SCAT), infrapatellar fat pad (IFP), the
main knee intra-articular adipose tissue (IAAT), has an inflammatory phenotype in patients with
osteoarthritis (OA). We phenotyped suprapatellar fat pad (SPFP) and hip acetabular fat pad (AFP),
two other IAATs, to determinate the unique signature of IAATs compared to SCAT.
Methods. IFP, SPFP, AFP and autologous SCAT were obtained from OA patients during total knee
(n=38) or hip replacement (n=5). Fibrosis and adipocyte area were analyzed by histology and
vascularization, leukocyte and mast cell infiltration were analyzed by immunohistochemistry for
von Willebrand factor, leukocytes and tryptase, respectively. Secretion of IL-6, IL-8 and PGE2 was
assessed by ELISA. The mRNA expression of adipocyte-associated genes (ATGL, LPL, PPAR-γ,
FABP4 and CD36) and developmental genes (SFRP2, HoxC9 and EN1) was determined. The
inflammatory response of isolated fibroblast-like synoviocytes (FLS) to autologous IFP and SPFP
conditioned media was examined.
Results. Fibrosis, vascularization, and leukocyte and mast cell infiltration were greater in IAATs
than SCAT, and levels of IL-6, IL-8 and PGE2 were greater in all IAATs than SCAT. IFP and SPFP
induced a similar inflammatory response to FLS. Adipocyte area was smaller in IAATs than SCAT.
Adipocyte-associated and developmental genes showed a similar gene expression pattern in all
IAATs, different from SCAT.
Conclusions. IFP but also SPFP and AFP (gathered under the term “IAAT”) may play a deleterious
role in OA by affecting joint homeostasis because of their inflammatory phenotype and their close
interaction with synovium in the same functional unit.
3
Introduction
Osteoarthritis (OA) is a whole-joint disease mainly characterized by progressive cartilage
disappearance, subchondral bone remodeling and synovitis, which all act in concert for OA
progression. In this context, many studies have focused on cartilage/subchondral bone crosstalk.
Cartilage and subchondral bone are indeed now considered a unique functional unit. [1, 2] Although
synovitis was thought to mainly result from cartilage breakdown, several data suggest that it could
be also involved in early stages of OA even before cartilage damage. [3, 4] Moreover, we and
others have shown that knee OA synovitis may also depend on the release of inflammatory factors
by the infrapatellar fat pad (IFP), located at the posterior surface of synovium. [5, 6]
IFP is one intra-articular adipose tissue (IAAT), which has received much attention for
several years. IFP from knee OA patients releases many inflammatory factors in higher amounts as
compared to autologous subcutaneous adipose tissue (SCAT). [6-8] IFP volume [9] and release of
tumor necrosis factor α (TNF-α) by IFP [8] are both positively associated with the body mass index
of human OA patients. Similarly, in mice fed a high fat diet, weight gain and IFP volume were
correlated with development of OA. [10] Positive associations were also found between adipocyte
area and vascular infiltrates of IFP. [10] Consequently, IFP may have a paracrine function in other
joint tissues in OA, especially the adjacent synovium. [5, 6]
In the best of our knowledge, only IFP has been studied in OA, although anatomically, other
IAATs are indeed present in the joints. The suprapatellar fat pad (SPFP) is composed of the
quadriceps fat pad and the pre-femoral fat pad, which are located above the patella and behind the
suprapatellar bursa respectively (Supplementary Fig. 1). The posterior fat pad is in close contact
with the posterior articular capsule behind the menisci. [11] Whether IFP has unique properties among IAATs is currently unknown. In addition, IAATs are not restricted to the knee. For instance,
4
ligamentum teres (acetabular fat pad, AFP) (Supplementary Fig. 1). Nothing is known about AFP in
the context of arthritis. Whether IAATs from different joints share similar properties is unknown.
We investigated whether all IAATs acquire an inflammatory phenotype in OA like IFP,
belonging to the same and unique type of adipose tissue (AT), which thus may act with the adjacent
synovium as a unique functional unit. We used histological, molecular and functional
characterization of IFP, SPFP and SCAT from autologous OA patients. In parallel, OA AFP and
autologous SCAT were characterized. Fibrosis, vascular density, inflammatory infiltrates and
adipocyte size were determined, as was the expression of inflammatory factors and molecules
important for adipocyte function. The effect of different knee IAATs on fibroblast-like synoviocyte
5
Materials and Methods
Adipose tissue and synovium samples
Tissues were harvested from patients with end-stage symptomatic knee (n=38) or hip OA
(n=5) undergoing surgery for total knee or hip replacement at Henri Mondor Hospital (Créteil,
France). Sequential patients from whom informed consent was obtained were included. Surgeons
harvested the IFP with the synovial membrane lining its posterior surface and the SPFP during knee
replacement or AFP located in the bottom of acetabular fossa during hip replacement. The SCAT
was harvested immediately below the scar. Tissues were stored in Dulbecco’s modified Eagle’s medium (DMEM) with 1% bovine serum albumin (BSA). The study was approved by the ethics
committee of Henri Mondor Hospital and by the Assistance Publique Hôpitaux de Paris (approval
no. 07-34) for biologic sample collection.
Omental and autologous subcutaneous adipose tissues were harvested from patients (n=15;
female, n=14) operated at Visceral Surgery Department of Ambroise Paré Hospital
(Boulogne-Billancourt, France) for gastric banding (n=2), gastric bypass (n=7) or sleeve gastrectomy (n=6).
Mean age and mean BMI were 39.7±3.8 (18-62) and 45.6±1.4 (36.4-53.7), respectively. All
subjects are part of the BAR-ICAN study (study of obese subjects in bariatric surgery programs)
(Ethical committee N° 2014-april-13533).
Generation of AT-conditioned medium
ATs were carefully dissected as described. [6] For the IAAT samples, special care was taken
to separate AT from the synovium. The absence of remaining synovium was checked on several
samples by histology. Nevertheless, we cannot exclude the marginal presence of remaining
synovium in some cases. To generate the AT conditioned medium, 300 mg AT, minced into small
pieces, was incubated in 1 mL of DMEM, 12.5 mM glucose, and 1% BSA for 1 hr at 37°C in a
6
in 1 mL of the same medium for 3 hr. Thereafter, conditioned media and tissues were collected
separately, spun and frozen at -80°C.
Isolation, culture and stimulation of FLS
As described, [6] synovium was digested in 0.75 mg/mL collagenase/dispase and 0.075
mg/mL DNase (both from Roche Diagnostics) in FLS growth medium (RPMI 1640 Glutamax, 100
units/mL penicillin, 0.1 mg/mL streptomycin, 10 mM HEPES, 2 mM sodium pyruvate, 10% fetal
calf serum) before seeding cells in culture plates. FLS were cultured at 37°C in a humidified
atmosphere of 5% CO2/95% air.
FLS from passage 3 (n=6 patients) were seeded at 105 cells/well in 6-well culture plates.
Confluent FLS were left in depletion medium (growth medium without serum) for 24 hr before
washing with PBS and stimulation with IFP- or SPFP-conditioned medium (150 µL) in depletion
medium (850 µL). Control FLS were incubated in depletion medium (850 µL) with 150 µL of
medium used to generate tissue conditioned media. After 24-hr stimulation, FLS were rinsed twice
with PBS and incubated in depletion medium for 24 hr. Conditioned media were kept, spun and
stored at -80°C.
Isolation of adipocytes
IFP and SCAT were digested in 1 mg/mL collagenase (Roche Diagnostics) in DMEM 4.5
g/L glucose, 100 units/mL penicillin, 0.1 mg/mL streptomycin, 15 mM HEPES, 0.2% BSA for 1 hr
at 37°C. The adipose suspension was then filtered through a 100 micron mesh and centrifuged for 6
min at 150g. The upper phase containing adipocytes was separated and washed 2 times with PBS.
7
Total RNA extraction and quantitative RT-PCR
Total RNA was isolated by using the Reliaprep RNA Cell miniprep system (Promega). RNA
(250–1,000 ng) was reverse transcribed by using the Omniscript RT kit (Qiagen). Gene expression
was analyzed by quantitative RT-PCR with Roche Diagnostics LightCycler 480 in a 12-µL final
volume with specific primers (10 µM) (Supplementary Table 1) and GoTaq PCR Master Mix
(Promega). PCR amplification involved a denaturation step (5 min at 95°C) followed by 40 cycles
of 10 sec at 95°C, 15 sec at 60°C, and 10 sec at 72°C.
For each PCR, cDNA was run in duplicate in parallel with serial dilutions of a cDNA
mixture tested for each primer pair to generate a standard linear curve, which was used to estimate
the amplification efficiency. The relative mRNA expression for all genes analyzed was normalized
to that of 18S RNA (used as the internal reference gene) and determined by using the efficiency
method with Light Cycler 480 software.
Enzyme-linked immunosorbent assay (ELISA)
ELISA kits were used to determine the concentrations of interleukin 6 (IL-6), IL-8 (both
from Sanquin-PeliKine), prostaglandin E2 (PGE2; Cayman Chemical), matrix metalloproteinase 1
(MMP-1; from R&D Systems) in AT and/or FLS-conditioned medium.
Histology and immunohistochemistry study
AT samples were fixed in 3.7% paraformaldehyde, embedded in paraffin and serially
sectioned (5 µm). Sections were stained with picrosirius red (Sigma). Immunohistochemistry
involved mouse monoclonal antibodies to CD45 (leukocytes, clone 2B11+PD7/26, Dako) (dilution
1:100), tryptase (mast cells, AA1, Santa Cruz Biotechnology) (dilution 1:100), CD3
(T-lymphocytes, clone F7.2.38, Dako) (dilution 1:50), CD20 (B-(T-lymphocytes, clone L26, Dako)
(dilution 1:100) and CD68 (macrophages, clone PG-M1, Dako) (dilution 1:100) and von Willbrand
8
antibodies except vWF, the R.T.U Vectastain kit (Vector) was used for detection followed by
counterstaining with Mayer's hematoxylin. Immunofluorescent detection of vWF involved
horseradish peroxidaseconjugated secondary rabbit anti-mouse IgG antibody (Abliance) and the
TSA Plus Cyanine 3 System (Perkin Elmer). Irrelevant control antibodies (Dako) were incubated at
the same concentration to assess non-specific staining.
Morphometric analysis
Sections stained with picrosirius red were used for fibrosis quantification and adipocyte area
determination. Digital images of magnification views (x20) of tissue sections were captured by
using an Olympus DP73 camera (Olympus) on an Olympus BX43 microscope. Fibrosis analysis
involved histomorphometry with CaloPix software (Chatillon, France) with content color
thresholds. The quantification of total fibrosis was expressed as the ratio of fibrous tissue area
stained with picrosirius red/total tissue surface. [12] For adipocyte mean area determination, two
independent observers blindly measured the area of 40 adipocytes located in the center of the tissue
section and values were averaged. Vessel number and vascular density were quantified after vWF
immunostaining. The number of vessels was measured in the whole section and normalized to the
tissue area. Vascular density was quantified as the proportion of vWF-positive area normalized to
tissue area. Infiltration of CD45- and tryptase-positive cells within the tissue area was graded as 0,
no or sparse positive cells; 1, several positive cells; and 2, numerous positive cells with several
clusters.
Statistical analysis
Paired Wilcoxon non-parametric rank test (Statview software, version 4.57 SAS Inc.) was
9
Results
Patient characteristics
We included patients with severe and symptomatic knee (n=38) and hip OA (n=5).
Characteristics of each group are in Supplementary Table 2. In the knee OA group, the mean age
was 73.3±6.5 years and 29 (76.3%) were women. The mean BMI was 29.3±5.0 kg/m². In the hip
OA group, the mean age was 73.0±3.3 years and 3 (60.0%) were women. The mean BMI was
27.4±4.4 kg/m².
Fibrosis and inflammatory infiltration of OA intra-articular adipose tissues
At the time of dissection, all harvested IAATs, whatever their knee or hip origin, had more
fibrous tissue than autologous SCAT. This observation was confirmed at histological level after
quantification of picrosirius red staining (Fig. 1). In knee OA, fibrosis in IFP and SPFP accounted
for 30.9±18.6% and 26.9±9.4% of tissue area, respectively, and was significantly more extended
than in SCAT (18.9±8.5% of tissue area, p=0.028 and p=0.028, respectively). This difference was
even more pronounced between AFP and corresponding SCAT (69.2±9.5% and 21.3±6.0% of
tissue area, respectively) (Fig. 1B and C). Given the small number of patients, no statistical analysis
was performed for hip tissue. In IAATs, fibrous tissue accumulated between adipocyte lobules as
large fascicles. In some cases, adipocytes and fibers were intermingled (Fig. 1A panels a and b). In
contrast, the fibrous part of SCAT surrounded adipocyte lobules and few fibers were detected
among clusters of adipocytes (Fig. 1A panel c). The vascular network also appeared different
between IAATs and SCAT. Vessel number to tissue area was significantly increased 2.2-fold
between both IFP and SPFP and SCAT (data not shown). The vascular area to tissue area was
significantly greater in IFP and SPFP than SCAT (p=0.003 and p=0.006, respectively) (Fig. 1D),
with no difference between IFP and SPFP. As observed in knee IAATs, a higher vessel number and
10
fibrous part of ATs contained more vessels, which were also larger than within adipocyte lobules.
Tissue fibrosis and vascularization were associated neither with the obese/non-obese status of the
patients nor with gender, with the exception of a lower vascular area, in females only
(Supplementary Table 3). In addition to fibrosis and vascularization, CD45- and tryptase-positive
cell infiltration was greater in knee and hip IAATs than autologous SCAT (Fig. 2). Leukocytes and
mast cells preferentially accumulated in perivascular areas in fibrous parts of ATs than in adipocyte
lobules. Inflammatory infiltrates consisted mainly of macrophages. Some T- and B-lymphocytes
could also be observed in IAATs (Supplementary Fig. 2).
Common inflammatory secretion pattern of IAATs
As we previously reported, [6, 7] IFP from OA patients produced significantly more IL-6,
IL-8 and PGE2 than autologous SCAT (Fig. 3A-C). Similarly, SPFP also secreted higher amounts
of these inflammatory mediators as compared to SCAT. The release was 6.2-, 6.7- and 189.1-fold
higher by SPFP than SCAT for IL-6 (p<0.0001), IL-8 (p=0.002) and PGE2 (p<0.0001),
respectively. No significant difference was found between IFP and SPFP. AFP also secreted
significantly more inflammatory factors than autologous SCAT (Fig. 3D-E). No relationship was
found between obesity and any of the inflammatory factors. We only found a lower release of PGE2
by SCAT in females only (Supplementary Table 3).
As a consequence of the inflammatory pattern of IAAT secretion products, both IFP- and SPFP
conditioned media induced an inflammatory and prodegradative response to autologous FLS (Fig.
4). The production of IL-6 and MMP-1 was indeed strongly stimulated by IFP (8.6-fold, p=0.028,
and 3.7-fold, p=0.028, respectively) and SPFP-conditioned media (15.6-fold, p=0.046, and 3.8-fold,
p=0.043, respectively), as compared to unstimulated control cells.
11
Specific phenotype of IAAT-derived adipocytes
Morphometric analysis of adipocytes revealed a smaller size of adipocytes within IAATs
than SCAT. IFP and SPFP adipocyte mean area was 0.6-fold (p=0.002) and 0.7-fold smaller
(p=0.007), respectively, than that from autologous SCAT (Fig. 5). IFP and SPFP did not differ in
adipocyte mean area. As observed in knee IAATs, the mean surface of AFP-derived adipocytes was
0.7-fold smaller than that from autologous SCAT (Fig. 5). No relationship was found between
obesity or gender with the adipocyte area of knee IAATs and SCAT (Supplementary Table 3). This
result suggests that adipocytes present within IAATs and SCAT have distinct phenotypes.
EN1, SFRP2, HoxC9 and Wt1 are genes that are differentially expressed by SCAT and
intra-abdominal AT and their isolated adipocytes. ([13-15] and supplementary Fig. 3) Here, IAATs
and SCAT also differentially expressed EN1 mRNA, with an expression strongly decreased in all
IAATs as compared to SCAT (IFP: 0.3-fold, p=0.006, SPFP: 0.2-fold, p=0.006, and AFP: 0.3-fold,
p=0.046) (Fig. 6H). Similarly, the mRNA level of HoxC9 was lower in SPFP and AFP than
autologous SCAT (SPFP: 0.6-fold, p=0.025, and AFP: 0.3-fold, p=0.043). IFP and SCAT did not
differ in HoxC9 expression and all ATs showed a similar mRNA expression of SFRP2 (Fig. 6).
Wt1 was not expressed by IAATs.
PPAR-γ, CD36, FABP4, LPL and ATGL are involved in adipogenesis, intracellular fatty
acid transfer and trafficking, lipogenesis and lipolysis. They were also differentially expressed in
IAATs and SCAT (Fig. 6). The mRNA expression of CD36, FABP4, LPL and ATGL was
significantly decreased in IFP, SPFP and AFP as compared to the autologous SCAT. PPAR-γ
mRNA expression was lower in SPFP and AFP than SCAT. In contrast, PPAR-γ mRNA expression
was similar in IFP and SCAT. Interestingly, some differences were observed between IFP and
SPFP. The mRNA levels of PPAR-γ (p=0.002) and CD36 (p=0.007) were lower in SPFP than
autologous IFP.
To exclude that differences in gene expression between IAATs and SCAT could be due to
12
whole AT, we analyzed the expression of ATGL, LPL and CD36 in isolated adipocytes from IFP
and SCAT (Fig. 6I). As observed in whole AT, the mRNA expression of ATGL, LPL and CD36
13
Discussion
In recent years, IFP has received much attention for its possible involvement in OA. IFP
volume or surface is modified in OA and could be associated with structural damage and pain. [16]
IFPs from early- and end-stage OA display a different gene expression pattern. [17] OA IFP also
shows an inflammatory phenotype characterized by a higher expression and secretion of
inflammatory factors than autologous SCAT. [6, 7] Consistently, IFP stimulates an inflammatory
response to FLS, [5, 6] which suggests that the functional interaction of IFP with synovium may be
a mechanism of inducing OA synovitis. Of note, several IAATs are present within the knee and
IAATs are not restricted to the knee. In this study, we wondered whether IFP is unique among
IAATs or whether all IAATs share common properties. Interestingly, all IAATs feature a similar
histological pattern: increased fibrosis, vascularization and leukocyte infiltration, as compared to
autologous SCAT. They express and secrete a higher level of inflammatory factors (IL-6, IL-8 and
PGE2). All these features were independent of gender or BMI of patients. Like IFP, SPFP induces
an inflammatory response to FLS. All IAATs and isolated adipocytes express a lower level of genes
associated with adipocyte function. The size of adipocytes is lower in IAATs than SCAT. These
results suggest that all IAATs belong to the same type of AT and support that IAATs and their
adjacent synovium should be considered a unique functional unit.
Our results show that IAATs differ from SCAT. Although we cannot exclude that the
proportion of fibrous and vascular tissue may explain some molecular differences we observed
between IAATs and SCAT, the distinct gene expression pattern of isolated adipocytes from IFP and
SCAT argue for a peculiar IAAT phenotype. Interestingly, IAATs seem to share similar properties
with visceral AT (VAT), the other main type of white ATs. Indeed, the size of adipocytes from
omental or perivascular AT are smaller than in SCAT depots, [18, 19] as we found for IAATs.
Similarly, the level of adipocyte-associated genes is reduced in adipocytes from perivascular and
14
and HoxC9, whose expression is decreased in intra-abdominal VAT, whereas the expression of
SFRP2 is increased. ([14, 15] and data not shown) Our results also show lower levels of both EN1
and HoxC9 in IAATs than SCAT. Similarly, some developmental genes, including EN1, were
differentially expressed by perivascular AT and SCAT, with no difference found between SCAT
and perirenal AT. [18] This latter observation highlights intrinsic differences between VATs. [15]
Nevertheless, Chau et al. recently showed that VATs from six different depots but not SCAT all
express Wt-1. [13] Interestingly, in our study, no expression of Wt-1 was observed in IAATs,
whereas it was in omental VAT. This suggests that IAATs may be a specific AT different from
SCAT and VAT while sharing several common properties with VATs.
OA IAATs are characterized by a higher fibrotic index, inflammatory infiltrates and
vascularization than autologous SCAT. Increased leukocyte infiltration and mast cell number in OA
IFP has been reported. [8] Leukocytes and mast cells preferentially localize within fibrotic areas.
Similar observations were reported in omental VAT from obese patients. [12] Inflammation
stimulates fibrosis in AT, and macrophages can express extracellular matrix components. [20] Of
note, monoiodoacetate injection can induce OA and provoke IFP inflammation and fibrosis. [21,
22] IFP area and vascularization are increased in the murine high-fat diet-induced OA model. [10]
In addition to inflammation, AT fibrosis can be induced by mechanical stimulus, [23] which is
relevant for knee and hip OA. According to the link between fibrosis, inflammation and mechanical
load, we suggest that the peculiar phenotype of IAATs we describe here could depend on intrinsic
properties of IAATs. A recent study comparing the histological characteristics of IFP from cadavers
without knee OA to autologous knee SCAT and heterologous abdominal SCAT [24] reported that IFP adipocytes were smaller than those from SCAT. However, their results on tissue fibrosis differ from ours. Indeed, interlobular septa of IFP were thinner than those from knee SCAT, whereas no quantitative difference of the intercellular space was observed. We have no explanation for this discrepancy between their study and ours. Nevertheless, we never observed SCAT as fibrous as they showed. The peculiar phenotype of IAATs may also be acquired during the course of OA. Indeed, Gandhi et al. showed
15
To conclude, knee and hip OA IAATs share a common phenotype, including a less
adipogenic profile but higher fibrotic and inflammatory characteristics than autologous SCAT.
IAATs could be considered a subgroup of AT, such as visceral, muscular or perivascular AT. The
IAAT impact on joint homeostasis could be related to its inflammatory and metabolic profile and
mediated by close interactions with synovium in a same functional unit. IAATs may be new players
16
Conflict of interest
None.
Acknowledgments
The authors thank the “Société Française de Rhumatologie” for financial support. Authors also thank Gilles Le Naour and the department of pathology of AP-HP Pitie Salpetriere Hospital
(Paris, France).
References
1. Lories RJ, Luyten FP. The bone-cartilage unit in osteoarthritis. Nat Rev Rheumatol. 2010
Jan;7(1):43-9.
2. Mahjoub M, Berenbaum F, Houard X. Why subchondral bone in osteoarthritis? The
importance of the cartilage bone interface in osteoarthritis. Osteoporos Int. 2012 Dec;23 Suppl
8:841-6.
3. Atukorala I, Kwoh CK, Guermazi A, Roemer FW, Boudreau RM, Hannon MJ, et al. Synovitis
in knee osteoarthritis: a precursor of disease? Ann Rheum Dis. 2016 Feb;75(2):390-5.
4. Wang X, Blizzard L, Jin X, Chen Z, Zhu Z, Han W, et al. Quantitative Assessment of Knee
Effusion-Synovitis in Older Adults: Association With Knee Structural Abnormalities. Arthritis
Rheumatol. 2016 Apr;68(4):837-44.
5. Bastiaansen-Jenniskens YM, Wei W, Feijt C, Waarsing JH, Verhaar JA, Zuurmond AM, et al.
Stimulation of fibrotic processes by the infrapatellar fat pad in cultured synoviocytes from
patients with osteoarthritis: a possible role for prostaglandin f2alpha. Arthritis Rheum. 2013
Aug;65(8):2070-80.
6. Eymard F, Pigenet A, Citadelle D, Flouzat-Lachaniette CH, Poignard A, Benelli C, et al.
17
synoviocytes by the infrapatellar fat pad from patients with knee osteoarthritis. Arthritis
Rheumatol. 2014 Aug;66(8):2165-74.
7. Distel E, Cadoudal T, Durant S, Poignard A, Chevalier X, Benelli C. The infrapatellar fat pad
in knee osteoarthritis: an important source of interleukin-6 and its soluble receptor. Arthritis
Rheum. 2009 Nov;60(11):3374-7.
8. Klein-Wieringa IR, Kloppenburg M, Bastiaansen-Jenniskens YM, Yusuf E, Kwekkeboom JC,
El-Bannoudi H, et al. The infrapatellar fat pad of patients with osteoarthritis has an
inflammatory phenotype. Ann Rheum Dis. 2011 May;70(5):851-7.
9. Diepold J, Ruhdorfer A, Dannhauer T, Wirth W, Steidle E, Eckstein F. Sex-differences of the
healthy infra-patellar (Hoffa) fat pad in relation to intermuscular and subcutaneous fat
content--data from the Osteoarthritis Initiative. Ann Anat. 2015 Jul;200:30-6.
10. Iwata M, Ochi H, Hara Y, Tagawa M, Koga D, Okawa A, et al. Initial responses of articular
tissues in a murine high-fat diet-induced osteoarthritis model: pivotal role of the IPFP as a
cytokine fountain. PLoS One. 2013;8(4):e60706.
11. Gallagher J, Tierney P, Murray P, O'Brien M. The infrapatellar fat pad: anatomy and clinical
correlations. Knee Surg Sports Traumatol Arthrosc. 2005 May;13(4):268-72.
12. Divoux A, Tordjman J, Lacasa D, Veyrie N, Hugol D, Aissat A, et al. Fibrosis in human
adipose tissue: composition, distribution, and link with lipid metabolism and fat mass loss.
Diabetes. 2010 Nov;59(11):2817-25.
13. Chau YY, Bandiera R, Serrels A, Martinez-Estrada OM, Qing W, Lee M, et al. Visceral and
subcutaneous fat have different origins and evidence supports a mesothelial source. Nat Cell
Biol. 2014 Apr;16(4):367-75.
14. Gesta S, Bluher M, Yamamoto Y, Norris AW, Berndt J, Kralisch S, et al. Evidence for a role of
developmental genes in the origin of obesity and body fat distribution. Proc Natl Acad Sci U S
18
15. Tchkonia T, Lenburg M, Thomou T, Giorgadze N, Frampton G, Pirtskhalava T, et al.
Identification of depot-specific human fat cell progenitors through distinct expression profiles
and developmental gene patterns. Am J Physiol Endocrinol Metab. 2007 Jan;292(1):E298-307.
16. Eymard F, Chevalier X. Inflammation of the infrapatellar fat pad. Joint Bone Spine. 2016
Jul;83(4):389-93.
17. Gandhi R, Takahashi M, Virtanen C, Syed K, Davey JR, Mahomed NN. Microarray analysis of
the infrapatellar fat pad in knee osteoarthritis: relationship with joint inflammation. J
Rheumatol. 2011 Sep;38(9):1966-72.
18. Chatterjee TK, Stoll LL, Denning GM, Harrelson A, Blomkalns AL, Idelman G, et al.
Proinflammatory phenotype of perivascular adipocytes: influence of high-fat feeding. Circ Res.
2009 Feb 27;104(4):541-9.
19. Tchernof A, Belanger C, Morisset AS, Richard C, Mailloux J, Laberge P, et al. Regional
differences in adipose tissue metabolism in women: minor effect of obesity and body fat
distribution. Diabetes. 2006 May;55(5):1353-60.
20. Sun K, Tordjman J, Clement K, Scherer PE. Fibrosis and adipose tissue dysfunction. Cell
Metab. 2013 Oct 1;18(4):470-7.
21. Clements KM, Ball AD, Jones HB, Brinckmann S, Read SJ, Murray F. Cellular and
histopathological changes in the infrapatellar fat pad in the monoiodoacetate model of
osteoarthritis pain. Osteoarthritis Cartilage. 2009 Jun;17(6):805-12.
22. Udo M, Muneta T, Tsuji K, Ozeki N, Nakagawa Y, Ohara T, et al. Monoiodoacetic acid
induces arthritis and synovitis in rats in a dose- and time-dependent manner: proposed
model-specific scoring systems. Osteoarthritis Cartilage. 2016 Jul;24(7):1284-91.
23. Pellegrinelli V, Heuvingh J, du Roure O, Rouault C, Devulder A, Klein C, et al. Human
adipocyte function is impacted by mechanical cues. J Pathol. 2014 Jun;233(2):183-95.
24. Macchi V, Porzionato A, Sarasin G, Petrelli L, Guidolin D, Rossato M, et al. The Infrapatellar
19
Figure Legends
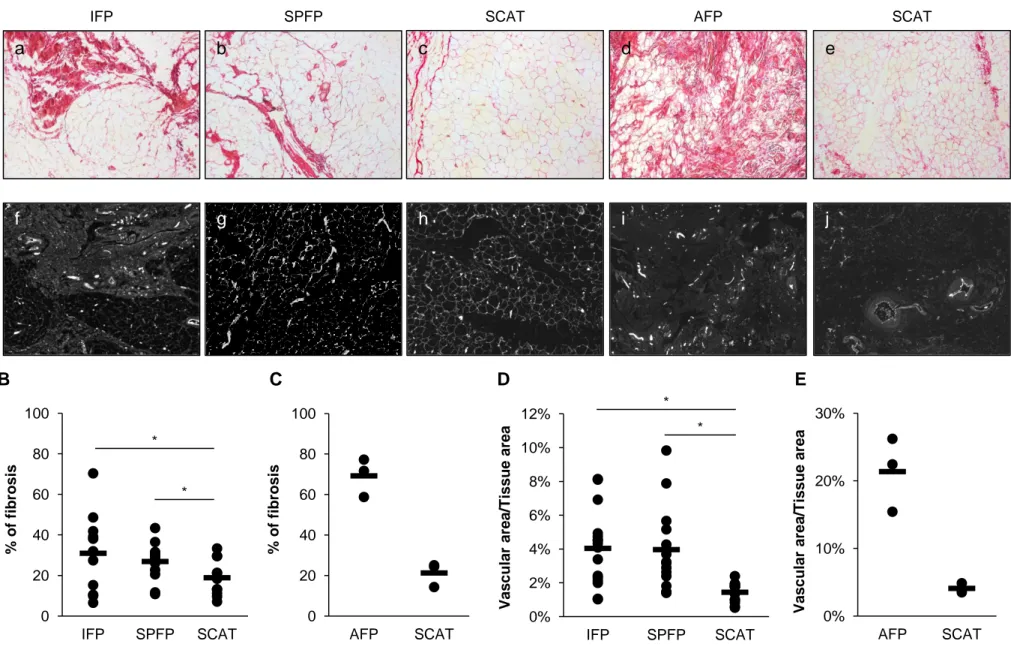
Figure 1. Histological characterization of fibrosis and vascularization in intra-articular adipose tissue (IAAT) and subcutaneous adipose tissue (SCAT) from end-stage osteoarthritis (OA) patients.
A) Paraffin sections (5 µm) of infrapatellar fat pad (IFP) (a and f), suprapatellar fat pad
(SPFP) (b and g), acetabular fat pad (AFP) (d and i) and SCAT (c, e, h and j) (n=16 for knee and
n=3 for hip tissues) were stained with picrosirius red for fibrosis determination (a-e) and for von
Willebrand factor (vWF) (f-j) for vessel quantification. Digital images of magnification views (x4)
of tissue sections were captured. In IAATs, fibrous tissue (stained in red) accumulated between
adipocyte lobules as large fascicles. In some cases, adipocytes and fibers were intermingled. In
contrast, the fibrous part of SCAT surrounded adipocyte lobules and few fibers were detected
among clusters of adipocytes (c and e). Quantification of the proportion of fibrosis and ratio of
vessel-to-tissue area in knee (n=16) (B and C) and hip tissues (n=3) (D and E). Knee IAATs have
significantly greater percentage of fibrosis and vessel area than autologous SCAT. Similar
observations are made for AFP compared to hip SCAT. Horizontal bar is mean and dots represent
each patient. *P<0.05
Figure 2. Histological characterization of leukocyte infiltration in IAAT and SCAT from end-stage OA patients.
A) Paraffin sections (5 µm) of IFP (a and f), SPFP (b and g), AFP (d and i) and SCAT (c, e,
h and j) (n=13 for knee and n=3 for hip tissues) were immunostained for CD45 leukocytes (a-e) and
tryptase, which targets mast cells (f-j). CD45- and tryptase-positive cells were mainly observed in
20
Quantification of the leukocyte (B and D) and mast cell infiltrates (C and E) of knee (B and C) and
hip IAATs and SCAT (D and E). More leukocytes and mast cells are present in IAATs than SCAT.
Data are mean ± SD. *P<0.05
Figure 3. Differential release of inflammatory factors by knee and hip IAATs and SCAT from end-stage OA patients.
Secretion of interleukin 6 (IL-6) (A and D), IL-8 (B and E) and prostaglandin E2 (PGE2) (C
and F) by knee (A-C) and hip IAATs (D-F) and autologous SCAT in conditioned media.
Measurements of 19 and 5 patients with knee and hip OA, respectively. Horizontal bar is mean and
dots represent each patient. *P<0.05
Figure 4. Inflammatory response of fibroblast-like synoviocytes (FLS) by stimulation by autologous knee intra-articular adipose tissues
FLS from 6 OA patients were treated or not with conditioned media from autologous IFP
and SPFP. Secretion of IL-6 (A) and MMP-1 (B) in FLS-conditioned media was determined by
ELISA. Horizontal bar is mean and dots represent each patient. *P<0.05
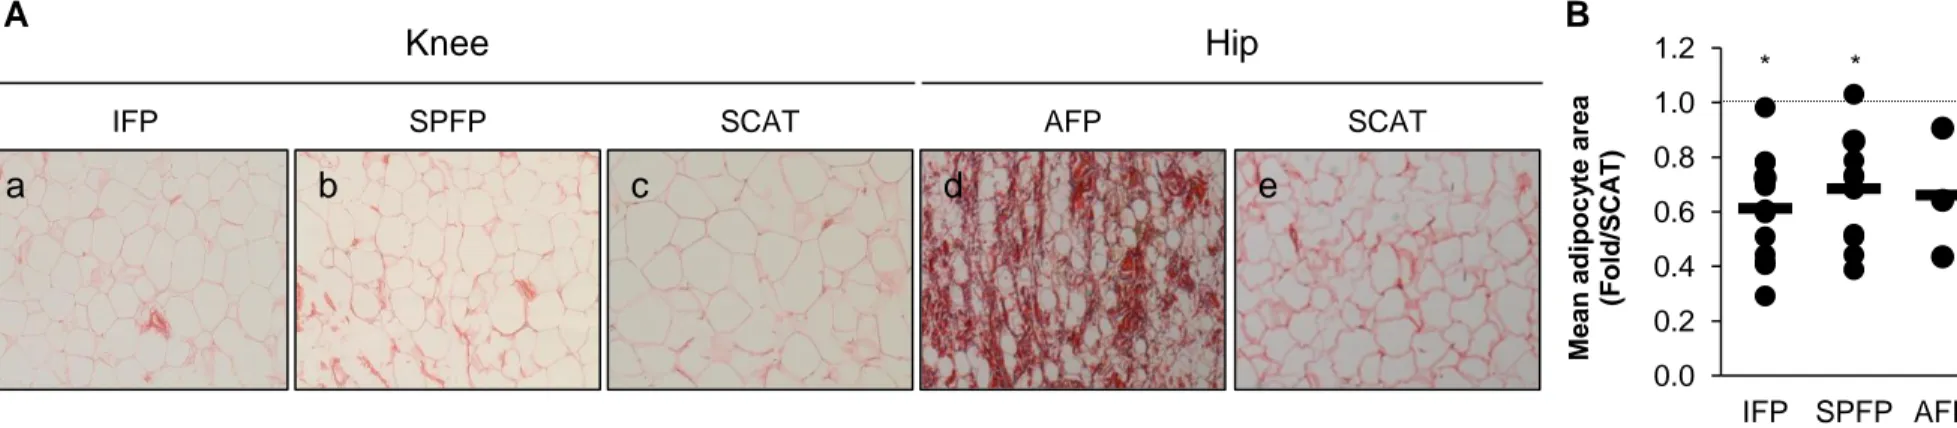
Figure 5. Mean adipocyte size in IAATs and SCAT from end-stage OA patients.
A) Paraffin sections (5 µm) of IFP (a), SPFP (b), AFP (d) and SCAT (c and e) (n=16 for
knee and n=3 for hip tissues) were stained with picrosirius red and adipocyte size was quantified. B)
Quantification of mean adipocyte size of knee and hip IAATs. The mean size of adipocytes from
knee IAATs is significantly lower than those of autologous SCAT. A similar observation is made
21
IAAT and its corresponding SCAT (set at 1.0, horizontal dotted line). Horizontal bar is mean and
dots represent each patient. *P<0.05
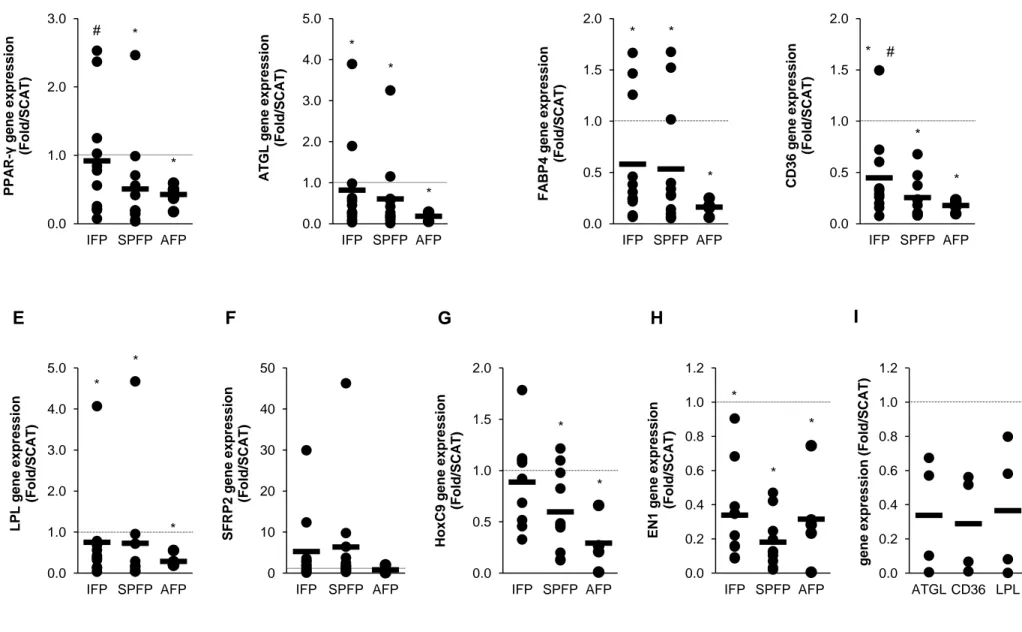
Figure 6. Differential gene expression pattern of knee and hip IAATs and autologous SCAT from end-stage OA patients.
A-H) Relative mRNA expression of PPAR-γ (A), ATGL (B), FABP4 (C), CD36 (D), LPL
(E), SFRP2 (F) HoxC9 (G) and EN1 (H) by IFP, SPFP and AFP to their corresponding SCAT from
knee (n=12) and hip (n=5) OA patients. I) Adipocytes from IFP and SCAT were isolated from 4
patients before determining mRNA expression of ATGL, CD36 and LPL. Data are fold increase
compared to SCAT, whose mRNA expression was set to 1 for each patient (horizontal dotted line).
22
Supplementary Figure 1. Intra-articular fat pads of the knee and hip
A) Several intra-articular fat pads are present in the knee. The largest is the infrapatellar fat
pad (IFP) or Hoffa’s tissue, which is located under the patella, behind the patellar tendon and in
front of the femoral condyles and tibial plateau. The suprapatellar fat pad (SPFP) is composed of
the quadriceps fat pad and the pre-femoral fat pad, which are located above the patella and behind
the suprapatellar bursa, respectively. The posterior fat pad (PFP) is in close contact with the
posterior articular capsule behind the menisci. B) The hip also contains one IAAT, the acetabular
fat pad (AFP), located in the acetabular fossa and surrounding the ligamentum teres. Illustrations
are from Servier Medical Art with modifications.
Supplementary Figure 2. Histological characterization of leukocyte infiltration in IAAT and SCAT from end-stage OA patients.
A) Paraffin sections (5 µm) of IFP (a, f and j), SPFP (b, g and j), AFP (d, h and k) and
SCAT (c and e, h) (n=13 for knee and n=3 for hip tissues) were immunostained for CD68
macrophages (a-e), CD3 T-lymphocytes (f-h) and CD20 B-lymphocytes (i-k). Macrophages were
present in IAATs and SCATs although found in higher number in IAATs from knee and hip. Some
IAATs also contained T- and B-lymphocytes. Original magnification x20 (a-e, g and j) and x10 (f,
h, i and k).
Supplementary Figure 3. Differential gene expression pattern of omental adipose tissue and autologous SCAT.
A-D) Relative mRNA expression of EN1 (A), HoxC9 (B), SFRP2 (C) and Wt-1 (D) by
omental (OM) adipose tissue and autologous SCAT (n=15). Horizontal bar is mean and dots
Figure 1 0 20 40 60 80 100 IFP SPFP SCAT % o f f ibrosis IFP a
SPFP SCAT AFP SCAT
b c d e f g i j E Knee Hip 0% 2% 4% 6% 8% 10% 12% IFP SPFP SCAT V as cular ar ea /T iss u e ar ea 0% 10% 20% 30% AFP SCAT V as cular ar ea /T iss u e ar ea A C B D * * * * h 0 20 40 60 80 100 AFP SCAT % o f f ibrosis
0.0 0.5 1.0 1.5 2.0 2.5 3.0 IFP SPFP SCAT T ry p tas e sc o ring 0.0 0.5 1.0 1.5 2.0 2.5 IFP SPFP SCAT CD45 s coring Figure 2 IFP a
SPFP SCAT AFP SCAT
b c d e f g h i j E Knee Hip A C B D * * 0.0 0.5 1.0 1.5 2.0 2.5 AFP SCAT CD45 s coring 0.0 0.5 1.0 1.5 2.0 2.5 AFP SCAT T ry p tas e s coring Tryptase CD45
Figure 3 0 50 100 150 200 250 300 IFP SPFP SCAT IL -6 (ng /g o f w et tiss u e ) 0 30 60 90 120 150 180 IFP SPFP SCAT IL -8 (ng /g o f w et tiss u e) 0 100 200 300 400 500 600 700 IFP SPFP SCAT P G E 2 ( ng /g o f w et tiss u e ) 0.0 0.2 0.4 0.6 0.8 1.0 1.2 AFP SCAT P G E 2 (µg /g o f w et tiss u e) 0 10 20 30 40 AFP SCAT IL -8 (ng /g o f w et tiss u e) 0 50 100 150 200 250 300 AFP SCAT IL -6 (ng /g o f w et tiss u e) E A B C D F * * * * * * * * *
Figure 4 0 50 100 150 200 250 300 350 Ctrl IFP SPFP IL -6 (n g /L) 0.0 0.5 1.0 1.5 2.0 2.5 3.0 3.5 Ctrl IFP SPFP MMP -1 (µg /L) * * * * A B
Figure 5 0.0 0.2 0.4 0.6 0.8 1.0 1.2 IFP SPFP AFP M e a n a di po c y te a rea (Fo ld /SCA T) IFP a
SPFP SCAT AFP SCAT
b c d e
Knee Hip
A B
* *
Figure 6 0 10 20 30 40 50 IFP SPFP AFP SFRP2 ge ne e x pre s s io n (Fo ld /SCA T) 0.0 1.0 2.0 3.0 IFP SPFP AFP PPA R -γ ge ne e x pre s s io n (Fo ld /SCA T) 0.0 1.0 2.0 3.0 4.0 5.0 IFP SPFP AFP A TGL g e ne e x pre s s io n (Fo ld /SCA T) 0.0 0.5 1.0 1.5 2.0 IFP SPFP AFP FA BP4 ge ne e x pre s s io n (Fo ld /SCA T) 0.0 0.5 1.0 1.5 2.0 IFP SPFP AFP Hox C9 ge ne e x pre s s io n (Fo ld /SCA T) 0.0 0.5 1.0 1.5 2.0 IFP SPFP AFP CD 3 6 ge ne e x pre s s io n (Fo ld /SCA T) 0.0 1.0 2.0 3.0 4.0 5.0 IFP SPFP AFP LPL ge ne e x pre s s io n (Fo ld /SCA T) 0.0 0.2 0.4 0.6 0.8 1.0 1.2 IFP SPFP AFP EN1 ge ne e x pre s s io n (Fo ld /SCA T) A B C D E F G H * * # * * * * * * * * * * * * * * * * * # 0.0 0.2 0.4 0.6 0.8 1.0 1.2 ATGL CD36 LPL ge ne e x pre s s io n (Fo ld /SCA T) I
Supplementary Figure 1
A B
Synovial membrane Patella
Articular capsule Infrapatellar fat pad Femur
Tibia Quadriceps
Supra-patellar fat pad
Posterior fat pad Quadriceps fat pad Pre-femoral fat pad
Femoral head Ligamentum teres
Femur Ilium
Supplementary Figure 2 IFP
a
SPFP SCAT AFP SCAT
b c d e Knee Hip CD68 IFP SPFP AFP CD3 CD20 f g h i j k
A B C 0.000 0.001 0.002 0.003 0.004 OM SCAT E N1 gene e x pre s s ion * 0.000 0.001 0.002 0.003 0.004 0.005 OM SCAT HoxC9 gene e x pre s s ion * 0.000 0.010 0.020 0.030 0.040 0.050 OM SCAT S F RP 2 g ene ex p res sion * 0 1000 2000 3000 4000 5000 6000 7000 8000 OM SCAT WT -1 gene e x pre s s ion * D Supplementary Figure 3
Supplementary Table 1. Sequence of primers used for RT-PCR studies.
Gene Forward primer (5’-3’) Reverse primer (5’-3’)
18s GCAATTATTCCCCATGAACG GGGACTTAATCAACGCAAGC
PPAR-γ GACAGGAAAGACAACAGACAAATC GGGGTGATGTGTTTGAACTTG
ATGL CCAAGCGGAGGATTACTCG GAGAGGGTGGTCAGCAGGT
FABP4 CCTTTAAAAATACTGAGATTTCCTTCA GGACACCCCCATCTAAGGTT
LPL TGACCAATAAGAAAGTCAACAGAATTA CTCTGGTGAATGTGTGTAAGACG
CD36 GTGCCTATTCTTTGGCTTAATGA TTACTTGACTTCTGAACATGTTTGC
EN1 TCGGACAGGTGCTATCGAA AAGGAGTTCGCAGTTTCGTC
HoxC9 CGTGCCCTCTCAGTCGTC GCCAAGTCCGCATGTAGC
sFRP2 GCCTCGATGACCTAGACGAG GGTCGCACTCAAGCATGTC
Supplementary Table 2. Characteristics of knee and hip OA patients. Knee Hip Number of patients 38 5 Age, years 73.3 ± 6.5 73.0 ± 3.3 Gender (Female), n (%) 29 (76.3) 3 (60) Weight, kg 76.7 ± 12.4 75.2 ± 11.7 Height, cm 161.7 ± 7.6 165.6 ± 7.2
Body mass index, kg/m2 29.3 ± 5.0 27.4 ± 4.4
Hypertension, n (%) 29 (76.3) 3 (60)
Diabetes, n (%) 5 (13.2) 1 (20)
Dyslipidemia, n (%) 18 (47.4) 2 (40)
Supplementary Table 3. Relationship between adipose tissue characteristics and obesity and gender
OBESITY GENDER
Obese Non-obese p-value Female Male p-value
IF
P
IL-6 (ng/g) 12.6 [2.2–23.0] 66.3 [16.7–115.8] 0.06 26.8 [6.9–46.7] 69.5 [0.0–153.5] 0.46 IL-8 (ng/g) 16.0 [6.4–25.5] 30.3 [2.9–57.8] 0.65 18.8 [9.6–28.0] 33.8 [0.0–79.0] 0.93 PGE2 (ng/g) 36.7 [0.0–79.3] 65.5 [0.0–133.4] 0.57 45.2 [8.1–82.2] 66.4 [0.0–172.6] 0.54 Fibrosis (%) 37.9 [13.6–62.2] 27.5 [16.7–38.2] 0.50 27.3 [14.1–40.5] 43.8 [34.5–53.2] 0.16 Vascular area (%) 4.1 [2.4–5.7] 4.0 [2.5–5.5] 0.66 3.3 [2.4–4.3] 6.5 [3.4–9.7] 0.04Adipocyte area (pixels) 0.16 [0.12–0.19] 0.16 [0.14–0.19] 0.56 0.15 [0.13–0.17] 0.22 [0.22–0.22] 0.11
SP
F
P
IL-6 (ng/g) 37.7 [0.0–79.3] 79.7 [27.0–132.3] 0.10 50.6 [8.8–92.5] 77.0 [23.0–131.1] 0.16 IL-8 (ng/g) 40.4 [0.0–81.6] 45.1 [12.0–78.1] 0.63 40.4 [5.1–75.6] 48.8 [23.7–74.0] 0.13 PGE2 (ng/g) 152.2 [17.8–286.5] 99.0 [0.0–224.9] 0.83 146.6 [24.9–268.3] 70.9 [0.0–142.4] 0.59 Fibrosis (%) 22.0 [14.3–29.6] 29.3 [22.7–36.0] 0.09 25.6 [19.7–31.5] 35.8 [21.0–50.6] 0.35 Vascular area (%) 3.8 [1.6–6.0] 4.1 [2.4–5.7] 0.64 3.9 [2.8–4.9] 5.6 [0.0–13.9] 1.0Adipocyte area (pixels) 0.22 [0.18–0.25] 0.16 [0.14–0.18] 0.06 0.18 [0.15–0.21] 0.20 [0.20–0.20] 0.60