Desalination and Its Potential for Harnessing Brine and Solar Energy in the US Virgin Islands
by Michelle Miilu
B.S., Natural Resources and Environmental Science (1997) Purdue University
Submitted to the Department of Civil and Environmental Engineering in Partial Fulfillment of the Requirements for the Degree of Master of Engineering in Civil and Environmental Engineering
at the
Massachusetts Institute of Technology June 2003
© 2003 Massachusetts Institute of Technology All rights reserved
Signature of A uthor ...
Department of Civil and Environmental Engineering May 9, 2003
C ertified by ... .... .. .. ... E. Eric Adams Senior Research Engineer Thesis Supervisor
Accepted by ...
Oral Buyukozturk Professor of Civil and Environmental Engineering Chairman, Committee on Graduate Studies
MASSACHUSETTS INSTITUTE OF TECHNOLOGY
Desalination and Its Potential for Harnessing Brine and Solar Energy
in the US Virgin Islands
by Michelle Miilu
Submitted to the Department of Civil and Environmental Engineering on May 9, 2003 in Partial Fulfillment of the
Requirements for the Degree of Master of Engineering in Civil and Environmental Engineering
ABSTRACT
A review was conducted of potential methods for achieving desalination sustainability with specific reference to the US Virgin Islands. Thermodynamic efficiency, industrial ecology, and renewable energy were assessed for their application in desalination and contextual relevance to specific desalination processes. Renewable energy was
determined to provide the greatest near-term potential for moving towards sustainable desalination. High desalination energy requirement and near-complete dependence on fossil fuels, the applicability of renewable energy to any desalination process and the advanced level of renewable energy technologies were key factors in this determination. An analysis was then performed of three renewable energy technologies for a mechanical vapor compression desalination plant on St. John, USVI. Solar pond, photovoltaic, and wind turbine energy were evaluated for their feasibility and the benefits towards
sustainability they provide. Wind turbine energy was determined most suitable for the St. John plant in both respects.
Thesis Supervisor: E. Eric Adams Title: Senior Research Engineer
ACKNOWLEDGEMENTS
God
My parents
Friends and family
Those at MIT who provided advisement, technical expertise, and encouragement Dr. E. Eric Adams Dr. Pete Shanahan Daniele Lantagne Lee Hersh Tim Anderson Paul Elliot Dr. Edward Kern, Jr. Susan Murcott Dr. Jefferson Tester
The USVI Water and Power Authority, particularly Glenn Rothgeb
Louin Chung Dale Hendrickson
Others providing USVI desalination assistance and understanding Joel Kling
Randy Baustert Don Goetz Ron Di Cola Lincoln Critchley
Lianna Jarecki for providing technical expertise on the Virgin Islands All the wonderful people of St. John, especially
Elaine Estern
Residents of Frank Bay
The Virgin Islands Audubon Society The "Smoothie Man"
TABLE OF CONTENTS
I. BACKGROUND
7
A NEED FOR WATER 7
DESALINATION AS A SOLUTION 7
OUTLINE OF RESEARCH 9
II. SUSTAINABILITY
11
SECOND LAW EFFICIENCY 11
INDUSTRIAL ECOLOGY 12
RENEWABLE ENERGY 13
III. SUSTAINABILITY APPLIED TO DESALINATION
15
CURRENT STATE OF DESALINATION, COGENERATION 15
POSSIBILITIES FOR REDUCING DESALINATION LINEARITY 16
RENEWABLE ENERGY APPLICATIONS IN DESALINATION 19
Wind 19
Photovoltaics 21
Solar Thermal 22
IV. CASE STUDY OF ST. JOHN, USVI
26
DESALINATION 26
ENERGY 28
RENEWABLE ENERGY ANALYSIS 28
Solar Pond Design Considerations 30
Solar Pond Results 32
Photovoltaic Design Considerations 33
Photovoltaic Results 34
Wind Turbine Considerations 37
Wind Turbine Results 37
V. CONCLUSION
40
VI. BIBLIOGRAPHY
42
VII. APPENDICIES
47
A. SOLAR POND BENEFIT-COST ANALYSIS CALCULATIONS 47
Land 47
Excavation 49
Pond Liner 50
Fencing 50
Rankine Cycle, Pumps, and Piping 51
Monitoring Equipment 51
Maintenance and Repair 52
Labor 52
B. PHOTOVOLTAIC BENEFIT-COST ANALYSIS CALCULATIONS 54
Number and Cost of Panels 54
Land 54
Energy Produced 54
Inverter 55
Mounting Equipment 55
Operation and Maintenance 55
Installation 55
Project Life 56
C. WIND TURBINE BENEFIT-COST ANALYSIS CALCULATIONS 57
Wind Speed Adjustment 57
Height Adjustment 57
Power Output 57
Energy Limit Considerations 58
Turbine Cost 59
Benefit Analysis 59
LIST OF FIGURES
Figure 1 - Process Linearity Schematic 12
Figure 2 - Industrial Ecology Schematic for Kalundborg, Denmark 13 Figure 3 - Comparison of CO2 Emissions Among Energy Sources 14
Figure 4 - Osmosis Schematic 18
Figure 5 - Water Vapor Pressure at Selected Salinities 19
Figure 6 - Salinity-Gradient Solar Pond Schematic 23
Figure 7 - Density vs. Seawater Salinity at 25'C 31
Figure 8 - Seawater Density vs. Temperature at 35000 ppm Salinity 31
Figure 9 - Photovoltaic Output Over Time by Panel Tilt 34
Figure 10 - Photovoltaic Inverter Power and Efficiency Correlation 35
Figure 11 - St. Thomas and St. John Wind Class Areas 38
Figure 12 - Manufacturer's Power Curve for Proposed Wind Turbine 58 Figure 13 - Year 2000 U of the Virgin Islands Weather Station Wind Averages 60 Figure 14 - Year 2001 U of the Virgin Islands Weather Station Wind Averages 60 Figure 15 - Year 2002 U of the Virgin Islands Weather Station Wind Averages 60 Figure 16 - Year 2000 U of the Virgin Islands Weather Station Hourly Wind
Variation 61
Figure 17 - Year 2001 U of the Virgin Islands Weather Station Hourly Wind
Variation 61
Figure 18 - Year 2002 U of the Virgin Islands Weather Station Hourly Wind
Variation 61
LIST OF TABLES
Table 1 - Theoretical Minimum Comparison of Desalination Exergies 9 Table 2 - Energy Requirements for Common Desalination Types 9 Table 3 - Water Costs from Seawater Desalination and Other Sources 10 Table 4 - Percent of Influent Becoming Potable Water and Brine Concentrate 17
Table 5 - 2002 St. John Public Water Production 30
Table 6 - Solar Pond Benefit-Cost Analysis 33
Table 7 - Photovoltaic Benefit-Cost Analysis 36
Table 8 - Wind Energy Benefit-Cost Analysis 39
Table 9 - Comparison of Proposed Renewable Energy Sources 40 Table 10 - Average Horizontal Irradiation (W/m2 at Pacquereau Bay, VI) 48
I.
Background
A Need for Water
The right to water is widely recognized by the international community (UN, 2003); however, as of 2000, approximately 1.1 billion people do not have access to improved water supplies (WHO, 2000). That is, they lack reliably safe water of sufficient quantity, 20 Iiday per capita, to meet basic personal consumption and hygiene needs. In addition, existing water sources are becoming less reliable. Extraction of groundwater at rates higher than it can be replenished has caused saltwater intrusion in coastal areas such as Florida, California, and Hawaii in the US as well as subsidence and the threat of aquifer depletion, or at least aquifer inaccessibility where only suction pump wells are available. Contamination of water sources by chemicals and human and animal wastes make an increasing number of water sources unsafe (Miller, 2002). An estimated 45 percent of all municipal drinking water sources in the US are currently contaminated. Further
contributing to the problem is that global water resources are not equally distributed geographically and, in some areas, seasonally. As a result of scarce water resources crossing national boundaries, international treaties have thus far been successful at maintaining a "fair enough" distribution. However, as populations increase, resources dwindle, and conservation efforts are pushed to their limits, it is predicted that violent conflict may result from a need for water.
Desalination as a Solution
There is no one solution to the problem of water unavailability. Though conservation efforts are often an obvious first consideration, these are increasingly not sufficient. Where efforts such as water reuse and rainwater collection are also insufficient or not considered desirable sources of water, communities, particularly those in coastal areas, are choosing to rely on desalination to meet their needs. Only about 3 percent of the earth's water is fresh and, of this amount, the majority is frozen in glaciers or icecaps or is inaccessible due to location. Alternatively, the 97 percent that is saline ocean water equates to a potentially limitless supply of water through desalination.
There are currently several methods of desalting water with the most common large-scale methods being multi-stage flash (MSF), multiple effect distillation (MED), vapor
compression (VC), and reverse osmosis (RO). The first three of these fall under the general category of distillation. In distillation, saline water is vaporized and, as salt does not appreciably enter the vapor phase, the subsequent condensate is nearly pure water. In multi-stage flash, vaporization is accomplished by a combination of thermal energy input and a lowering of the vapor pressure. And both multiple effect distillation and vapor compression rely solely on thermal energy for this phase change. The difference is that multiple effect requires a constant input of thermal energy to maintain its process,
whereas with vapor compression thermal input is only required to start the process. Once the vapor is initially formed, it is mechanically compressed and the resulting rise in temperature provides the thermal energy for subsequent vaporization. Reverse osmosis, by comparison, requires no phase change but rather works by passing saline water through a semipermeable hydrophilic membrane against its natural salt-concentration gradient. The membrane allows water to pass through while retaining most of the salt.
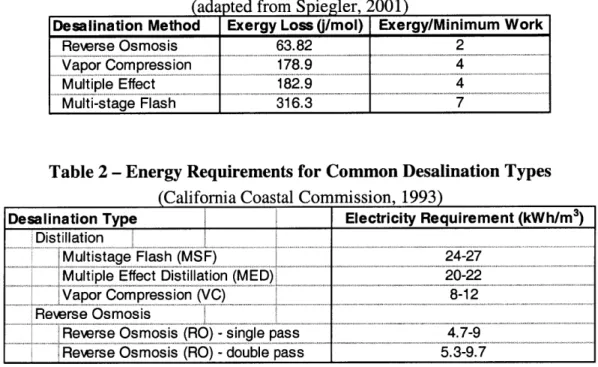
What limits desalination as a source of potable water is the large amount of energy required. The theoretical minimum work needed to desalt seawater at 25'C is 0.7 kWh/M3 (Spiegler and El-Sayed, 2001). However, as desalination is not a reversible process, about 2 to 7 times this amount of energy is needed at a minimum depending on the desalination method being used. Table 1 indicates the relative minimum exergy loss for each of the main types of desalination. In accordance with the second law of
thermodynamics, as entropy increases, energy becomes less available to perform useful work. Exergy, then, is a measure of the useful work which can be performed.
Distillation methods result in a much higher exergy loss mainly due to the heat of vaporization. It should also be noted that the energy requirement, and thus the exergy loss, would decrease if desalinating brackish water using the reverse osmosis process; however, salinity level does not appreciably change the energy required for distillation processes (CCC, 1993). Actual desalination processes currently operating require up to 30 times the theoretical minimum work although it is predicted that as little as 10 times
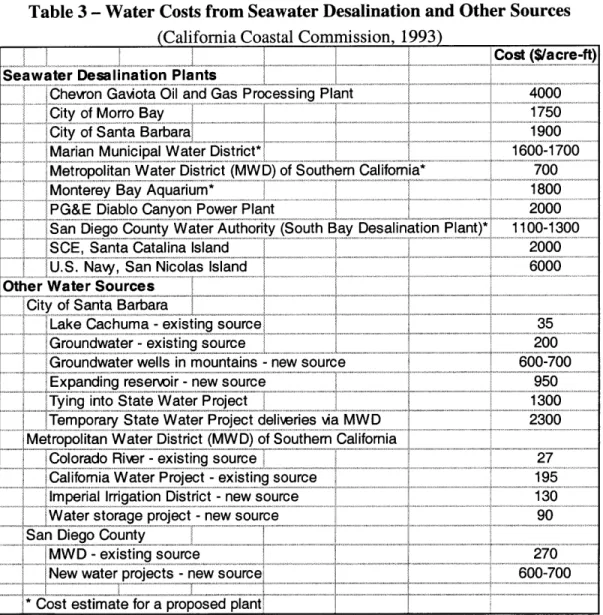
the theoretical minimum will eventually be possible (Gleick, 1994). If all of the energy required for desalination, then, is derived from electricity, the requirements to desalinate seawater are indicated by Table 2. However, if heat is used to drive thermal distillation processes to the fullest extent possible, the electricity requirement decreases by 21 kWh/m3 and 17.8 kWh/m3 for multistage flash and multiple effect distillation
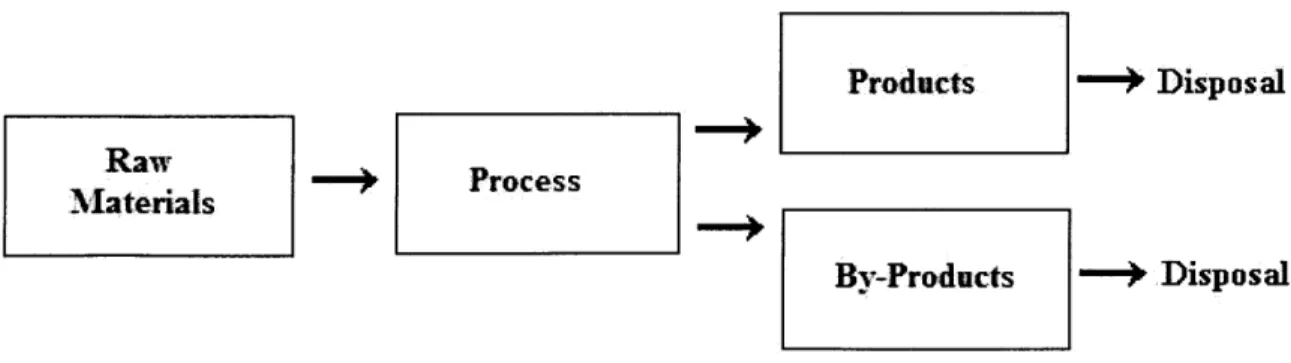
respectively. Still, even this lowered electricity requirement is significantly greater than what is required for conventional water sources as depicted by the relative costs for these water sources in Table 3.
Table 1 - Theoretical Minimum Comparison of Desalination Exergies (adapted from Spiegler, 2001)
Desalination Method Exergy Loss (/mol) Exergy/Minimum Work
Rewrse Osmosis 63.82 2
Vapor Compression 178.9
Multiple Effect 182.9 4
Multi-stage Flash 316.3 7
Table 2 - Energy Requirements for Common Desalination Types (California Coastal Commission, 1993)
Desalination Type Electricity Requirement (kWh/M 3) Distillation
Multistage Flash (MSF) 24-27
Multiple Effect Distillation (MED) 20-22
Vapor Compression (VC) 8-12
Reerse Osmosis
Rewrse Osmosis (RO) - single pass 4.7-9 Rewrse Osmosis (RO) - double pass 5.3-9.7
Outline of Research
This study analyzes sustainability as it pertains to desalination and specifically as it pertains to desalination for St. John, USVI. Methods of moving desalination towards sustainability are discussed and considered in their applicability for current and future use and the benefits they provide. Thermodynamically efficient use of energy resources, industrial ecology, and renewable energy are all considered in this discussion. Specific renewable energy sources discussed in relation to their current use in desalination include
solar thermal, photovoltaics, and wind energy sources. A case study analysis of
desalination by the public water utility on St. John then illustrates the specific potential for increasing desalination sustainability for this facility. An initial review of their desalination and energy situation is followed by an analysis of proposals for solar pond, photovoltaic, and wind energies to be used for providing increased sustainability.
Table 3 - Water Costs from Seawater Desalination and Other Sources (California Coastal Commission, 1993)
Seawater Desalination Plants
Chevron Gaviota Oil and Gas Processing Plant City of Morro Bay
City of Santa Barbara
Marian Municipal Water District*
Metropolitan Water District (MWD) of Southern California* Monterey Bay Aquariurn*
PG&E Diablo Canyon Power Plant
San Diego County Water Authority (South Bay Desalination
SCE, Santa Catalina Island U.S. Navy, San Nicolas Island Other Water Sources
City of Santa Barbara
Lake Cachuma -exsting source Groundwater - existing source
Groundwater wells in mountains - new source Expanding reservoir - new source
Tying into State Water Project
Temporary State Water Project deliveries via MWD Metropolitan Water District (MWD) of Southern California
Colorado River - existing source
California Water Project - existing source Imperial Irrigation District -new source Water storage project new source San Diego County
MWD -existing source
New water projects - new source
* os 7estimate for a proposed plant
Cost ($/acre-ft) 4000 1750 1600-1700 700 1800 2000 1100-1300 2000 6000 35 200 600-700 950 1300 2300 27 195 130 90 270 600-700 Plant)*
1I.
Sustainability
Sustainability is commonly defined as meeting, "the needs of the present without
compromising the ability of future generations to meet their needs" (WCED, 1987). True sustainability would require maintaining constant equilibrium, or a net gain, with the earth's resources. That is, using resources such as water or energy only at the rate, or more slowly, at which they can be provided. In terms of water resource sustainability, desalination is fairly close to this equilibrium. That is, desalinating water does not consume existing fresh water resources beyond what is required to manufacture the plant and desalinated water is generally consumed at the same rate as it's produced. However, for the great majority of desalination facilities, equilibrium of energy resources is not maintained and desalinating water serves as a tremendous energy sink in addition to what is used in plant construction. Of the global capacity for desalination, over 99 percent is derived from fossil fuels (Delyannis and Belessiotis, 1995). And although discovery of fossil fuel resources has been keeping pace with extraction, actual creation of new fossil fuels can be considered non-existent by comparison.
If desalination is to become sustainable, then, it will be necessary to dissociate the dependence of the process as much as possible from fossil fuels. Mere efficiency of fossil fuel use would not be sufficient. Possible methods towards sustainability include using energy that is lower on the thermodynamic scale, closing process loops, and using renewable energy.
Second Law Efficiency
The value in energy is its ability to perform work (Simpson and Kay, 1989). Therefore, the more work a particular form of energy is capable of performing, which is based mainly on concentration, the more valuable it is. For example, although they would become more valuable in proportion to their concentration, heat and sound energy are less useful for performing work than energy in the form of electricity. Although for all cases, the same amount of energy could be present, thermal or sound energy is less useful for doing work since it would be spread over a larger area. Therefore, given a process
that requires thermal energy, it is preferable to use a source of thermal energy over the conversion of an electrical energy source to thermal energy. Conversely, given a source of thermal energy, a process that can take advantage of this thermal energy should be preferred to one that cannot.
Industrial Ecology
The concept of closing process loops, also called industrial ecology, is something of an old idea with a new application. Industrial ecology has its basis in natural environmental cycles. For example, in a nutrient cycle, leaves fall from trees to the forest floor where they are degraded by microorganisms. These microorganisms then release the nutrients that had been stored in leaves back into the soil by excreting wastes. Finally, the nutrients are again assimilated by trees. In this way, a forest ecosystem maintains equilibrium and does not constantly require additional nutrient inputs from sources outside the forest. Traditionally, however, industrial processes have required continuous outside inputs of all raw materials and have thereby had no semblance of the
sustainability demonstrated by natural ecosystems. In short, while natural processes tend to be cyclic, industrial processes tend to have linear flow-through of materials. (Figure 1) Process linearity is not sustainable. Even if the raw material production rate equaled the rate of raw material use, unless resulting products and by-products are also reinvested, disposal rates will be greater than the earth's ability to take them resulting in a lack of equilibrium. Products --
>
Disposal Raw Raw- Process Mlatenials By-Products - DisposalLinearity does not have to be the rule, though, with many on-going examples of
successful process looping. Commonly loops are created by cycling back waste heat or water, but a more comprehensive model can be found in Kalundborg, Denmark where waste products have been incorporated as resources for a number of uses. (Figure 2)
Sulfuric Acid Sulfur
Kemira Water Lake Tisso Water Petroleum Refinery Statoil E V) 4) *..(V 4" Power Station Asnaes E WU if! Water Fertilizer + -Sludge Pharmaceuticals Novo Nordisk Heat P Greenhouses Heat
Heat District Heating
Gas ______ _ Wallboard Gypsum Gyproc Heat Fish Farming Fly Ash -~ Cement; Roads
Figure 2 - Industrial Ecology Schematic for Kalundborg, Denmark (Wemick and Ausubel, 1997)
Renewable Energy
Unlike fossil fuels, renewable energy is constantly being replenished. Therefore, it is possible to maintain energy resource equilibrium even with large scale energy use. The use of renewable energy not only lessens, or even eliminates, the unsustainable
consumption of fossil fuels, but also the pollutants they produce. These pollutants include sulfur dioxide, particulates, and an annual global discharge of over 20 billion tonnes of the greenhouse gas carbon dioxide (Cassedy, 2000). (Figure 3) Practical processes for the capture of renewable energy are continuously becoming more numerous and more economical with the vast majority of renewable energy sources having their
basis from the sun. These solar sources include direct solar power as well as power derived from wind, biomass, and ocean thermal sources. Those renewable energy sources not having their basis from the sun include geothermal and tidal power.
S C [g/kWIWI o 980 1000-.5 0 800- 600-442 400-00 200 2 o 84 C12 21 15 18 16 0 ~ 41 ae~e
Figure 3 - Comparison of CO2 Emissions Among Energy Sources
III.
Sustainability Applied to Desalination
Since desalination is such an energy intensive process and globally the vast majority of this energy is derived from fossil fuels, there is great room for improvement in
desalination sustainability. It is also particularly important to strive for desalination sustainability due to the ever-increasing need for this source of fresh water. Although efforts have been made to increase process efficiency, this does not necessarily equate to sustainability. Efficiency increase is certainly a step in the right direction, however, this contribution is miniscule when one considers that in general efficiency creates
improvements at a rate of 1-2 percent per year. In contrast, the capacity for desalinating water has approximately doubled in the past 2 years (Wiseman, 2002). Sustainability would mean completely breaking the link between desalination and unsustainable energy sources, not just gradually reducing the unit energy requirement.
Current State of Desalination, Cogeneration
Most efforts which increase desalination sustainability currently consist of using direct thermal energy for distillation. Due to the high energy requirement for desalinating water, it is often economically beneficial to site distillation desalination plants with cogeneration power plants. By this pairing, not only is it possible to avoid any significant electricity transmission losses, but waste heat produced by the cogeneration plant can be used to heat influent water. In practice, however, it is not necessarily waste heat that is used (El-Nashar, 2001; Cohen, 2002). Rather, often steam of a temperature still high enough for producing electricity is used for heating desalination influent water. Although economic benefits can still be realized despite sacrificing electricity production, it is possible to derive all needed thermal energy from cogeneration without compromising electricity production, thereby increasing process sustainability, particularly when using low temperature distillation processes (Cohen, 2002).
However, only distillation processes can make use of heat in desalting water. Other methods are limited to the use of higher grades of energy, mechanical or electrical. This
is particularly of interest due to the increasing construction of reverse osmosis desalination facilities (Wiseman, 2002). While distillation is still preferred for some applications such as high capacity or high purity demands, reverse osmosis installed capacity percentage is steadily increasing due to its decreasing costs and increasing flow capacities. As a result, it is expected that cogeneration power and desalination facilities may gradually be replaced by reverse osmosis plants leaving power plants as stand alone facilities (Darwish, 2001). Sustainable desalination by reverse osmosis might be
possible, though, through industrial ecology and some renewable energy applications although not to the extent as is possible by distillation.
Possibilities for Reducing Desalination Linearity
In an attempt to close desalination loops, it is necessary first to consider the products of desalination. Direct products produced in small quantities include waste heat from distillation, used membranes from reverse osmosis, and used treatment chemicals, potentially from both processes but predominantly from reverse osmosis (Van der Bruggen, 2002). Waste heat from distillation is already commonly recycled back into distillation processes to heat influent water. No standard recycling method currently exists for either used membranes or treatment chemicals. However, the quantities of these materials are quite small compared to the main direct products of desalination, potable water and brine. Due to the quantities of brine produced and that it is produced regardless of desalination process, it is an obvious initial target for the possibility of closing loops.
Each desalination process requires a different amount of influent to produce a desired amount of potable water (Table 4). A larger percent recovery indicates a greater amount of fresh water produced per unit of influent water. It follows then that a larger percent recovery would also result in a lower percent disposed as waste concentrate and thus a higher brine salinity. Distillation percentages adding up to over 100 percent are reflective of brine being recycled back into the distillation process since, unlike reverse osmosis, distillation efficiency has little sensitivity to high salinity levels. In most cases this brine is treated as a waste product, and, for seawater desalination plants, this waste is often
discharged to the ocean. Brine discharge is legally supported by US state and federal authorities to those holding a National Pollutant Discharge Elimination System (NPDES) permit (or TPDES for US territories), and there are currently no NPDES permit
restrictions on brine effluent salinity with most permits only limiting flow quantity, pH, and temperature.
Table 4 - Percent of Influent Becoming Potable Water and Brine Concentrate
(US Congress, 1988)
Percent Recovery Percent Disposed as Process of Feed Water Waste Concentrate
Distillation 25-65 5-75
Brackish Water RO 50-80 20-50
Seawater RO 20-40 60-80
Rather than being simply a waste byproduct of desalination, however, it is possible to make further use of brine. In inland areas, where discharge of brine is not possible, brine disposal is often a significant concern. Although some facilities choose underground injection as a method of disposal, others make use of the brine and discharge it to evaporation ponds. Once the remaining water has evaporated, salt can then be collected and sold, generally as rock salt.
There are also many possible ways to partially recover energy from brine. One method of energy recovery is by osmosis. By separating water of differing salt concentrations, for example brine and either seawater or brackish water, by a semi-permeable hydrophilic membrane, that water with the lower salt concentration would flow across the membrane in an attempt to equalize the salinity concentrations as the semi-permeable membrane would only allow water to pass. (Figure 4) The energy potential can by quantified by the Van't Hoff equation for osmotic pressure
H= iMRT (1)
where H is osmotic pressure, i is the Van't Hoff factor which can be thought of as effective ion dissociation, M is molarity, R the gas constant, and T absolute temperature.
Figure 4 - Osmosis Schematic
A second method of recovering energy from brine is by taking advantage of the vapor pressure differential between the brine and water of lesser salinity, for example seawater or brackish water (Wick, 1978). (Figure 5) By separating these two fluids by a
hydrophobic membrane, salinity concentrations would not be able to equilibrate and, therefore, the differential in vapor pressure against the membrane could be captured as an energy source. There are still other methods of deriving brine energy as well, however, none of these methods which use only desalination brine without additional inputs are currently at a level of development for practical use. A drawback to the method of
energy production by vapor pressure differential is that, since vapor pressure is exponentially related to temperature as seen in Figure 5, higher temperatures than are normally found in desalination would likely be necessary, and in particular with respect to the lesser salinity water, to get an acceptable net level of energy. Also, in neither the vapor pressure nor osmosis methods, is there currently a suitable membrane in existence (Ludwig, 2002). Even under ideal conditions, greater flow volumes and/or salinity differences than are normally found in desalination would be necessary to make these methods economically feasible although, in general, distillation would likely be more suited for these methods of energy recovery as distillation facilities tend to have greater flows and higher brine concentrations (Loeb, 2002).
SO 700 600 500 PRESSURE (mm Hg) 400 300 200 00
F-
4626
76 FRESH LIQUID REGION SEA WATER 3,45% SoiritY WATER 28% Sokty VAPOR REGION I I I I I U I 4 0 10 20 30 40 50 60 70 80 90 100 TEMPERATURE (C)Figure 5 - Water Vapor Pressure at Selected Salinities (Wick, 1981)
Renewable Energy Applications in Desalination
Although commercial salt production from desalination is rather promising, it does not specifically address the energy requirements of the desalination process. Energy production from brine sources alone is currently not technically feasible nor can it be expected to be economically feasible in the near future, but the application of renewable energy sources to desalination has significantly more near-term potential for increasing sustainability.
Wind
Modem wind turbines operate by the creation of a lift force, similar to that on an airplane wing or a sailboat moving into the wind, on the turbine blades as the wind blows
amount of energy produced increases with wind speed to the third power though they cannot be operated in very high winds, greater than 16-25 m/s depending upon the turbine.
Since at least 1984 wind turbines have produced electricity for desalination (Garcia-Rodriguez, 2002). Due to the variable nature of wind, however, most of these facilities are also connected to an alternate power source, either a generator or the electrical grid, in order to provide adequate water supply at times of low wind. The few wind-powered desalination facilities which do not have additional energy supply experience significant fluctuations in water production. For reverse osmosis systems fluctuating operational conditions are a particular problem as this places stress on membranes and can cause damage to the system (Garcia-Rodriguez, 2002; Plantikow, 1999). As a result, although reverse osmosis generally needs less electricity, those reverse osmosis deriving energy only from wind turbines would require energy storage. Therefore, mechanical vapor compression desalination, which is much less sensitive to system fluctuations, has been found to be more compatible with wind turbine energy generation.
As desalination systems relying only on wind turbines are either not able to produce at full capacity or require extra storage for periods of low wind, this is a possible reason why, to date, most wind-coupled desalination systems have been of relatively small generation capacities. Still, for wind-powered desalination with conventional energy to compensate for periods of otherwise fluctuation, at sites with high average wind speeds, 5
m/s or nearly Class 4 areas, wind-powered desalination can not only be cost competitive with conventional, fossil fuel, energy sources, but also help to increase desalination sustainability (Kiranoudis, 1997). Therefore, the potential for how much sustainability would increase would mostly be site specific with those sites having both high and consistent wind speeds resulting in either 1) the least dependence on fossil fuels in the case of dual energy source systems or 2) the least required system "over-design" in the case of wind-only powered facilities.
Photovoltaics
Photovoltaics are based upon a p-n semiconductor junction (Peters et al., 2003). In the absence of light, electrons move from the negative material to the positive material, but only in the immediate vicinity of the junction. With the addition of light energy and an electrical contact between the opposite ends of the positive and negative materials, an electric current flows.
Since photovoltaics convert solar energy directly into electrical energy, this technology is best suited for pairing with reverse osmosis or mechanical vapor compression. However, since reverse osmosis generally requires less energy than vapor compression, in practice reverse osmosis has been greatly favored for pairing with photovoltaics. Like wind resources, though, solar resources are also quite variable so these reverse osmosis
systems often include either battery storage of photovoltaic energy or are connected to an alternate energy source such as a generator. Arguably, either case would limit the
potential for process sustainability. As full sun may only be available, on average, for about 6 hours per day in the most suitable locations, either about 75 percent of
desalination energy would still need to come from an alternate energy source, generally from fossil fuels, or significant system over-design with storage would be required. If batteries are to be used as an energy source when solar resources are not available and to provide constant operating conditions over the course of a day, then, for a desalination plant operating at full capacity 24 hr/day, the photovoltaic system would be expected to need to be at least four times larger than required if batteries were not used. Typically lead-acid batteries are used for photovoltaic-desalination systems but have proved to be particularly problematic in that they must be replaced as frequently as every 2 years, particularly in warm climates, and do not reliably have efficiencies greater than 75
percent (Thomson, Miranda, and Infield, 2002; Thomson, 2001). Additionally, there are significant life-cycle problems with lead-acid batteries leading to reduced overall
sustainability benefits from photovoltaics. Conversely, desalination plants having no backup energy source would need to be much larger and would require proportionally more photovoltaic cells. As this plant would be idle during periods of low or no
insolation, the entire required daily water production would need to be possible in at least the equivalent of the duration of the solar day operating at full capacity. There is,
however, some level of increased efficiency and sustainability possible for plants
operating only on direct current photovoltaic energy, particularly through the elimination of costly inverters from the photovoltaic system, which are not achieved when
conventional energy sources are used for additional energy (Mohsen and Jaber, 2001).
Solar Thermal
There are several methods of producing solar thermal energy that have been paired with desalination plants including flat plate collectors, evacuated tube collectors, parabolic troughs, and solar ponds. Flat plate collectors consist of numerous fluid-filled tubes or channels, usually containing a water-antifreeze solution, attached to a metal plate (Peters et al., 2003). The fluid is heated by the sun as it flows through these channels and then circulates out of the plate to transfer its heat for use as energy. Evacuated tube collectors operate similarly except while the channels of the flat plate collector are surrounded by air, and therefore subject to convective cooling and reduced efficiencies, evacuated tube collector channels are contained in a glass tube containing no air and therefore are much more efficient. Parabolic troughs are a type of solar concentrator which focuses
incoming solar radiation into a line by means of a reflective trough. So as to be able to focus solar energy throughout the day, the trough "tracks" the sun as it moves across the sky from east to west. At the focal point of this trough is a fluid-filled tube containing either water or oil which is heated by solar radiation as it flows through the tube. As the tube leaves the trough in the direction of fluid flow, this heat is then available as an energy source in a manner similar to that of the flat plate collector and evacuated tube collector.
A solar pond is somewhat different from the other solar options. It consists of a brine layer at the bed of the pond, the lower convective zone (LCZ) though it could as well be non-convecting, and a thin layer of fresher water at the pond surface, the upper
convective zone (UCZ), with a gradient zone (GZ) between these two layers. (Figure 6) In an ordinary pond without a salt gradient, solar radiation coming into the pond heats up
the water, the less dense warm water convects up to the pond surface, and heat is
released. As a result, the most dense water at the bottom of the pond is relatively cold or at least relatively close to 4C. In a solar pond, however, the LCZ contains the most dense water due to its high salt content. Therefore, solar radiation into a solar pond contributes to heating the LCZ and, due to the density of water in that layer and the GZ, heat cannot convect to the pond surface to be released. Thus, the LCZ accumulates thermal energy which must be drawn off before boiling the water, to prevent loss of the density gradient. This heat can directly be used as an energy source by means of a heat exchanger or can be converted to electricity by means of an organic Rankine cycle engine.
SM~ ~~~T AMT eg;
U" MW
Figure 6 - Salinity-Gradient Solar Pond Schematic (Xe, 1995)
Both flat plate collectors and solar ponds produce relatively low grade, less than 1000C,
thermal energy and are therefore generally considered well suited for supplying direct heat for thermal distillation processes. Due to their ability to store energy, however, solar ponds are also used to produce electricity. Solar ponds are particularly well suited to association with desalination plants as waste brine from desalination can be used as the
salt source for the solar pond density gradient. As desalination generally produces quantities of brine on par with quantities of potable water produced with the brine going to disposal, using desalination brine for solar ponds not only provides a preferable alternative to environmental disposal, but also a convenient and inexpensive source of solar pond salinity.
Flat plate collectors, on the other hand, have not been found as useful a technology for desalination (Garcia-Rodriguez, 2002; Belessiotis and Delyannis, 2001). Although they have been used for relatively small desalinated water production volumes, production of large volumes of water would require an additional energy source, for example, a desalination facility in Mexico derives energy from flat plate collectors and parabolic troughs. For the most part, however, evacuated tube collectors are preferred to flat plate collectors. Although the evacuated tube collectors are more expensive, $300-$550/m2 as opposed to $80-$250/m 2 for flat plate collectors, less of them and less land area would be needed for the same level of energy production. Also, since evacuated tube collectors produce temperatures of up to 200'C, they are particularly suited as an energy source for high temperature distillation (Belessiotis and Delyannis, 1995). Still, among solar thermal technologies, solar ponds and parabolic troughs are the most frequently used for desalination (Van der Bruggen and Vandercasteele, 2002). Due to the high temperatures parabolic troughs are capable of, the high grade thermal energy they produce is generally used for electricity generation (Belessiotis and Delyannis, 1995). Parabolic troughs could be a suitable energy supply for most desalination methods, but in practice, have mainly been used for thermal distillation as these methods can take advantage of both the heat and electricity troughs produce. Other methods of desalination would receive little or no benefit from the heat produced.
The unit cost of these solar thermal energy production methods directly increases with the temperatures they can yield. As such, flat plate collectors and solar ponds are the least expensive of these on a unit basis and parabolic troughs are the most expensive. Where land is inexpensive then, solar ponds are preferred due to their low cost and their
electricity from solar ponds when thermal energy cannot be used. Where land prices are high or electricity or high temperatures are needed, parabolic troughs are generally the preferred source of solar thermal energy. Absolute preferred methods, however, can be expected to be highly site specific.
IV. Case Study of St. John, USVI
Desalination
The US Virgin Islands (USVI) has had a long history of water scarcity. There are no important bodies of fresh water on the islands (Bruno-Vega and Thomas, 1995). And, although the islands receive 1.1 m of rain annually, a large portion of this is lost due to runoff to salt ponds or the ocean as a quarter of it falls during a one to two month long period during the winter rainy season. Additionally, despite the small area of each island, the distribution of rainfall varies greatly depending on the specific location on the island
(Hersh, 2003). The islands also have significantly high evaporation rates (Jarecki, 2003) and aquifers tend to be brackish or non-existent (Baustert, 2003).
In an attempt to meet the water demand of its growing resident and tourist populations, the first USVI desalination plant was constructed on the island of St. Thomas in 1962
(Rothgeb, 2003). However, demand quickly exceeded this additional supply despite the addition of a prohibition of building construction unless a rainwater cistern is also constructed for the new building. Since then, desalination of public water supply has expanded to all three islands, St. Thomas, St. Croix, and St. John, and on average has had to double in capacity every five years through construction of larger and additional plants. In addition, there are approximately 100 private resorts, condominium
complexes, and hotels in the USVI currently operating their own small scale, most less than 80 m3/day, desalination facililties (Chritchley, 2003). Independent desalinated water production has become so wide spread because public water infrastructure does not reach them or public water would be more expensive (Chritchley, 2003; Baustert, 2003; Kling, 2003).
The public water utility provider, the Water and Power Authority (WAPA), currently operates a 600 m3/day-maximum capacity mechanical vapor compression desalination plant on the island of St. John. This plant supplies piped water to the city of Cruz Bay and trucked water as needed to the rest of the island. During the winter months of the
tourist season, demand exceeds the supply capacity of this plant. Therefore, WAPA is also subcontracting a reverse osmosis plant of equal size to meet the remainder of the water demand until construction of a potable water pipeline from St. Thomas is completed in 2004 (Rothgeb, 2003) or until desalination capacity can be permanently expanded on St. John (Chung, 2003). St. Thomas currently has desalination capacity for
16,800 m3/day but demand for 11,000 m3/day or less.
Public desalinated water in the USVI has always been produced by seawater distillation processes. Multiple effect distillation plants are operated on St. Thomas and St. Croix where waste power plant heat is available to provide thermal energy to seawater influent. As St. John has no such thermal resource, a mechanical vapor compression distillation plant is operated there. Multiple effect distillation is widely recognized for its use in not only providing high purity water, but also water in very large quantities (Leitner, 1993). Vapor compression also provides extremely pure water, but is used for relatively small water production needs. The largest vapor compression plants have a maximum capacity of approximately 4,000 m3/day which is 10 percent of the maximum capacity of the largest thermal distillation plants.
When the decision was first made in the 1960's to desalinate seawater for public
distribution in the USVI, reverse osmosis was not a viable option. Reverse osmosis had just been developed, and it would be another three years after construction of the first St. Thomas seawater desalination plant that the first commercial brackish water reverse osmosis plant would be constructed (UCLA, 2003). Only fairly recently has seawater reverse osmosis become economically competitive with distillation though it has still not found application for extremely large volumes of water production. Although the USVI desalination plants are only of moderate size, WAPA has continued to operate distillation facilities. USVI residents have become accustomed to the purity of distilled water
(Chung, 2003). (WAPA distilled water has a salinity of 2 ppm when it leaves the plant, though it increases to approximately 20 ppm salinity before it reaches customers due to the salt content of the air.) And even seasonal residents prefer not to drink reverse osmosis water with its salinity on the order of hundreds of ppm (Kling, 2003). Though it
is likely that seasonal residents would be apt to drink bottled water regardless of tap water quality.
Energy
There is a 2.5 MW diesel power plant in proximity to the St. John desalination facility, but due to the expense of operating it, the entire island power demand of up to 11 MW at average peak times and 15 MW during Carnival (late June/early July) is imported from St. Thomas (Chung, 2003). There are, however, significant issues concerning the reliability of electricity imported from St. Thomas. Outages and surges are fairly
common for St. John, occurring at least every two weeks and sometimes multiple times in one day (Hendrickson, 2003). Although outages are not as damaging to mechanical vapor compression equipment as they are for reverse osmosis, they still sometimes require over an hour to start equipment back up after having been down. All together, the island of St. John experiences approximately 100 hr/year of outages (USDOE, 2001). In
addition, electricity production on St. Thomas is effectively entirely derived from number 2 and 6 fuel oil, although small amounts of liquefied natural gas and coal are used in the USVI. As the USVI has no petroleum resources of its own, the cost of importing fuel makes electricity very expensive. The current cost of electricity production is
$0.09/kWh, excluding distribution losses and administrative costs, with retail rates at approximately $0.14/kWh for large commercial customers and $0.17/kWh for residential customers. Distributed renewable energy would not only move the WAPA desalination facility on St. John toward sustainability, but could also provide the benefit of increased reliability.
Renewable Energy Analysis
In an effort to move St. John desalination towards sustainability and increase the
reliability of energy resources, three renewable energy sources were analyzed. Analysis was made of the potential for solar thermal, photovoltaic, and wind energies to be paired with the existing mechanical vapor compression distillation plant on St. John.
Solar thermal through use of solar ponds has the advantage of being relatively low cost and having inherent energy storage capacity. Photovoltaic and wind energy, on the other hand, have no inherent storage capacity, but are considered particularly well suited to use with mechanical vapor compression as previously discussed. Although some efficiency, 5-10 percent, is lost in converting the direct current electricity produced to alternating current, because it is important to maintain a high percentage of production capacity direct current will not be used. All systems were designed without batteries or any other outside means of storage and by using alternating current, grid-connected systems are possible. It is the intent of each design to not only produce a maximum amount of
electricity, but to produce this electricity when it is needed. As such, designs also attempt to minimize "reverse metering" since it is the sustainable production of desalinated water that is of interest rather than the production of the greatest amount of electricity.
Plant data indicate that in the time from July 1998 to December 2002, WAPA's fuel costs increased from $15.56/bbl and $15.37/bbl for numbers 6 and 2 fuel oil respectively to $29.52/bbl and $29.18/bbl. Therefore benefits are based on a cost of $0.09/kWh to produce electricity and an assumption that about half the rate of fuel oil cost increase is not unreasonable to expect in the future. Costs assume 3 percent inflation, and present value analysis is based on WAPA's current loan rate of 5.25 percent (Rothgeb, 2003). Analysis is based upon water production data for the year 2002 (Chung, 2003). (Table 5) Due to errors in data collection equipment, production data reflects the combined
production of distilled and reverse osmosis water. Water production exceeding vapor compression capacity of 600 m3/day is not considered in the analysis (IDE, 1992?). Since electricity use for both facilities is also combined, the rated capacity for the vapor compression plant of 300 kW is used as the power requirement when operating at full capacity. In addition, although $3/watt rebates, up to $12,000, for installing renewable energy were at one time available from the Virgin Islands Energy Office, no rebates were considered in this analysis as rebates are no longer being offered (Smith, 2003).
Table 5 - 2002 St. John Public Water Production Month Water Production (m3)
January 17000 February 1800 March 13200 April 6700 May 14300 June 22400 Jly 218 00 August 18100 September 13600 October 13100 Notember 14900 ember 18000 Total1 191200
Solar Pond Design Considerations
Literature recommends that a solar pond be designed for average annual insolation (Tabor, 1975). Average values are used so as to avoid system over-design in the summer if the design were for minimum winter insolation values. Over-design would require more electricity to be produced than is used in desalination and therefore reverse metering. Detailed calculations can be found in Appendix A.
The temperature difference between the UCZ and the LCZ is designed to be
approximately 400C. The UCZ will consist of seawater which, around St. John, has a seasonal temperature variation from 25'C to 30'C (IDE, 1992?) and it is assumed the LCZ can be held constant at 40'C above the UCZ by heat extraction once it gets to the desired temperature. Although it is possible for solar ponds to achieve near-boiling LCZ temperatures, a lower LCZ for St. John is proposed for two reasons. First, if keeping all other parameters constant, increasing the LCZ temperature would also increase the temperature gradient between the LCZ and the UCZ. As a result, flux of thermal energy out of the LCZ would increase and cause decreased efficiency in the pond's ability to store energy. Second, there is not an existing nearby brine source which would be able to maintain the required solar pond density gradient if the LCZ were at such high temperatures. The density of water increases with increasing salinity (Figure 7) and decreases with increasing temperature (Figure 8) (El-Dessouky and Ettouney, 1999?).
1.10-1.08 -1.06 -0
z~1.04- S1.021.00 -0.98 0 50000 100000 150000 Salinity (ppm)Figure 7 - Density vs. Seawater Salinity at 25*C
1.035 1.030 1.025 - 1.020-1.015 1.010 - 1.005- 0.995-0.990 - -.-0.985 0 20 40 60 80 100 Temperature (*C)
Figure 8 - Seawater Density vs. Temperature at 35000 ppm Salinity
Surface seawater density meter measurements taken at the desalination plant intake in January 2003 indicated a density of 1.022 g/ml at 28.8'C, or approximately 3.5 percent salinity. Temperature at the intake was 27.3'C. The slightly lower temperature could be attributed to depth of the intake although the density change associated with this
difference in temperature was within the error of the density meter, ± 0.001 g/ml.
Potential sources of brine include St. John's vapor compression concentrate, concentrate from St. John's temporary public reverse osmosis facility, and a salt pond adjacent to the vapor compression plant. (This latter source might not be available as its use would
depend largely upon the political sentiment of nearby residents.) The St. John vapor compression plant achieves a recovery rate of almost 50 percent; i.e., approximately half the desalination feedwater becomes potable water (average salinity 2 ppm) so the brine is nearly twice as salty as seawater. St. John vapor compression brine achieves a salinity of approximately 6.6 percent which would correlate with a density of 1.026 g/ml 70'C (El-Dessouky and Ettouney, 1999?). Likewise, according to the reverse osmosis operator,
the reverse osmosis facility is capable of a 2/3 recovery ratio. Due to repair problems with the reverse osmosis system, significantly less than this ratio was actually measured, 1.031 g/ml at 29.4'C. However, ideally the system produces potable water with
approximately 350 ppm salinity and brine with a salinity of 10.5 percent. This would result in a density of 1.055 g/ml at 70'C. Finally, the salt pond adjacent to the
desalination plant was found to have a natural salinity of 7.5 percent in January 2003. If this were used as a salt source, the removed water could be replaced with desalination brine. Provided the salinity of this salt pond remains constant over time, a density of 1.029 g/ml would result at 70'C. It may be possible to provide additional salt resources from a former seasalt production area in the southeast of St. John. Gross evaporation rates for saline water in the Virgin Islands range from 32 to 45 m3/day per hectare making salt production practical (Jarecki, 2003). With an average precipitation rate of 1.1 m/yr, this results in a net precipitation rate of 0.3 m/yr on average, though this amount varies seasonally and geographically. Transporting salt produced in this fashion to the vapor compression plant, however, is expected to be impractical except perhaps in crystalline form.
Solar Pond Results
An analysis of the potential for use of solar pond technology found that, economically, this is a fairly beneficial project (Table 6). As the local utility is hesitant about using unproven technologies, another benefit of this project is that it is commercially well established, however, not in the US. Although, solar ponds are not common in the US, they have been used widely in Israel for over 40 years. The greatest solar pond
advantages, however, are storage capacity and reliability for consistent energy output. This is particularly important as the desalination facility operates 24 hr/day. Since
literature recommends that solar ponds be designed to meet average annual energy requirements, although average energy needs can be met by a solar pond, additional energy will be needed from grid-supplied energy. The pond would be able to sustain the desalination process during power outages regardless of when an outage occurred, though. A disadvantage of a solar pond, however, is that solar energy is an extremely diffuse resource. Therefore, approximately 79,000m2 of land would be required for the
73,600 m2 solar pond to meet a design capacity of 254 kW. Futhermore, approximately 12 months is expected to fill the pond and establish a high enough LCZ temperature for energy use. As a result, no cost savings is expected for over a year after project initiation.
Table 6 - Solar Pond Benefit-Cost Analysis
Maintenance and Total Annual Electricity Year Capital Costs Repair Costs Cost Cost Savings
0 -$2,002,901 -$2,002,901 1 -$10,000 -$10,000 $0 2 -$10,300 -$10,300 $161,301 3 -$10,609 -$10,609 $231,198 4 -$10,927 -$10,927 $248,538 5 -$11,255 -$11,255 $267,178 6 -$11,593 -$11,593 $287,217 7 -$11,941 -$11,941 $308,758 8 -$12,299 -$12,299 $331,915 9-$12,668 -$12,668 $356,808 10 -$13,048 -$13,048 $383,569 11 -$13,439 -$13,439 $412,337 Present Value of Benefits $2,090,761.76 Present Value of Costs ($1,992,332.11) Benefit/Cost Ratio 1.05
Photovoltaic Design Considerations
The tilt of a solar panel array indicates the angle of the panel either in relation to
horizontal or to the latitude of the site. A panel tilt of 18' from horizontal would be the same as a site located at a latitude of 18'N having an at latitude tilt. As an at-latitude tilt
generally maximizes annual electricity production while specific latitude will vary with site location, panel tilt is generally referenced from latitude. In choosing a tilt for the proposed photovoltaic panels, the main consideration was the prevention of reverse metering. Energy output varies during the year according to Figure 8 depending on panel tilt in relation to the degree latitude of the site. As insolation during the summer months often exceeds the standard 1000 W/m2 panel rating, it was determined that a -15' tilt, which would maximize summer insolation, would be inappropriate. Furthermore, due to significantly low demand during spring and autumn months, it was also determined that electricity supply during those months would consistently exceed demand with an at latitude tilt. The recommended tilt, then, is the winter-favorable tilt of +150. This recommendation, however, assumes that the desalination plant desires to operate 24 hr/day all year. If spring and autumn water production were centered around the daylight hours, an at latitude tilt would increase in favorability. Detailed calculations can be found in Appendix B.
o 99
06 058
IM? Mfl MAR AMR MAY U AUG WE OCT NMS WEM Figure 9 - Photovoltaic Output Over Time by Panel Tilt
(Noureddine, 1996)
Photovoltaic Results
The proposed photovoltaic array is rated at 320 kW which is equal to the power rating of the desalination plant of 300 kW after accounting for inefficiencies of inverter conversion
from direct to alternating current. As inverter efficiency is effectively constant at all but the lowest insolation levels, a constant efficiency of about 94 percent is considered (Figure 10). By assuming constant demand throughout each month, even at a +150 tilt, the majority of excess electricity production occurs during the spring and autumn
centering around March/April and October. The calculated percentage of excess supply, however, is less than 2 percent of annual demand based on year 2000 hourly insolation data collected at the Water Resources Research Institute weather station on St. Thomas.
As seen in Table 7, supplying power to St. John desalination by photovoltaics is not financially beneficial. The main reason for this is that photovoltaics exhibit minimal economies of scale. Where rebates are available, though, small photovoltaic systems (since rebate programs tend to have a ceiling payment) are particularly beneficial in areas of high insolation. Although St. John does have significant insolation, the project is not economically feasible until electricity is nearly $0.13/kWh. By comparison, retail rates for electricity are approximately $0.14/kWh for hotels and $0.17/kWh for residential customers (Rothgeb, 2003). Therefore, if water and power generation were two separate entities with electricity being purchased at commercial rates, a photovoltaic project would be economically feasible. 450 400 350 300 250 200 150 100 7
,--- ,
.- . . . I . . I . I 8 9 10 11 12 13 14 15Hour of the Day
16 95 -90 85 -80 75 70 17 18 U C 0) E 0) 0) t 0) C
Figure 10 - Photovoltaic Inverter Power and Efficiency Correlation (Bahaj and James, 2003)
-w- Inverter 1 efficiency
--- DC Power Inverter 1 -A- AC Power Inverter 1
-
0-Furthermore, photovoltaic panels are not environmentally a preferable option. Since no batteries were factored into the design due to their own environmental impact and
maintenance concerns, approximately 2/3 of desalination energy must still be supplied by the grid due to the need for the St. John desalination facility to operate 24 hr/day. Since panel inefficiencies due to high temperature were not considered in the design, this 2/3 result is expected to be even somewhat more favorable to the photovoltaic project than would actually exist.
Table 7 - Photovoltaic Benefit-Cost Analysis
Maintenance and Total Annual Electricity Year Capital Costs Repair Costs Cost Cost Savings
0 -$1,649,429 -$1,649,429 1 -$1,000 -$1,00 $50,026 2 -$1,030 -$1,030 $53,777 3 -101-101$57,811 4 -$1,093 -$1,093 $62,147 5 -$1,126 -$1,126 $66,808 6 -$1,159 -$1,159 $71,818 7 -$1,194 -$1,194 $77,205 8 -$1,230 -$1,230 $82,995 9 -$1,267 -$1,267 $89,219 10 -$236,540 -$1,305 -$237,844 $95,911 11 -$1,344 -$1,344 $103,104 12 -$1,384 -$1,384 $110,837 13 -$1,426 -$1,426 $119,150 14-$1,469 -$1,469 $128,086 1.5 -$1,513 -$1,51 3 -."$..1_3 ,7,693 16 -$1,558 -$1,558 $148,019 17 -$1,605 -$1,605 $159,121 18 -$1,653 -$1,653 $171,055 19 -$1,702 -$1,702 $183,884 20 -$1,754 -$1,754 $197,675 Present Value of Benefits $1,170,836 Present Value of Costs ($1,716,701) Benefit/Cost Ratio 0.68