HAL Id: hal-00296147
https://hal.archives-ouvertes.fr/hal-00296147
Submitted on 14 Feb 2007
HAL is a multi-disciplinary open access
archive for the deposit and dissemination of
sci-entific research documents, whether they are
pub-lished or not. The documents may come from
teaching and research institutions in France or
abroad, or from public or private research centers.
L’archive ouverte pluridisciplinaire HAL, est
destinée au dépôt et à la diffusion de documents
scientifiques de niveau recherche, publiés ou non,
émanant des établissements d’enseignement et de
recherche français ou étrangers, des laboratoires
publics ou privés.
horizontally in the Tropical Tropopause Layer of the
western Pacific
F. Hasebe, M. Fujiwara, N. Nishi, M. Shiotani, H. Vömel, S. Oltmans, H.
Takashima, S. Saraspriya, N. Komala, Y. Inai
To cite this version:
F. Hasebe, M. Fujiwara, N. Nishi, M. Shiotani, H. Vömel, et al.. In situ observations of dehydrated air
parcels advected horizontally in the Tropical Tropopause Layer of the western Pacific. Atmospheric
Chemistry and Physics, European Geosciences Union, 2007, 7 (3), pp.803-813. �hal-00296147�
www.atmos-chem-phys.net/7/803/2007/ © Author(s) 2007. This work is licensed under a Creative Commons License.
Chemistry
and Physics
In situ observations of dehydrated air parcels advected horizontally
in the Tropical Tropopause Layer of the western Pacific
F. Hasebe1, M. Fujiwara1, N. Nishi2, M. Shiotani3, H. V¨omel4, S. Oltmans5, H. Takashima3, S. Saraspriya6, N. Komala6, and Y. Inai7
1Faculty of Environmental Earth Science, Hokkaido University, Sapporo, Japan 2Geophysical Institute, Kyoto University, Kyoto, Japan
3Research Institute for Sustainable Humanosphere, Kyoto University, Uji, Japan 4CRES, University of Colorado, Boulder, CO, USA
5Climate Monitoring and Diagnostics Laboratory, NOAA, Boulder, CO, USA 6Lembaga Penerbangan dan Antariksa Nasional, Bandung, Indonesia
7Graduate School of Environmental Science, Hokkaido University, Sapporo, Japan
Abstract. Water vapor observations by chilled-mirror
hy-grometers were conducted at Bandung, Indonesia (6.90◦S, 107.60◦E) and Tarawa, Kiribati (1.35◦N, 172.91◦E) in
De-cember 2003 to examine the efficiency of dehydration during horizontal advection in the tropical tropopause layer (TTL). Trajectory analyses based on bundles of isentropic trajecto-ries suggest that the modification of air parcels’ identity due to irreversible mixing by the branching-out and merging-in of nearby trajectories is found to be an important factor, in addi-tion to the routes air parcels follow, for interpreting the water vapor concentrations observed by chilled-mirror frostpoint hygrometers in the TTL. Clear correspondence between the observed water vapor concentration and the estimated tem-perature history of air parcels is found showing that drier air parcels were exposed to lower temperatures than were more humid ones during advection. Although the number of ob-servations is quite limited, the water content in the observed air parcels on many occasions was more than that expected from the minimum saturation mixing ratio during horizontal advection prior to sonde observations.
1 Introduction
Water plays a crucial role on the earth’s radiation budget through cloud formation and greenhouse effect. Although its direct anthropogenic production is negligible, globally aver-aged evaporation from the surface is projected to increase in response to global warming (Houghton et al., 2001), lead-ing to an increase in the tropospheric water vapor concen-tration. In the lower stratosphere, there is a cooling trend (Randel and Cobb, 1994; Ramaswamy et al., 2001) as a con-sequence of the decrease in the ozone concentrations
(Ra-Correspondence to: F. Hasebe
(f-hasebe@ees.hokudai.ac.jp)
maswamy et al., 1996; Hare et al., 2004) and possibly the in-crease in stratospheric water vapor (Forster and Shine, 1999, 2002). The water vapor increase estimated from NOAA Frostpoint Hygrometer (FPH) data amounts to about 1 % per year from the early 1980’s to around 2000 (Oltmans and Hof-mann, 1995), which, together with that derived from satel-lite data in the 1990’s (Evans et al., 1998), is much greater than that estimated from the observed rise of methane con-centration through its oxidation (Kley et al., 2000). The stratospheric temperature decrease could cause a delay in the expected ozone recovery due to the ban of chlorofluo-rocarbons (Shindell et al., 1998). Since water takes part in the ozone chemistry through the formation of hydroxyl rad-ical and polar stratospheric clouds, the anthropogenic ozone loss will be enhanced if stratospheric concentration increases (Dvortsov and Solomon, 2001; Stenke and Grewe, 2005). Modification of stratospheric temperatures could lead to a modulation of transport properties which could further in-fluence the stratospheric ozone and water vapor distributions on a global scale. Little is known about the complex feed-back processes in the radiation-dynamics-chemistry of the troposphere-stratosphere system.
A basic understanding of water vapor in the stratosphere starts with the idea that it must reflect the temperature history the air experienced before entering the stratosphere. This, together with the global distribution of atmospheric ozone, lead to the description of the general circulation in the strato-sphere in which air must enter the stratostrato-sphere through the cold tropical tropopause and descend in high latitudes of both hemispheres (Brewer, 1949). Newell and Gould-Stewart (1981) proposed the “stratospheric fountain” hypothesis in which the entry of tropospheric air must be restricted to the tropical western Pacific during boreal winter and the Bay of Bengal in summer. This hypothesis was generally accepted until Sherwood (2000) indicated that the vertical motion near the tropopause over the western Pacific is downward. This
finding was supported in numerical simulations (Gettelman et al., 2000; Hatsushika and Yamazaki, 2001).
Big conceptual changes took place in the 1990’s. The up-ward motion in the tropical lower stratosphere was found to be driven by extratropical wave drag (Haynes et al., 1991; Holton et al., 1995; Plumb and Eluszkiewicz, 1999). Ev-idence of dehydration associated with passage through the tropical tropopause has been shown to be imprinted as an “atmospheric tape recorder” in the vertical profile of wa-ter vapor mixing ratio (Mote et al., 1996). Highwood and Hoskins (1998) shed light on the idea of the tropical tran-sition layer (or tropical tropopause layer; TTL) introduced by Atticks and Robinson (1983). The tropical tropopause is now no longer a clearly defined boundary between the tropo-sphere and the stratotropo-sphere but instead should be treated as a transition layer extending from around 200 hPa to 80 hPa levels. This layer is located above the reach of tropospheric deep convection but below the tight control of the extratrop-ical suction pump, thus dividing the two major dynamextratrop-ical processes that could affect the tropical tropopause.
The introduction of the TTL prompted a novel idea on the dehydration processes in the tropical tropopause region. Holton and Gettelman (2001) proposed a new mechanism of dehydration by using a simple mechanistic model, in which the air parcels are dehydrated during the horizontal advec-tion through the “cold trap” region in the western tropical Pacific. This hypothesis exhibits a strong contrast to ear-lier views in which the cooling due to vertical motion plays an essential role in dehydration. This hypothesis was fur-ther examined by using a trajectory model (Gettelman et al., 2002), GCM simulations (Hatsushika and Yamazaki, 2003), and satellite water vapor data (Randel et al., 2001). It is now becoming widely accepted as a key dehydration process for tropospheric air entering the stratosphere.
It should be worth mentioning, however, that the TTL is not a calm region but it is full of disturbances generated by atmospheric waves (Tsuda et al., 1994; Fujiwara et al., 1998). These waves are shown to work as a “dehydration pump” that introduces dry stratospheric air into the uppermost sphere on the one hand and blocks the entry of humid tropo-spheric air into the stratosphere on the other due to adiabatic temperature change associated with the vertical displacement (Hasebe et al., 2000; Fujiwara et al., 2001). In case of wave breaking, irreversible mixing in the upper troposphere leaves it under the influence of ozone rich/dry stratospheric air. The variabilities with the intraseasonal oscillation (ISO) could also affect the dehydration efficiency of the TTL. Eguchi and Shiotani (2004) have shown that the “cold trap” dehy-dration does not occur continuously but rather takes place intermittently in an organized system that takes the form of the combined Kelvin- and Rossby-wave response to the ther-mal forcing. It is thus strongly controlled by the life cycle and the passage of the ISO. TTL is also subject to hydration due to the northern summer subtropical monsoon. There is evidence that the transport across the subtropical tropopause
is strongly influenced by the upper-level anticyclones associ-ated with the monsoons (Chen, 1995; Postel and Hitchman, 1999; Dethof et al., 1999, 2000). As the monsoon anticy-clones extend up into the stratosphere, they could also con-tribute to tropical-extratropical exchange in the lower strato-sphere (Horinouchi et al., 2000; Gettelman et al., 2004b).
We are now aware that a large variety of processes that are mutually dependent upon each other through complicated feedbacks are responsible for determining the climatology and the variability of stratospheric water vapor. The tropi-cal tropopause temperature that could regulate the entry of tropospheric water vapor into the stratosphere is reported to have a cooling trend (Zhou et al., 2001; Seidel et al., 2001), indicating the opposite sign for what might be expected for a water vapor increase in the stratosphere. It has been reported, however, that the water vapor trend is not so evident as antic-ipated previously if viewed from satellite and that there was a sudden drop in the stratospheric water concentration in the year 2001 (Randel et al., 2004, 2006). They also emphasized that the water vapor variations are consistent with the TTL temperature changes on a year-to-year basis. Fueglistaler and Haynes (2005) estimated the interannual variations of stratospheric water vapor by employing numbers of trajec-tory calculations and suggested that the stratospheric water vapor increase estimated from FPHs could be an overesti-mate. In view of the great importance of water vapor in our climate system, however, much effort is required in trying to obtain a detailed description of stratospheric water vapor and in understanding the mechanisms of how it is controlled by examining the physical, chemical and radiative processes in the atmosphere.
The Lagrangian temperature history along trajectories has been a convenient measure for studying the dehydration of air parcels entering the stratosphere (e.g. Jackson et al., 2001; Jensen and Pfister, 2004; Fueglistaler et al., 2004, 2005; Fueglistaler and Haynes, 2005). However, there is little in situ water vapor data in the TTL over the western tropical Pacific to check the effectiveness of such calculations. In this paper, first results of the water vapor sonde observa-tions by chilled-mirror hygrometers in the western tropical Pacific, conducted as part of the Soundings of Ozone and Water in the Equatorial Region (SOWER) project in Decem-ber 2003, are presented along with isentropic trajectory cal-culations (Sect. 3). Problems in characterizing air parcels with the use of trajectories are investigated prior to it by ex-amining typical examples (Sect. 2) intending to provide the framework for interpreting the water vapor sonde data. The efficiency of dehydration is discussed by comparing the ob-served water vapor mixing ratio with the saturation mixing ratio of the corresponding air mass estimated from trajectory calculations (Sect. 4).
2 Lagrangian Characterization of Air Parcels
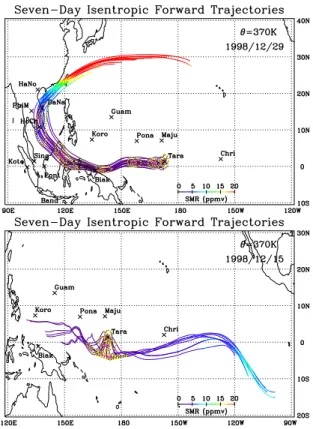
In order to interpret the observed water vapor concentration by radiosondes in terms of dehydration along their excursion in the TTL, trajectory calculations provide useful informa-tion on the origin and the water vapor content of air parcels. In addition to the routes air parcels follow, it is also impor-tant to consider whether the air parcel retains its identity or is modified due to irreversible mixing along the trajectories. A method that could help investigate such processes is the one that deals with a bundle of trajectories being started si-multaneously from multiple points surrounding the point of interest. Figure 1 shows two examples in which the air par-cel is advected along the trajectories with its identity retained (top) and modified (bottom). In these calculations, four data points, each of which is distributed either 0.5◦of longitude
or 0.5◦of latitude displaced from Tarawa, Kiribati (1.35◦N,
172.91◦E) are considered. The region shown by connecting these 4 points with purple lines has a horizontal extent of about 100 km and is hereafter referred to as the core of an air parcel. Additional 4 points connected by yellow-black dotted lines surrounding the core, distributed 1.0◦longitude/latitude apart from Tarawa, define the vicinity of the air parcel with a horizontal extent of about 200 km. This will include the max-imum range of the radiosonde drift along a single flight. The outermost boundary is defined by 8 points either 2.0◦of lon-gitude/latitude separated from Tarawa or both 1.4◦longitude and latitude distant from Tarawa, and represents a region of about 400 km of horizontal scale. This will correspond to the horizontal resolution of limb-viewing satellite instruments. The bundle of 16 forward trajectories thus defined are calcu-lated on the 370 K isentropic surface based on the European Centre for Medium-Range Weather Forecasts (ECMWF) op-erational analysis of 2.5◦latitude-longitude grid spacing and 15 standard pressure levels with 12-hour time interval. The trajectories are color-coded by the saturation mixing ratio (SMR) of water vapor estimated from the air temperature along the trajectories; cold (warm) colors correspond to low (high) temperature and low (high) SMR. The location and the shape of the air parcel are expressed by connecting the data points with a time interval of 24 h. The data points that define an air parcel initialized on 00 UT on December 29, 1998 over Tarawa (Fig. 1 top) are advected more or less in parallel to the west for about 4 days. After the fifth day, however, when they encounter the subtropical jet, the core is elongated due to strong horizontal shear so that its identification is termi-nated for the sake of visibility. During its movement to the west along the equator the SMR takes the value near 2 ppmv so that effective dehydration is expected to occur.
Another example shown at the bottom of Fig. 1 is the case in which the treatment of a single air parcel will be unaccept-able. This illustrates a bundle of trajectories that are initial-ized at 00 UT on 15 December 1998 over Tarawa. The air parcel suffers from east-west elongation while it is advected to the south for 2 days, and then the distortion reaches such
Fig. 1. Isentropic forward trajectories (370 K) initialized at 16 points surrounding Tarawa at 00 UT on December 29 (top) and 15 (bottom), 1998. The advective motion of the air parcel is visual-ized by identifying the location of its core (purple square) together with its vicinity (yellow-black dotted circles) for each interval of 24 hours. See text for more explanation.
an extent that its core is hardly regarded as a single region. That is, the purple-colored core region breaks up as the data points migrate away to reach thousands of kilometers of sep-aration from each other. For visual clarity, the identification of the core is omitted after two days since initialization in this case. This kind of circulation field must involve a horizon-tal divergence in the region where the air parcel is advected. In such cases, the location of divergence is often different among altitudes, which results in a huge scatter in the tra-jectories depending on the layers being considered. Thus the vertical wind structure also plays an essential role in deter-mining the fate of air parcels.
The characteristic features of a bundle of trajectories will thus help to estimate possible dehydration and irreversible mixing that have taken place for advecting air parcels. In the following section, in situ water vapor data given by chilled-mirror hygrometers are examined with the use of back-ward (rather than forback-ward) trajectories corresponding to each sounding to see the level of coldness the observed air parcels have been exposed. All trajectory calculations are made on isentropes since the use of vertical wind has caused relatively
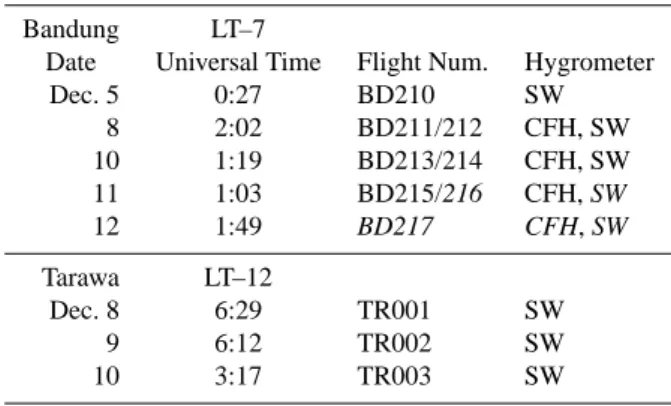
Table 1. Summary of water vapor soundings during the December
2003 SOWER campaign. Data from the hygrometers/flight num-bers shown in italicare not used due to instrumental problems.
Bandung LT–7
Date Universal Time Flight Num. Hygrometer
Dec. 5 0:27 BD210 SW 8 2:02 BD211/212 CFH, SW 10 1:19 BD213/214 CFH, SW 11 1:03 BD215/216 CFH, SW 12 1:49 BD217 CFH, SW Tarawa LT–12 Dec. 8 6:29 TR001 SW 9 6:12 TR002 SW 10 3:17 TR003 SW
large scatter among trajectories and has shown strong depen-dency on the choice of analysis field.
3 Analysis of the Water Vapor Sonde Data
In order to capture the air parcels being dehydrated during horizontal advection in the TTL, a series of radio sound-ings using chilled-mirror hygrometers were conducted at Bandung, Indonesia (6.90◦S, 107.60◦E) and Tarawa, Kiri-bati in December 2003 as a part of the SOWER project. SOWER has been using the NOAA/CMDL frostpoint hy-grometer (FPH) between 1998 and 2002 (V¨omel et al., 2002) and the University of Colorado Cryogenic Frostpoint Hy-grometer (CFH) since 2003 (V¨omel et al., 2007). It has also been flying the Snow White (SW) hygrometers (Fujiwara et al., 2003) since the year 2000, and has flown nearly 100 sondes. It is not a cryogenic frostpoint hygrometer such as NOAA’s, but it utilizes a peltier-based thermoelectric circuit to make a frost on the mirror. Its advantage is that it works without the use of a liquid cryogen so that the preparation and operation for soundings are much easier than FPHs. It also helps to reduce the observational cost remarkably. The appli-cability of SW to the TTL water vapor observations has been studied by Fujiwara et al. (2003) and V¨omel et al. (2003). Although it has a clear limitation in that the cooling effi-ciency is not high enough for stratospheric measurements, it will operate accurately down to the frost points at –75 to –80◦C, that is, up to the middle TTL. In the December
2003 SOWER campaign, some SWs were launched simulta-neously with CFHs to reduce observational uncertainties by collecting mutually independent water vapor data (Table 1). The launches in Bandung were scheduled in the morning to avoid possible shower, while in Tarawa they were conducted in the evening in order not to interfere with the routine mete-orological service. Although the diurnal variation could pos-sibly bring about systematic difference in the tropospheric
features between the two stations, the TTL will be mostly free from tropospheric diurnal cycle as it is located above the altitude of main convective outflow. Possible effect of tides is also ignored.
Before presenting the sounding data, it is useful to take a look at the background meteorological condition during the campaign. Figure 2 shows the longitude-time sections of temperature (top) and zonal wind (second from top) on 100 hPa over the equator (area-weighted mean within ± 6.25◦latitudes) obtained from the ECMWF operational anal-ysis for the month of December 2003. The crosses on the diagram mark the longitude and time corresponding to the sonde observations. The lower two panels are the same as the top except that the monthly mean values are subtracted for each longitude. We could see that the eastward propagating disturbances with simultaneous temperature minimum/zero zonal wind (dashed lines on the lower panels) are superposed on the stationary wavenumber 1 structure with easterly wind maximum around 120◦E (upper panels). The sonde obser-vations in Bandung (the crosses on the left hand side) took place during the passage of this disturbance; the first sound-ing on 5 December may correspond to the westerly maxi-mum (little temperature deviation) while the last one on De-cember 12 may have taken place in the easterly maximum (little temperature deviation) after experiencing the tempera-ture minimum in-between. Those in Tarawa (three marks on the right) took place appreciably earlier than the passage of this disturbance.
The time-height sections of several meteorological quan-tities as obtained from the ECMWF analysis are shown in Fig. 3, by interpolating the gridpoint values to the location at Bandung. The solid lines in the vertical direction indicate the time of sonde launches. The downward phase propaga-tion such as that shown in purple dashed lines, mutual phase relationship between temperature (left hand diagram in the lower row) and zonal wind (lower middle), and the lack of perturbations in the meridional wind component suggest that this disturbance is brought about by Kelvin wave. The TTL during the period from 8 to 11 December is experiencing the coldest phase of this event. On the other hand, no appreciable disturbances are observed over Tarawa (not shown).
According to the hypothesis of the dehydration pump by Kelvin waves (Fujiwara et al., 2001), the water vapor in the TTL during the campaign period will be saturated so that the intrusion of tropospheric moist air is inhibited by the closed “valve” shut off by Kelvin waves. Figure 4 shows the vertical distributions of the water vapor mixing ratio (thick lines) given by CFH (solid) and SW (dashed), the SMR (thin lines), the ozone mixing ratios (dotted lines), and the potential temperature (dash-dot lines) observed at Bandung (top) and Tarawa (bottom). The water mixing ratio and the SMR are estimated from saturation water pressure esat
Fig. 2. Longitude-time sections of temperature and zonal wind (upper two panels) on 100 hPa over the equator (area-weighted mean within
±6.25◦latitudes) being obtained from the ECMWF operational analysis for the month of December 2003. The lower two panels are the same as the top two except that the monthly mean values are removed for each longitude. The crosses in white mark the longitude and time of the radiosonde observations. The dashed purple lines on the lower panels show approximate phase propagation of temperature minimum and zero zonal wind associated with the Kelvin wave.
respectively, by using Goff-Gratch equation:
log10esat= −7.90298(Ts/T −1) + 5.02808 log10(Ts/T )
−1.3816 × 10⁻⁷(1011.344(1−T /Ts)−1) +8.1328 × 10⁻³(10−3.49149(Ts/T −1)−1)
+log10ews for liquid surface, (1)
log10esat= −9.09718(T0/T −1) − 3.56654 log10(T0/T )
+0.876793(1 − T /T0) +log10eio
for ice surface, (2) where T is absolute temperature, Ts=373.16 K, T0=273.16
K, ews=1013.246 hPa, and eio=6.10714 hPa (Goff and
Fig. 3. Time-height sections of relative humidity (%), zonal and meridional wind (m s−1) (upper row from left to right), temperature (K) and zonal wind (m s−1) anomalies, and vertical wind (Pa s−1) (lower row from left to right) for December 2003 interpolated to Bandung from gridpoint values of ECMWF analysis. Relative humidity above 100 hPa is omitted. The dashed purple lines on the lower panels show approximate location of the cold phase of Kelvin wave. Vertical lines in white mark the time of the radiosonde observations.
(2005) for a review. The water mixing ratios are estimated from smoothed frostpoint temperature profile to reduce in-strumental noise and are shown only below 80 hPa pressure level as the data above it are not reliable. The SW data above the pressure level that reached the frostpoint temper-ature below –80◦C are also omitted. For the data at Ban-dung, those on December 5 (BD210) and 12 (BD217) are ex-cluded because the CFH data are not available for the former and some instrumental problem is recognized for the latter. The CFH data above 110 hPa on December 8 (BD211) and the SW data on December 11 (BD216) are also omitted due to an instrumental problem. Although the water vapor data are rather noisy and some discrepancy between the CFH and the SW values is noticeable, we can see that the thick solid and dashed lines (observed water mixing ratio; OMR) almost overlap with thin solid lines (SMR) indicating that the upper troposphere above 150 hPa in Bandung is almost saturated. This is consistent with the expectation from the Kelvin wave effect mentioned above, though other factors may also con-tribute. In Tarawa, on the other hand, the OMR was often less than SMR in the TTL. The stepwise increase of ozone mix-ing ratio and potential temperature above 130 hPa in days 9 and 10 reminds us a possible role of small scale waves on the vertical transport of stratospheric ozone rich/dry air into the TTL (Hasebe et al., 2000). The lack of reliable water vapor data up into the lower stratosphere, however, makes it hard
to further explore the drying mechanism.
Diabatic heating is generally small in the TTL (Gettelman et al., 2004a), although the heating rate strongly depends on the cirrus formation and the existence of underlying convec-tive clouds (Hartmann et al., 2001). Therefore the day-to-day fluctuations of water vapor and ozone mixing ratios are better examined by changing the vertical scale to the potential tem-perature. In this framework, any variability due to adiabatic vertical motion such as that brought about by Kelvin and small scale waves will disappear during the one-week cam-paign period in which the diabatic heating could be mostly neglected. Figure 5 shows the vertical distributions of tem-perature (left), ozone (center) and water vapor mixing ratios (right) given by CFH (solid lines) and SW (dashed). Top pan-els show the profiles taken at Bandung while those on the bot-tom are from Tarawa. Some trimming (as in Fig. 4) of water vapor data are applied due to instrumental limitations. The vertical distribution of temperature shows a specific structure exhibiting curvature changes at around the 345 K and 355 K isentropes. The atmospheric region between these isentropes corresponds to the lower TTL. The water vapor mixing ratio shows a rapid decrease with respect to height in this region. The profiles between 350 and 360 K isentropes in Bandung are in two groups; the one having higher water vapor val-ues in the earlier days of the campaign (December 5 (black) and 8 (red)) and the other with lower values during the later
Fig. 4. Vertical distributions of water vapor mixing ratio (heavy lines) observed by CFH (solid) and SW (dashed) hygrometers, satu-ration mixing ratio (SMR) estimated from temperature (thin lines), ozone mixing ratio scaled by a factor of 2 (dotted lines), and po-tential temperature (dash-dot lines) at Bandung (top) and Tarawa (bottom) in December 2003. Note that two SMR profiles appear on the diagram for Bandung due to the dual launch of radiosondes. The asterisks are the SMRs given from ECMWF temperature field interpolated to the corresponding station.
days (December 10 (green) and 11 (blue)). This grouping does not apply, however, for the ozone mixing ratio; the pro-file for December 5 shows a decrease with respect to alti-tude while the others are almost constant in this height range with the values for December 8 a little higher. In Tarawa, the water vapor mixing ratio on December 10 is generally higher than the others below 360 K. These two profiles lie between the two groups in Bandung. The ozone profiles over Tarawa remain almost the same for three days. The dry layer between the 350 and 355 K isentropes observed during the later period of the Bandung observations could be brought about by the dehydration that took place during horizontal advection before arriving at Bandung. To examine if such differences could be interpreted by the level of coldness the air parcels have experienced during horizontal advection, the backward trajectories corresponding to the sonde observa-tions provide useful information. A brief examination on the accuracy of meteorological field is made as shown in Fig. 4, in which the SMRs given from the ECMWF temperatures interpolated to the corresponding station (asterisks) are com-pared against those observed by chilled-mirror hygrometers. The agreement is good on 150 and 100 hPa except when the wavy structure due probably to small scale waves modifies the profile. Some examples of isentropic backward trajecto-ries corresponding to sonde observations are shown on 355 K surface in Fig. 6 for Bandung (left) and Tarawa (right). The trajectories for Bandung can be regarded as the case in which
Fig. 5. Vertical distributions of temperature (left), ozone mix-ing ratio (center), and water vapor mixmix-ing ratio (right) obtained by chilled-mirror hygrometers SW (dashed lines) and CFH (solid) in December 2003. Top panels show those from Bandung and the bot-tom are from Tarawa.
the air parcel retains its identity during advection. Trajecto-ries corresponding to the relatively humid days of December 5 (top) show that the air parcels originated in midlatitudes have not been exposed to extremely low temperature (SMR of about 10 ppmv), while those of the dry days of December 11 (bottom) have spent a relatively long time advecting along the 5◦S latitude circle and are processed by low temperatures (SMR of around 5 ppmv) just before the arrival at Bandung. Thus the temperature history that the air parcels have expe-rienced could well be reflected in the observed water vapor mixing ratio. The trajectories for Tarawa, on the other hand, show a large scatter between the members in each bundle of trajectories, so that the identification of the core is abandoned for those earlier than four days before the sounding. Thus it suggests that the air parcels’ identity was established just a few days earlier (Sect. 2). It is also seen that the temper-ature they have been exposed to is appreciably higher than that for the soundings at Bandung. The range of SMR during 24 h before arrival at Tarawa is about 16–23 ppmv for those parcels observed on the days 8 and 9 and about 20–33 ppmv for that of the day 10, again corresponding qualitatively to the observed difference in the water vapor mixing ratio around 350–355 K level (Fig. 5).
4 Discussion
During the SOWER campaign December 2003, two kinds of hygrometers, CFH and SW, were flown in the tropical
Fig. 6. A bundle of isentropic backward trajectories (355 K) corresponding to the soundings on December 5 and 11 over Bandung (left),
and December 8 and 10 over Tarawa (right) color-coded by saturation mixing ratio of water vapor. See text for the details.
Fig. 7. A scatter plot between the minimum saturation mixing
ra-tio of the core region along isentropic backward trajectories (ab-scissa) and the observed mixing ratio (ordinate) on the surfaces of 350 (red), 353 (green), 355 (blue) and 360 K (black). Observational stations and instruments are identified by specific marks. Simulta-neous observations by CFH and SW are connected by solid lines.
western Pacific to observe dehydrated air parcels horizontally advecting in the TTL. Reasonable agreement was attained between the two up to around 355 K isentropic surface. The OMRs on 355 K isentrope at Bandung are grouped into wet (about 20 ppmv) and dry (about 10 ppmv) cases observed on
5–8 and 10–11 December , respectively. The trajectory cal-culations suggest that such differences reflect the coldness the air parcels have experienced during advection. However, several other causes could be pointed out: Sub-grid scale mo-tion that is missing in the analysis field might have affected trajectories and water content, the analysis field could have a bias against sonde observations, small errors in pressure and temperature could have resulted in large difference in the OMR on a specified isentrope due to strong vertical gra-dient of water profile, organized convection along the trajec-tories might have moistened the air parcel during advection, or the efficiency of dehydration is affected by supersaturation which is not well understood. All these possibilities need to be considered before concluding any definite statement.
In spite of these limitations, it is interesting to look into some more details on the relationship between the OMR and the degree of coldness the air parcels are exposed to dur-ing horizontal advection before sounddur-ings are made. Such a relationship is examined in Fig. 7, in which the ordinate is the OMR by SW (+ in Bandung and ⋄ in Tarawa) and by CFH (×) and the abscissa is the minimum SMR (SMRmin)
of corresponding air parcel that is defined by the average of the core region (Sect. 2). The period searching for the SMRmin is taken to be seven days for the trajectories from
Bandung, but it is chosen to be four days for those from Tarawa considering the modification of air parcels’ identity (Fig. 6). The values on 360 K are also shown relying on the CFH soundings on 10 and 11 December. There found no systematic difference between the simultaneous observations by SW and CFH (connected by solid lines in Fig. 7). The
well-defined correspondence between OMR and SMRmin
de-picted in Fig. 7 is due primarily to the strong vertical gradient of water mixing ratio in the lower TTL; the values on 350 K (red) are much greater than those on 360 K (black) with some intermediate values on 353 (green) and 355 K (blue). In ad-dition to this general behavior, however, we could see that the air parcels with lower SMRmintend to have lower OMR
on each of the three isentropes (350, 353 and 355 K) at both stations though the sample size is small.
Another point of interest is that, while some plots sit quite close to the “saturation line” connecting the lower left and upper right corners, more data points are located above it rather than below it. It implies that appreciable number of air parcels go through the cold region without being dehydrated to the level of SMR. It is quite natural if some processes such as supersaturation and/or re-evaporation before sedimenta-tion are important. Another possibility is that the air parcels were moistened by deep convection. Actually our investi-gation on the satellite (GOES 9) IR images, while those on 4 December are missing, detected some events in which the temperature of advecting air parcel was higher than that of the cloud top corresponding to its location. In such cases, ap-preciable amount of water could be injected to the air parcels and isentropic trajectory calculations may not be properly ex-tended backward beyond that point. Those on 350 K surface, sometimes coming down to around 200 hPa, are frequently affected by convection, while those on 360 K travel mostly above convective clouds. On 355 K surface, the most promi-nent convective event was observed on December 5 for the trajectories corresponding to the sounding on December 10 at Bandung. However, the OMR for this sounding appears similar to that of others (Fig. 5). The air parcels will be more liable to be affected by convection in Tarawa than in Bandung as can be expected from the divergent/convergent nature of the trajectories (Fig. 6). We found that the air parcels on 355 K corresponding to the soundings of December 9 (dry) and 10 (wet) in Tarawa may be subject to convective moistening a few days before soundings. As a whole, however, there found no systematic correspondence between the OMR and the possible convective moistening in Fig. 7.
The effect of wave-driven temperature perturbations unre-solved in the analysis field (Jensen and Pfister, 2004) does not help reduce the difference between OMR and SMRmin,
although this does not rule out possible contribution of such an effect. Information on the formation of TTL cirrus clouds, such as that given by lidars, will help reduce such uncertain-ties (Shibata et al., 2007). Accumulation of observational evidences such as those shown in the present study is quite important to examine the efficiency of dehydration in the TTL and to better parameterize microphysical processes in dehydration models. It will also serve to confirm if the sim-plified treatment of dehydration such as that performed by Fueglistaler et al. (2005) could be justified for the purpose of estimating the annual mean and the seasonal and interannual variations of stratospheric water.
It is also worth mentioning that both OMR and SMRmin
are mostly higher in Tarawa than in Bandung if compared on the same isentropes (Fig. 7). Although the observed air masses are not identical between the two stations, this will be related to the fact that Tarawa is generally located on the upstream side of Bandung for the air parcels migrating in the TTL. Thus the difference in the climatological OMR be-tween the two stations is a measure of the efficiency of de-hydration during horizontal advection in the western tropical Pacific. To make this argument more quantitative, repeated sonde observations of the same air mass following its motion is quite interesting. Such an idea, “match” technique, was put forward and brought into practice for the study of ozone depletion in the stratospheric winter polar vortex (Rex et al., 1998). The water vapor “match” in the TTL of the western Pacific, if successful, will give us interesting information for the study of TTL dehydration. Relatively good agreement seen in the SMRs estimated by ECMWF analysis and sonde observations (Fig. 4) is encouraging, although the analysis is not yet comprehensive and things might look different away from sounding sites.
5 Concluding Remarks
The accumulation of observational evidence on the distri-bution and variability of water vapor in the TTL is cru-cial for understanding the dehydration processes acting on air parcels entering the stratosphere. In situ balloon-borne chilled-mirror hygrometer observations are effective for this purpose due to their high vertical resolution and instrumen-tal mobility. The Lagrangian characterization of air parcels suggests that the modification of air parcels’ properties could result from the branching-out and merging-in of nearby tra-jectories.
Water vapor data taken by chilled-mirror hygrometers in the western tropical Pacific during the December 2003 SOWER campaign have been analyzed to study the effi-ciency of dehydration by taking the advantage of four dual launches of SW and CFH (in addition to several single launches of SW alone). The day-to-day variations of the water vapor mixing ratio in the region between the 350 and 355 K isentropes can be interpreted on the basis of the ori-gin of the air parcels and by the degree of coldness the air parcels are exposed to during horizontal advection. Although the number of observations is still too small, the air parcels observed in the current study retained the water vapor more than that expected from the minimum saturation mixing ratio along trajectories on many occasions.
Acknowledgements. Most of the analyses were conducted during
FH’s stay at the Instituto Nacional de Meteorolog´ıa e Hidrolog´ıa (INAMHI) of Ecuador under the program The Dispatch of Researchers Overseas, supported by the Ministry of Education, Culture, Sports, Science and Technology of Japan. FH wishes to express hearty gratitude to G. Garc´ıa, H. Enriquez, L. Poveda,
M. Agama and numerous other members of INAMHI for their support during the stay in Ecuador. Some of the results were presented at the 2nd International SOWER Meeting held at San Crist´obal, Gal´apagos, Ecuador in July 2004. We appreciate helpful comments by A. Gettelman of NCAR and three anonymous reviewers to improve the analysis. We are also thankful to the great help of the members of Lembaga Penerbangan dan Antariksa Nasional (LAPAN) of Indonesia and the Meteorological Office of Tarawa, Kiribati in conducting the campaign observations. This work was supported by the Japan Society for the Promotion of Science, Grant-in-Aid for Scientific Research (A) 15204043, and the Global Environment Research Program (A-1) of the Ministry of the Environment.
Edited by: P. Haynes
References
Atticks, M. G. and Robinson, G. D.: Some features of the structure of the tropical tropopause, Quart. J. Roy. Meteorol. Soc., 109, 295–308, 1983.
Brewer, A. W.: Evidence for a world circulation provided by the measurements of helium and water vapour distribution in the stratosphere, Quart. J. Roy. Meteorol. Soc., 75, 351–363, 1949. Chen, P.: Isentropic cross-tropopause mass exchange in the
extrat-ropics, J. Geophys. Res., 100, 16 661–16 673, 1995.
Dethof, A., O’Neill, A., and Slingo, J.: A mechanism for moisten-ing the lower stratosphere involvmoisten-ing the Asian summer monsoon, Quart. J. Roy. Meteorol. Soc., 125, 1079–1106, 1999.
Dethof, A., O’Neill, A., Slingo, J. M., and Berrisford, P.: Quantifi-cation of isentropic water-vapour transport into the lower strato-sphere, Quart. J. Roy. Meteorol. Soc., 126, 1771–1788, 2000. Dvortsov, V. L. and Solomon, S.: Response of the stratospheric
tem-peratures and ozone to past and future increases in stratospheric humidity, J. Geophys. Res., 106, 7505–7514, 2001.
Eguchi, N. and Shiotani, M.: Intraseasonal variations of water vapor and cirrus clouds in the tropical upper troposphere, J. Geophys. Res., 109, D12106, doi:10.1029/2003JD004314, 2004.
Evans, S. J., Toumi, R., Harries, J. E., Chipperfield, M. P., and J. M. Russel, I.: Trends in stratospheric humidity and the sensi-tivity of ozone to these trends, J. Geophys. Res., 103, 8715–8725, 1998.
Forster, P. M. d. F. and Shine, K. P.: Stratospheric water vapour changes as a possible contributor to observed stratospheric cool-ing, Geophys. Res. Lett., 26, 3309–3312, 1999.
Forster, P. M. d. F. and Shine, K. P.: Assessing the climate impact of trends in stratospheric water vapor, Geophys. Res. Lett., 29, 1086, doi:10.1029/2001GL013909, 2002.
Fueglistaler, S. and Haynes, P. H.: Control of interannual and longer-term variability of stratospheric water vapor, J. Geophys. Res., 110, D24108, doi:10.1029/2005JD006019, 2005.
Fueglistaler, S., Wernli, H., and Peter, T.: Tropical troposphere-to-stratosphere transport inferred from trajectory calculations, J. Geophys. Res., 109, D03108, doi:10.1029/2003JD004069, 2004. Fueglistaler, S., Bonazzola, M., Haynes, P. H., and Peter, T.: Strato-spheric water vapor predicted from the Lagrangian temperature history of air entering the stratosphere in the tropics, J. Geophys. Res., 110, D08107, doi:10.1029/2004JD005516, 2005.
Fujiwara, M., Kita, K., and Ogawa, T.: Stratosphere-troposphere exchange of ozone associated with the equatorial Kelvin wave as observed with ozonesondes and rawinsondes, J. Geophys. Res., 103, 19 173–19 182, 1998.
Fujiwara, M., Hasebe, F., Shiotani, M., Nishi, N., V¨omel, H., and Oltmans, S. J.: Water vapor control at the tropopause by equa-torial Kelvin waves observed over the Gal´apagos, Geophys. Res. Lett., 28, 3143–3146, 2001.
Fujiwara, M., Shiotani, M., Hasebe, F., V¨omel, H., Oltmans, S. J., Ruppert, P. W., Horinouchi, T., and Tsuda, T.: Performance of the Meteolabor “Snow White” chilled-mirror hygrometer in the tropical troposphere: Comparisons with the Vaisala RS80 A/H-Humicap sensors, J. Atmos. Oceanic Technol., 20, 1534–1542, 2003.
Gettelman, A., Holton, J. R., and Douglass, A. R.: Simulations of water vapor in the lower stratosphere and upper troposphere, J. Geophys. Res., 105, 9003–9023, 2000.
Gettelman, A., Randel, W. J., Wu, F., and Massie, S. T.: Transport of water vapor in the tropical tropopause layer, Geophys. Res. Lett., 29, 1009, doi:10.1029/2001GL013818, 2002.
Gettelman, A., de F. Forster, P. M., Fujiwara, M., Fu, Q., V¨omel, H., Gohar, L. K., Johanson, C., and Ammerman, M.: Radiation balance of the tropical tropopause layer, J. Geophys. Res., 109, D07103, doi:10.1029/2003JD004190, 2004a.
Gettelman, A., Kinnison, D. E., Dunkerton, T. J., and Brasseur, G.: Impact of monsoon circulations on the upper tropo-sphere and lower stratotropo-sphere, J. Geophys. Res., 109, D22101, doi:10.1029/2004JD004878, 2004b.
Goff, A. J. and Gratch, S.: Low-pressure properties of water from –160 to 212◦F, Trans. Amer. Soc. Heat. Vent. Eng., 52, 95–122, 1946.
Hare, S. H. E., Gray, L. J., Lahoz, W. A., O’Neill, A., and Steenman-Clark, L.: Can stratospheric temperature trends be at-tributed to ozone depletion?, J. Geophys. Res., 109, D05111, doi:10.1029/2003JD003897, 2004.
Hartmann, D. L., Holton, J. R., and Fu, Q.: The heat balance of the tropical tropopause, cirrus, and stratospheric dehydration, Geo-phys. Res. Lett., 28, 1969–1972, 2001.
Hasebe, F., Shiotani, M., V¨omel, H., Fujiwara, M., Nishi, N., Ni-wano, M., Uetake, T., Ikeda, M., Ogawa, T., Oltmans, S. J., and Gage, K.: First Results from the SOWER/Pacific 1998/1999 Campaigns, in: Atmospheric Ozone, Proceedings of the Qua-drennial Ozone Symposium –Sapporo 2000–, pp. 783–784, 2000.
Hatsushika, H. and Yamazaki, K.: Interannual variations of temper-ature and vertical motion at the tropical tropopause associated with ENSO, Geophys. Res. Lett., 28, 2891–2894, 2001. Hatsushika, H. and Yamazaki, K.: Stratospheric drain over
Indone-sia and dehydration within the tropical tropopause layer diag-nosed by air parcel trajectories, J. Geophys. Res., 108, 4610, doi:10.1029/2002JD002986, 2003.
Haynes, P. H., Marks, C. J., McIntyre, M. E., Shepherd, T. G., and Shine, K. P.: On the “downward control” of extratropical diabatic circulations by eddy-induced mean zonal forces, J. Atmos. Sci., 48, 651–678, 1991.
Highwood, E. J. and Hoskins, B. J.: The tropical tropopause, Quart. J. Roy. Meteorol. Soc., 124, 1579–1604, 1998.
Holton, J. R. and Gettelman, A.: Horizontal transport and the dehy-dration of the stratosphere, Geophys. Res. Lett., 28, 2799–2802,
2001.
Holton, J. R., Haynes, P. H., McIntyre, M. E., Douglass, A. R., Rood, R. B., and Pfister, L.: Stratosphere-troposphere exchange, Rev. Geophys., 33, 403–439, 1995.
Horinouchi, T., Sassi, F., and Boville, B. A.: Synoptic-scale Rossby waves and the geographic distribution of lateral transport routes between the tropics and the extratropics in the lower stratosphere, J. Geophys. Res., 105, 26 579–26 592, 2000.
Houghton, J. T., Ding, Y., Griggs, D. J., Noguer, M., van der Lin-den, P. J., Dai, X., Maskell, K., and Johnson, C. A., eds.: Cli-mate Change 2001: The Scientific Basis. Contribution of Work-ing Group I to the Third Assessment Report of the Intergovern-mental Panel on Climate Change, Cambridge University Press, 2001.
Jackson, D. R., Methven, J., and Pope, V. D.: Transport in the low-latitude tropopause zone diagnosed using particle trajectories, J. Atmos. Sci., 58, 173–192, 2001.
Jensen, E. and Pfister, L.: Transport and freeze-drying in the tropical tropopause layer, J. Geophys. Res., 109, D02207, doi:10.1029/2003JD004022, 2004.
Kley, D., Russell III, J. M., and Phillips, C.: SPARC Assessment of Upper Tropospheric and Stratospheric Water Vapour, WCRP 113 WMO/TD-No. 1043 SPARC Report No. 2, 2000.
Mote, P. W., Rosenlof, K. H., McIntyre, M. E., Carr, E. S., Gille, J. C., Holton, J. R., Kinnersley, J. S., Pumphrey, H. C., Russell III, J. M., and Waters, J. W.: An atmospheric tape recorder: The imprint of tropical tropopause temperatures on stratospheric wa-ter vapor, J. Geophys. Res., 101, 3989–4006, 1996.
Murphy, D. M. and Koop, T.: Review of the vapour pressures of ice and supercooled water for atmospheric applications, Quart. J. Roy. Meteorol. Soc., 131, 1539–1565, 2005.
Murray, F. W.: On the computation of saturation vapor pressure, J. Appl. Meteorol., 6, 203–204, 1967.
Newell, R. E. and Gould-Stewart, S.: A stratospheric fountain?, J. Atmos. Sci., 38, 2789–2796, 1981.
Oltmans, S. J. and Hofmann, D. J.: Increase in lower-stratospheric water vapour at a mid-latitude Northern Hemisphere site from 1981 to 1994, Nature, 374, 146–149, 1995.
Plumb, R. A. and Eluszkiewicz, J.: The Brewer-Dobson circulation: Dynamics of the tropical upwelling, J. Atmos. Sci., 56, 868–890, 1999.
Postel, G. A. and Hitchman, M. H.: A climatology of Rossby wave breaking along the subtropical tropopause, J. Atmos. Sci., 56, 359–373, 1999.
Ramaswamy, V., Schwarzkopf, M. D., and Randel, W. J.: Finger-print of ozone depletion in the spatial and temporal pattern of recent lower-stratospheric cooling, Nature, 382, 616–618, 1996. Ramaswamy, V., Chanin, M.-L., Angell, J., Barnett, J., Gaffen, D., Gelman, M., Keckhut, P., Koshelkov, Y., Labitzke, K., Lin, J.-J. R., O’Neill, A., Nash, J.-J., Randel, W., Rood, R., Shine, K., Sh-iotani, M., and Swinbank, R.: Stratospheric temperature trends: Observations and model simulations, Rev. Geophys., 39, 71–122, 2001.
Randel, W. J. and Cobb, J. B.: Coherent variations of monthly mean total ozone and lower stratospheric temperature, J. Geo-phys. Res., 99, 5433–5447, 1994.
Randel, W. J., Wu, F., Gettelman, A., Russell III, J. M., Zawodny, J. M., and Oltmans, S. J.: Seasonal variation of water vapor in the lower stratosphere observed in Halogen Occultation Experiment
data, J. Geophys. Res., 106, 14 313–14 325, 2001.
Randel, W. J., Wu, F., Oltmans, S. J., Rosenlof, K., and Nedoluha, G. E.: Interannual changes of stratospheric water vapor and cor-relations with tropical tropopause temperatures, J. Atmos. Sci., 61, 2133–2148, 2004.
Randel, W. J., Wu, F., V¨omel, H., Nedoluha, G. E., and Forster, P.: Decreases in stratospheric water vapor after 2001: Links to changes in the tropical tropopause and the Brewer-Dobson circulation, J. Geophys. Res., 111, D12312, doi:10.1029/2005JD006744, 2006.
Rex, M., von der Gathen, P., Harris, N. R. P., Lucic, D., Knudsen, B. M., Braathen, G. O., Reid, S. J., Backer, H. D., Claude, H., Fabian, R., Fast, H., Gil, M., Kyr¨o, E., Mikkelsen, I. S., Rum-mukainen, M., Smit, H. G., St¨ahelin, J., Varotsos, C., and Za-itcev, I.: In situ measurements of stratospheric ozone depletion rates in the Arctic winter 1991/1992: A Lagrangian approach, J. Geophys. Res., 103, 5843–5854, 1998.
Seidel, D., Ross, R. J., Angell, J. K., and Reid, G. C.: Climato-logical characteristics of the tropical tropopause as revealed by radiosondes, J. Geophys. Res., 106, 7857–7878, 2001.
Sherwood, S. C.: A stratospheric “drain” over the Maritime Conti-nent, Geophys. Res. Lett., 27, 677–680, 2000.
Shibata, T., V¨omel, H., Hamdi, S., Kaloka, S., Hasebe, F., Fuji-wara, M., and Shiotani, M.: Tropical cirrus clouds near cold point tropopause under ice supersaturated conditions observed by lidar and balloon borne cryogenic frost point hygrometer, J. Geophys. Res., 112, in press, 2007.
Shindell, D. T., Rind, D., and Lonergan, P.: Increased polar strato-spheric ozone losses and delayed eventual recovery owing to in-creasing greenhouse-gas concentration, Nature, 392, 589–592, 1998.
Stenke, A. and Grewe, V.: Simulation of stratospheric water vapor trends: impact on stratospheric ozone chemistry, Atmos. Chem. Phys., 5, 1257–1272, 2005,
http://www.atmos-chem-phys.net/5/1257/2005/.
Tsuda, T., Murayama, Y., Wiryosumarto, H., Harijono, S. W. B., and Kato, S.: Radiosonde observations of equatorial atmosphere dynamics over Indonesia. 1. Equatorial waves and diurnal tides, J. Geophys. Res., 99, 10 491–10 505, 1994.
V¨omel, H., Oltmans, S. J., Johnson, B. J., Hasebe, F., Shiotani, M., Fujiwara, M., Nishi, N., Agama, M., Cornejo, J., Paredes, F., and Enriquez, H.: Balloon-borne observations of water vapor and ozone in the tropical upper troposphere and lower stratosphere, J. Geophys. Res., 107, doi:10.1029/2001JD000707, 2002. V¨omel, H., Fujiwara, M., Shiotani, M., Hasebe, F., Oltmans, S. J.,
and Barnes, J. E.: The behavior of the Snow White chilled-mirror hygrometer in extremely dry conditions, J. Atmos. Oceanic Tech-nol., 20, 1560–1567, 2003.
V¨omel, H., David, D., and Smith, K.: The University of Colorado Cryogenic Frostpoint Hygrometer (CFH): Instrumental details and observations, J. Geophys. Res., 112, in press, 2007. Zhou, X. L., Geller, M. A., and Zhang, M.: Cooling trend of the
tropical cold point tropopause temperatures and its implications, J. Geophys. Res., 106, 1511–1522, 2001.