HAL Id: insu-02161031
https://hal-insu.archives-ouvertes.fr/insu-02161031
Submitted on 20 Jun 2019
HAL is a multi-disciplinary open access
archive for the deposit and dissemination of
sci-entific research documents, whether they are
pub-lished or not. The documents may come from
teaching and research institutions in France or
abroad, or from public or private research centers.
L’archive ouverte pluridisciplinaire HAL, est
destinée au dépôt et à la diffusion de documents
scientifiques de niveau recherche, publiés ou non,
émanant des établissements d’enseignement et de
recherche français ou étrangers, des laboratoires
publics ou privés.
Impact of topography on Venus’ cloud top properties as
observed
K-L Jessup, Emmanuel Marcq, Jean-Loup Bertaux, Franklin P. Mills, S.
Limaye, A. Roman
To cite this version:
K-L Jessup, Emmanuel Marcq, Jean-Loup Bertaux, Franklin P. Mills, S. Limaye, et al.. Impact of
topography on Venus’ cloud top properties as observed. 50th Lunar and Planetary Science Conference
2019, Mar 2019, The Woodlands, Texas, United States. pp.LPI Contrib. No. 2132. �insu-02161031�
IMPACT OF TOPOGRAPHY ON VENUS’ CLOUD TOP PROPERTIES AS OBSERVED BY HST. K-L.
Jessup
1, E. Marcq
2, J-L. Bertaux
2, F. P., Mills
3, S. Limaye
4, A. Roman
1Southwest Research Institute, Boulder CO,
USA,
jessup@boulder.swri.edu
2LATMOS/IPSL, UVSQ Université Paris-Saclay, Sorbonne Université, CNRS, Guyancourt,France 3
Australian National University, Canberra, Australia
4University of Wisconsin, Madison, Wisconsin, USA;
5Space Telescope Institute, Baltimore, MD, USA
Introduction: Venus is permanently covered with
ubiquitous H
2SO
4·H
2O cloud and haze layers of
tempo-rally and vertically variant abundance and opacity[1-4].
Data obtained during the Akatsuki and Venus Express
(VEx) missions are now revealing the interdependence
of the cloud top properties on both Venus local solar
time and topography [6-9]. In 2010/2011 Hubble
Space Telescope Imaging Spectrograph (HST/STIS)
was used to record the cloud top properties over
Aph-rodite Terra and a low elevation region downwind of
Aphrodite. The Aphrodite data were obtained on two
dates in January 2011 separated by 5 days at 200-600
nm, while the low-elevation plains regions data were
obtained in December 2010 at 200-300 nm (Table 1);
on each date two 0.1ʺ wide maps of the cloud top
radi-ance were obtained as function of latitude over local
solar times extending from 7 to 11 hr. (Fig. 1)
Table I
Date Number of maps Phase Angleⱡ
Geo. Longitude (LST, HH:MM) Terrain December 28, 2010 2 97° (7:20 to 10:41) -5 to 45E; Plains January 22,
2011 2 82° (7:20 to 10:54) 70 to 125E Aphrodite Terra Mountains January, 27,
2011 2 79° (7:20 to 10:52) 85 to 140E Aphrodite Terra Mountains ⱡPhase angle is the sun-target-observer angle; VMC observations show that the cloud top albedo brightens as the phase angle increases [13]
Observed Trends and Lessons learned: Our
analysis of these data shows distinct trends in Venus’
cloud top properties (such as the albedo levels at 245
nm, 365 nm, and the overall cloud top SO
2gas
abun-dance) as function of terrain type (mountain/plains),
latitude and LST as summarized in Figures 2-5 and
Table 2.
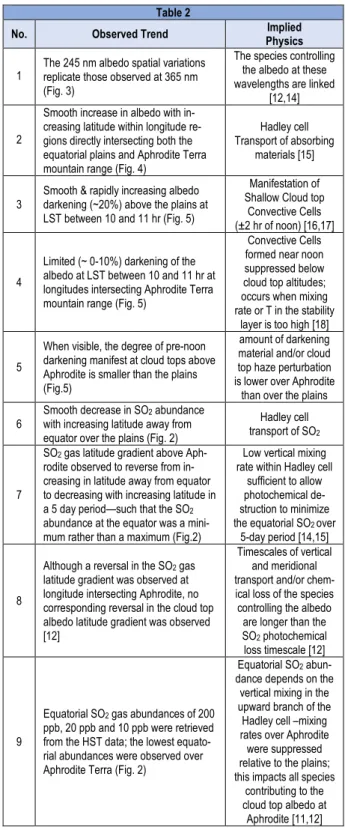
Table 2
No. Observed Trend Physics Implied
1 The 245 nm albedo spatial variations replicate those observed at 365 nm (Fig. 3)
The species controlling the albedo at these wavelengths are linked
[12,14] 2
Smooth increase in albedo with in-creasing latitude within longitude re-gions directly intersecting both the equatorial plains and Aphrodite Terra mountain range (Fig. 4)
Hadley cell Transport of absorbing
materials [15]
3 Smooth & rapidly increasing albedo darkening (~20%) above the plains at LST between 10 and 11 hr (Fig. 5)
Manifestation of Shallow Cloud top
Convective Cells (±2 hr of noon) [16,17]
4
Limited (~ 0-10%) darkening of the albedo at LST between 10 and 11 hr at longitudes intersecting Aphrodite Terra mountain range (Fig. 5)
Convective Cells formed near noon suppressed below cloud top altitudes; occurs when mixing rate or T in the stability
layer is too high [18] 5
When visible, the degree of pre-noon darkening manifest at cloud tops above Aphrodite is smaller than the plains (Fig.5)
amount of darkening material and/or cloud top haze perturbation is lower over Aphrodite
than over the plains 6 Smooth decrease in SO
2 abundance
with increasing latitude away from equator over the plains (Fig. 2)
Hadley cell transport of SO2
7
SO2 gas latitude gradient above
Aph-rodite observed to reverse from in-creasing in latitude away from equator to decreasing with increasing latitude in a 5 day period—such that the SO2
abundance at the equator was a mini-mum rather than a maximini-mum (Fig.2)
Low vertical mixing rate within Hadley cell
sufficient to allow photochemical de-struction to minimize the equatorial SO2 over
5-day period [14,15]
8
Although a reversal in the SO2 gas
latitude gradient was observed at longitude intersecting Aphrodite, no corresponding reversal in the cloud top albedo latitude gradient was observed [12]
Timescales of vertical and meridional transport and/or chem-ical loss of the species controlling the albedo are longer than the SO2 photochemical
loss timescale [12]
9
Equatorial SO2 gas abundances of 200
ppb, 20 ppb and 10 ppb were retrieved from the HST data; the lowest equato-rial abundances were observed over Aphrodite Terra (Fig. 2)
Equatorial SO2
abun-dance depends on the vertical mixing in the upward branch of the Hadley cell –mixing rates over Aphrodite were suppressed relative to the plains; this impacts all species
contributing to the cloud top albedo at Aphrodite [11,12]
Fig. 1 Two distinct cloud
top albedo maps (pink & black) are derived from the latitude x longitude swaths encountered within the 0.1ʺ HST/STIS slit on December 28, 2010, above regions with eleva-tions < 1km (cyan) at LST ~ 7 to 11 hr (top axis). Similar cloud top albedo maps were obtained above Aphrodite (see Table 1).
2728.pdf 50th Lunar and Planetary Science Conference 2019 (LPI Contrib. No. 2132)
Fig. 2 SO
2gas abundance retrieved from the 2010/2011
HST data; two paths or maps were observed on each date
as indicated by the color legend
Fig. 3 The 245 nm and 365 nm cloud top albedo
ob-served above Aphrodite show the same rate of change
with increasing latitude
Fig. 4 Smooth increases in the cloud top 245 nm albedo
with increasing latitude were observed over the plains and
over Aphrodite Terra. The 20˚ higher phase angle value
associated with the December 2010 observations
produc-es a ~ 20% brightening in the cloud top albedo in
Decem-ber 2010 relative to the January 2011 dates. Therefore, to
make a legitimate comparison of the albedo levels
be-tween the two terrain types we apply this brightening
scale factor to the January albedo data
.Fig. 5 Changes in the cloud top albedo as a function of
LST between 10 and 11 hr is shown for the plains and
Aphrodite; rapid and smooth darkening is more
promi-nent over the plains
Conclusions: We find that both the observed SO
2behavior and the observed albedo behaviors implies
that large and small scale equatorial vertical motions
(and winds) are compressed (suppressed) over
Aphro-dite, and that this compression (suppression) impacts
the abundance of SO
2gas at the cloud tops the, the
cloud top albedo, and the manifestation of sub-solar
convective cell activity at the cloud tops.
References: [1] Hansen and Hovenier, (1974) J
AtmosScie, 31, 1137. [2] McGouldrick, K. and Tsang,
C. C. C. (2017) Icarus, 286, 118–133. [3] Gao et al.
2014, Icarus, 231, 83-98. [4] Wilquet. et al. (2012)
Icarus, 217(2), 875-881 [5] Lungin.et al. (2018) .
Ica-rus, 311, 87-104. [6] Peralta et al. (2017) Nature
As-tronomy, 1, id. 0187. [7] Kouyama et al. (2017)
Ge-ophys. Res. Letters, 44, 12,098–12,105. [8] Bertuax et
al. (2016) J. Geophys. Res. 121(6), 1087–1101 [9]
Horinouchi. et al. (2018) Earth, Planets and Space, 70
(1), #10. [10] Jessup et al. (2012) VEXAG. [11]
Jessup et al. (2015) Icarus, 258, 309-336. [12] Jessup
et al. (2019) Icarus in the press [13] Lee et al. (2015)
Icarus, 253, 1-15. [14] Krasnopolsky (2012), Icarus,
218, 230-246. [15] Marcq et al. (2013), Geoscience 6,
25–28 [16] Rossow et al. (1980), JGR, 85, 8107-8128
[17] Marckiewicz Nature, 450(7170), 633–636 [18]
Baker (1999) J. Geophys. Res. 104, 3815–3832
2728.pdf 50th Lunar and Planetary Science Conference 2019 (LPI Contrib. No. 2132)