HAL Id: hal-02071741
https://hal.archives-ouvertes.fr/hal-02071741
Submitted on 18 Mar 2019
HAL is a multi-disciplinary open access
archive for the deposit and dissemination of
sci-entific research documents, whether they are
pub-lished or not. The documents may come from
teaching and research institutions in France or
abroad, or from public or private research centers.
L’archive ouverte pluridisciplinaire HAL, est
destinée au dépôt et à la diffusion de documents
scientifiques de niveau recherche, publiés ou non,
émanant des établissements d’enseignement et de
recherche français ou étrangers, des laboratoires
publics ou privés.
Fluid-structure interaction between a composite aileron
and a turbulent flow at transonic conditions
Jéromine Dumon, Nicolas Gourdain, Yannick Bury, Laurent Michel
To cite this version:
Jéromine Dumon, Nicolas Gourdain, Yannick Bury, Laurent Michel. Fluid-structure interaction
be-tween a composite aileron and a turbulent flow at transonic conditions. 53rd 3AF International
Conference on Applied Aerodynamics, Mar 2018, Salon de Provence, France. pp.1-10. �hal-02071741�
an author's https://oatao.univ-toulouse.fr/22759
Dumon, Jeromine and Gourdain, Nicolas and Bury, Yannick and Michel, Laurent Fluid-structure interaction between a composite aileron and a turbulent flow at transonic conditions. (2018) In: 53rd 3AF International Conference on Applied Aerodynamics, 26 March 2018 - 28 March 2018 (Salon de Provence, France).
53rd 3AF International Conference
on Applied Aerodynamics
26 – 28 March 2018, Salon de Provence, France
Fluid-structure interaction between a composite aileron and a turbulent
flow at transonic conditions
Jéromine Dumon (1) Nicolas Gourdain (2) Yannick Bury (3) and Laurent Michel (4)
(1)ISAE-SUPAERO/DMSM, 10 avenue Edouard Belin 31400 Toulouse (France), Email:[email protected] (2)ISAE-SUPAERO/DAEP, 10 avenue Edouard Belin 31400 Toulouse (France), Email:[email protected]
(3)ISAE-SUPAERO/DAEP, 10 avenue Edouard Belin 31400 Toulouse (France), Email:[email protected] (4)Institut Clément Ader (ICA), Université de Toulouse, CNRS-INSA-ISAE-Mines Albi-UPS, Toulouse (France),
Email:[email protected] ABSTRACT
This work reports some numerical and experimental investigations about the aerodynamic and aero-elastic behavior of a diamond aileron for a launcher dedicated to microsatellites. This work focuses mainly on the flow at transonic conditions with an emphasis on the buffet phenomenon. Indeed, the mechanical integrity of the launcher is largely compromised at transonic regime due to such shock/boundary layer interaction, that induces forces responsible for plunging and pitching moment that can damage the structure. An experimental campaign has been conducted, based on Schlieren visualizations. The experimental data are then compared with numerical predictions obtained with unsteady RANS and LES. The final objective is the analysis of buffeting impact on the composite material of the aileron.
1. INTRODUCTION
Launchers dedicated to microsatellites (payload lower than 50kg) are of paramount importance for future space missions. Among the difficulties encountered for the design of such launchers is the aero-elastic behavior of the ailerons in transonic regimes. Such ailerons are originally designed to provide stability to the launcher, especially when lateral winds are encountered. The PERSEUS’ project (French acronym for Academic and Scientific European Student project for Space research) is an initiative of CNES, the French Space Agency, to promote the emergence of innovative technical solutions for space launchers. The present work takes place in the frame of the development of SERA (Supersonic Experimental Rocket ARES) series launchers, based on a supersonic rocket.
To improve the stability of the rocket, SERA is equipped with three ailerons, depicting diamond airfoils made of composite material. With the objective to increase the reliability of ailerons in turbulent transonic flows, it is
necessary to better understand the interaction between the unsteady flow around the ailerons and the composite walls. An analysis of the flow is thus mandatory, as a first step towards the understanding of the coupling between the flow and the aileron structure, and finally the prediction of potential damages to the structure. Moreover, such information could be relevant in the context of reusable launchers, where the number of cycles that can be accomplished by the aileron must be accurately predicted.
Figure 1 - Global view of the SERA launcher and details of the aileron shape and dimensions [mm] It is thus necessary to predict the loads induced by the buffeting, to ensure that structure components and subsystems possess adequate strength, stress and fatigue margins in regard to the structural dynamic response. Buffeting is a well-known instability, that occurs in the transonic regime. Buffet is characterized by fluctuating pressures resulting from flow-induced turbulence, flow
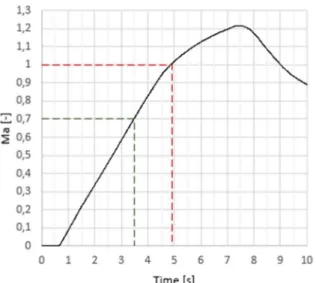
separation, wake effects, and shock oscillations. The interaction between the shock wave and the separated boundary layer causes the inception of instabilities responsible for a self-sustained periodic motion of the shock over the surface of the airfoil. In a typical flight of a SERA rocket, the transonic regime occurs during less than two seconds during its atmospheric phase as shown in Figure 2.
Transonic buffet is observed in many aeronautical applications, including internal flows (e.g. compressor passages) and external flows (e.g. aircraft wings). This phenomenon has been extensively studied, see for example the works of Percey [1], Tijdeman [2] and Lee [3]. A lot of experimental studies are also reported in the literature, on reference geometries like NACA0012 [4] and OAT15A [5]. These experimental works are completed with numerical simulations of the buffet phenomenon [6] [7] [8]. Based on this extensive knowledge, it has been possible to delay or alleviate buffeting in such geometries [9] [10] [11].
Unfortunately, the detailed mechanisms that are responsible for the buffet inception and its dynamics are still debated. Moreover, contrary to transonic profiles, there is a lack of data available in the literature for diamond airfoils, which are the target of this work.
Figure 2 – Evolution of the Mach number, as recorded during a typical flight of the SERA rocket The first part of this paper deals with the experimental and numerical methods that have been used to study buffet. In the second part, aerodynamic data are compared and analyzed, in order to highlight some of the mechanisms related to buffet for a non-moving airfoil. In the last part of the paper, numerical simulations are conducted, considering a moving airfoil, that dynamically responds to aerodynamic forces. Finally,
some conclusions and perspectives to this work are drawn.
2. METHOD
In order to gain a better knowledge of this unsteady flow, an aerodynamic study has been performed, based on both wind tunnel tests and CFD computations.
2.1.
Experimental setupDescription of the wind tunnel and method
The ISAE-SUPAERO transonic wind tunnel has a 130mm-by-80-mm rectangular slotted test section. It is powered by four vacuum pumps and provides flow Mach numbers ranging from 0.70,05 to 1.30,1. Here the Mach number is determined from the stagnation pressure Pi and the test section static pressure P according to equation (
1 )
), with Ma the Mach number and γ the isentropic expansion ratio (or heat capacity ratio).( 1 ) Time-resolved Schlieren visualizations are used to qualitatively describe the flow. They are recorded using a high speed Photron camera. Two sets of data can be recorded: 1) 704×512 pixels’ image with an acquisition frequency of 20,000 frames per second or 2) a 512×272 pixels’ image with an acquisition frequency of 50,000 frames per second. (see Fig. 3 for a global view of the experimental setup). However, Schlieren technique intrinsically integrates 3D information into a 2D image. This complicates the analysis of the images when the flow naturally exhibits 3D structures, and is responsible for a hard-to-quantify inaccuracy.
Figure 3 - (left) global view of the wind tunnel and Schlieren test bench, (right) detailed view of the wind
tunnel model of the aileron in the test section Description of the experimental mock-up
The aileron dimensions are 80mm in span and 50mm in chord, with a symmetric diamond shape (Fig. 4). Its thickness is equal to 12% of the chord, corresponding to 6mm thick. Such dimensions, with the Mach numbers considered in this work, correspond to a Reynolds number of about 700,000. The model is equipped with unsteady pressure sensors (not studied here). It is fixed on one of the transparent glass window of the wind tunnel test section (Fig. 3), on a rotating device allowing to
change the angle of attack of the aileron. In the present study, this angle is fixed to 0°0.5°. This 0° angle is determined on the basis of the Schlieren images revealing the symmetric distribution of the shock waves on both sides of the WT model. The 0.5° accuracy was determined via post processing images of calibration targets.
Figure 4 – Schematic view and dimensions of the wind tunnel aileron
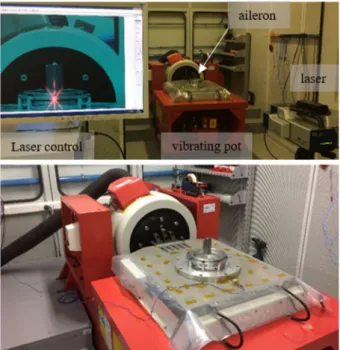
Vibration test
In order to determine the potential occurrence of a coupling between the characteristic frequencies of the flow, and in particular of the oscillating shock waves, and a specific vibratory frequency of the wind tunnel model, a modal analysis of the aileron has been conducted on a vibrating pot (Fig. 5). The setup of the aileron on the vibrating pot is chosen similar to its setup in the wind tunnel model (see Fig. 3), taking into account both the fixing beam of the aileron to the rigid structure of the wind tunnel and the window in close contact with the aileron.
Figure 5: close view of the vibrating pot (bottom) and details of the laser scanner used for the modal analysis
(top)
The modal analysis reveals three main oscillatory frequencies 𝑓 = 195,88 𝐻𝑧, 𝑓 = 225,86 𝐻𝑧 and 𝑓 = 849,70 𝐻𝑧, respectively. It should be mentioned that f3 is associated with the fixation of the window to the
vibrating pot. f1 and f2 correspond to the two first flexion modes of the aileron.
The predicted aerodynamics frequencies are away of the above-mentioned structural frequencies, which ensures that i) the potential occurrence of pressure fluctuations on the surface of the aileron due to the buffeting phenomenon and to other flow unsteadinesses during the wind tunnel tests will not be induced or enhanced by the structural deformation of the aileron, ii) the aileron will not experience severe deformation promoted by the aerodynamic excitation and its coupling with the structural deformation of the model under resonant effects.
Analysis method
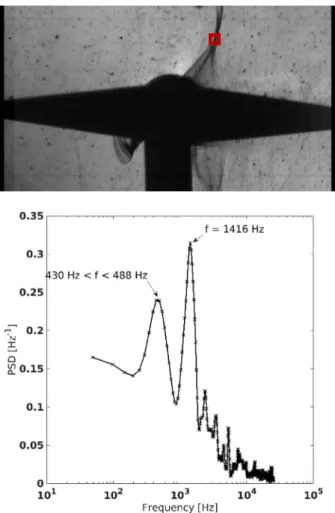
On the basis of the time-resolved Schlieren visualizations (Figure 6), a spectral analysis of the shock oscillation is proposed, based on a three-step process:
- A one pixel-height sensor line is selected in the shock oscillation area (Figure 7 - top),
- A time series of the grey level signal is extracted, - The Power Spectral Density (PSD) of this signal is
computed (Figure 7 - bottom).
Two frequencies are highlighted in Fig. 7. The first one, equals to f=45920Hz, corresponds to the buffeting phenomenon. The second peak, at f=1,41620Hz, is most probably the 2nd harmonics of the 459Hz frequency. This has to be confirmed with complementary analysis.
Figure 6: Schlieren visualizations at 2 distinct instants, revealing the oscillations of the shock waves associated
with the buffeting phenomenon
2.2.
Numerical simulation setupThis section presents the numerical analysis, led with unsteady RANS and LES approaches, considering the operating conditions of the wind tunnel (including walls). LES should provide a better description of the turbulence and of the low-scale dynamics of the aileron wake. In particular, as the zone located downstream of the shock wave is subsonic, it is expected that perturbations generated in the boundary layer and in the close wake of the aileron travel upstream and impact the shock development in the zone of the lambda-shaped shock pedestal, especially as the expected buffeting results from an interaction between separated boundary layer and the shock wave.
Figure 7 : description of the image processing-based frequency analysis, relying on the selection of a one
pixel-height sensor line (top), where grey level associated with the position of the shock wave on the image is observed as a function of the time. PSD of the
extracted signal (bottom) Geometry
The numerical model used in URANS is purely two dimensional, in order to reduce computational time effort. It strictly corresponds to the actual section of the wind tunnel model of the aileron – see Figure 4. The computational domain has been set similar to the wind tunnel test section. Indeed, it is 130mm high and 30 chords long. The center of the model is positioned 10 chords downstream of the inlet of the domain. For the LES computations, the 2D section of the actual wind tunnel model is extruded in the spanwise direction, with a span corresponding to 25% of the chord.
Numerical simulation setup
The URANS simulations are performed using STAR-CCM+ v11.02. The k-ω SST of Menter [12] was used for modeling the turbulence. The compressible solver was applied for the computations. The time solution was performed by second order scheme Runge-Kutta and a
three-order MUSCL scheme is used for convective fluxes.
LES are performed using the CharLESX solver [13], which solves the spatially filtered compressible Navier-Stokes equations for conserved quantities using a finite volume formulation and a control-volume-based discretization on unstructured hexahedral meshes. A fourth order central scheme is used for the computation (2nd order on stretched volumes as in the present study). An explicit third-order Runge-Kutta (RK3) scheme is used for time integration. The solver relies on Vreman subgrid-scale (SGS) model [14] to represent effect of unresolved small-scale fluid motions. It also features a solution-adaptive methodology which combines a non-dissipative centered numerical scheme and an essentially non-oscillatory (ENO) second-order shock-capturing scheme. The latter is applied in regions around shock waves, identified by a shock sensor sensitized to local dilatation, enstrophy and sound speed (see [13] for more details about the numerics). The solver has been successfully used to study confinement effects in shock wave/turbulent boundary layer interaction, as reported in [13]. The cost of the LES greatly depends on the boundary layer resolution. Two approaches can be used: 1) a wall-resolved approach, where local flow patterns have to be resolved, including the streaks responsible for turbulent transition and 2) a wall modeling approach that relies on a model [15] to represent the effects of the flow details close to the wall (especially in the viscous sub-layer).
Boundary conditions and meshing
As shows in Figure 8, for URANS, the inlet and outlet flow conditions are modelled as freestream and the walls are considered as adiabatic with a no-slip condition. For LES, total pressure and temperature are imposed at the inlet, static pressure at the outlet, and walls are considered as adiabatic with a no-slip condition.
Figure 8 - Schematic of the computational domain, mesh grid refinement as a function of grey levels and
boundary counditions
Regarding the URANS computations, an unstructured polyhedral 2D mesh is generated with StarCCM+, based on prism layers close to the airfoil walls and polyhedral cells in the rest of the computational domain. The size of the mesh is highly refined close to the aileron surface, and in the zone where the shock waves are expected to
develop. The prism layers were set on the aileron and wall surfaces to better capture the flow gradients in the boundary layer.
The size of the first layer was chosen to impose y+<0.5 on the aileron surfaces. A grid convergence study was performed, based on the evolution of both drag and lift coefficients. It reveals that a 1Million cell mesh is sufficient to ensure convergence on the efforts while capturing the buffeting phenomenon.
Concerning the LES, two grid strategies have been considered. The first one relies on a wall-modelling approach, with y+≈15, x+ ≈ 30 and z+ ≈ 50, leading to a 30 million cells grid. The second method relies on a wall resolved approach, with y+ ≈ 1, x+ ≈ 30 and z+ ≈ 20, that leads to a 120 million cells grid. Beyond the mesh size reduction, the main interest with the wall-modelling approach is the possibility to increase the time step by a factor of 10 in contrast to the wall resolved approach. Indeed, the cost ratio here between wall resolved and wall modelling approaches is around 40.
Analysis methods
The spectral analysis presented in section 2.2 is applied for the numerical data on the density gradient captures. Moreover, aerodynamic loads – drag and lift – are analyzed in order to understand the link between loads and the position of shock waves, using Fast Fourier Transform (FFT).
3. RESULTS
3.1 Qualitative observations
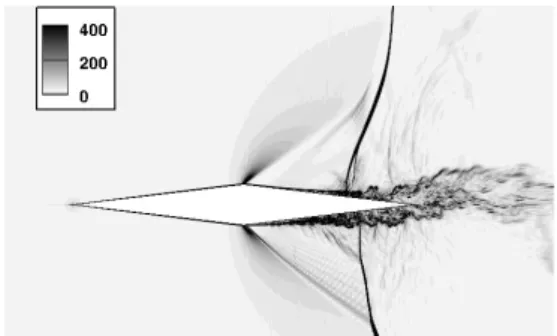
Shock wave oscillations and separated boundary layers are observed in both experimental and numerical simulations – see Figure 6, Figure 9 and Figure 10 for experimental, URANS and LES results respectively.
Figure 9 – Instantaneous iso contours of density gradient at two instants, showing the shock wave
displacement (URANS results)
For the considered free stream Mach number M=0.78, both URANS and LES-based results predict the occurrence of buffet, but at different frequencies. This observation is also reported during the experimental campaign at this Mach number.
The frequency of the shock oscillation in the URANS calculation is evaluated to f=620 Hz with the spectral analysis (Fig. 11).
As already mentioned, the analysis of the Schlieren-based data remains difficult due to the presence of a three-dimensional, time-varying deformation of the shock wave in the spanwise direction, see Figure 12.
Figure 10 - Instantaneous flow fields coloured with the density gradient, showing dissymmetric shock waves
(wall-model LES)
Figure 11 - PSD of the density gradient analysis
Figure 12 - 3D supposed shock wave visualization on the aileron confronted to the 2D Schlieren vizualisation
(more visible on the animated sequence) A secondary oscillation of the shock wave is observed in both numerical and experimental data: the local boundary layer separation induces an oblique weak shock wave in front of the strong shock wave, resulting in a classical delta shaped pedestal. While the dominant frequency results from the interaction between the strong shock wave and the boundary layer separation, the secondary oblique shock wave also oscillates due to the local periodic flow separation in front of the strong shock wave (Figure 10).
The extension of the shock displacement is highlighted on time-averaged flow field colored with the root mean square of the density, in Fig. 13. While in the URANS
calculation the shock reaches a position close to the maximum thickness of the airfoil (corresponding to a boundary layer fully separated on the rear part of the profile), LES predicts a more restricted extension of the shock displacement, on the last 20% of the airfoil chord. A potential explanation lies in the high level of turbulent kinetic energy predicted with LES in the vicinity of the wall (see Fig. 13) that limits the separation of the boundary layer.
Figure 13 – Time-averaged flow field from LES data: (top) root mean square of the density and (bottom)
turbulent kinetic energy
Numerical simulations show periodic disturbance of the wake. Using the URANS data, the Figure 14 illustrates, first, the initiation of the wake motion, second, the entire perturbed wake. This scenario switches alternatively from one side of the airfoil to the other side. This disturbance is also observed in the LES, as shown in Figure 10.
Figure 14 - periodic disturbance of the wake on the URANS simulation (inception - left : red square,
disturbed state - right) Turbulence analysis
The prediction of turbulent intensity, especially in the region of interaction between the shock wave and the boundary layer is of paramount importance. An analysis of the typical size of the turbulent flow patterns is conducted to exploit the LES database. First, two points correlation, defined as
(2) are performed on the rear part of the aileron. The focuses here is done on the correlation term B11, corresponding to the streamwise velocity. It is then possible to estimate the Taylor microscale λ, that is deduced from the second derivative of the correlation function at the origin f”(0), as
(3) The correlation function f is difficult to estimate (although it could be approximated by a polynomial function). A common way to overcome this difficulty is to expand the correlation function in a McLaurin series, in the vicinity of the origin. By retaining the first order term only, the correlation function writes
( 4 ) From Eq. (3), it is straightforward to provide an estimation of the Taylor microscale λ. Results are shown in Fig. 15 for a plane located on the rear part of the profile (from the maximum thickness at x/C=50% to the trailing edge located at x/C=100%).
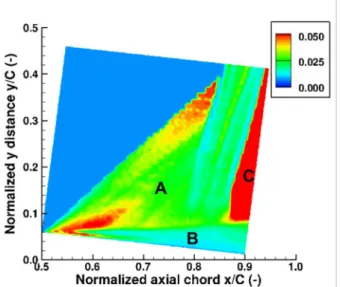
Figure 15 – Taylor microscale deduced from two points correlation (LES results)
Three different regions are observed. In the region located between the oblique shock and the strong shock (noted A) the Taylor microscale λ is about 2% of chord. In the vicinity of the boundary layer (noted B), the value of λ represents less than 1% of the chord. Outside the boundary layer, close to the strong shock position, λ is more than 5% of the chord. This analysis underlines the heterogeneous nature of turbulence in this configuration, which represents a challenge for numerical flow solvers. Load evolutions
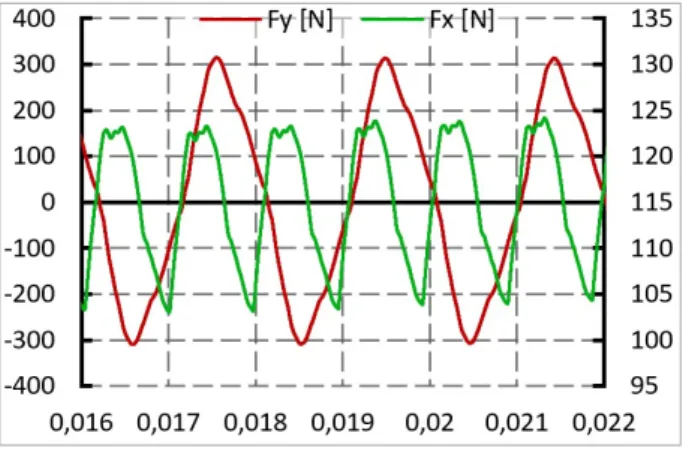
The aerodynamic loads are fully unsteady and associated with the shock displacement, as shown in Fig. 16. Indeed, the lift and drag oscillations are driven by the buffeting phenomenon. The FFT – see Fig. 17 and Fig. 18 – highlights a fundamental peak at 516 Hz and its harmonics. The Strouhal number, based on the upstream velocity and the chord, is equal to 0,089.
The analysis of load signals is not straightforward. Contrary to what was expected, correlations between instantaneous flow fields and lift signals shows that the instant at which the lift is null does not correspond to the instant where the shocks are symmetric on both sides of the airfoil. This behavior is explained by the dynamic of the shock, which is different depending on its direction of displacement (upstream or downstream). This shock dynamic is thus associated with both lift and drag signals which are not sinusoidal, which in turn explains why the zero lift is not achieved when the positions of the shocks are symmetric. At last it is interesting to note that the drag frequency is twice the lift frequency.
Figure 16 - Aerodynamics efforts (left : lift, right : drag) as a function of time [s] (URANS results)
Figure 17 - FFT of lift from the URANS simulation
Figure 18 - FFT of drag from the URANS simulation The lift and drag predicted with the wall-resolved LES are shown in Figure 19 . It is important to mention that only one shock oscillation has been simulated at the moment with this approach, which still does not allow to reveal the main buffeting effect. However, these results
highlight a higher oscillation frequency, probably related to the oblique shock oscillation. The magnitude order in terms of lift and drag are similar to URANS predictions. More buffet periods are however required to consolidate wall-resolved LES results.
Figure 19 - aerodynamics efforts (left : lift, right : drag) as a function of time [s] ( LES results. Note that the
transient phase of the computation is still not fully completed, as only the first buffeting period has been
computed yet) Comparison
As shown in Table 1, the frequencies predicted by numerical simulations are of the same order of magnitude as measurements. The differences between URANS and LES are most probably due to the maximal amplitude of the shock wave displacement which impose different travelling distances, from the trailing edge to the maximum thickness for URANS, but only on the last 25% of the chord for LES.
Exp. URANS LES
Schlieren and/or 𝑔𝑟𝑎𝑑(𝜌)
Between 450
and 490 Hz Between 550 and 620 Hz -
Lift - 516 Hz 385 Hz
Table 1: Comparison of the buffet frequencies between URANS, LES and measurements
Influence of Reynolds and Mach numbers
To complete the numerical simulations in wind tunnels conditions, a study has been performed at Reynolds conditions close to the ones encountered by the SERA rocket. The URANS approach is used with the same methodology as the one previously described (see Sec. 2.2). The 2D geometry considered here is based on a slice of the real aileron, at mid-span of the real swept aileron. At this location, the chord of the airfoil is 200mm and the relative thickness is 12% of the chord.
The numerical simulations are performed for several Mach numbers so that the transonic range is entirely
covered, from M=0.77 to M=0.83. Figure 20 depicts three instants of the simulation which allows to identify buffeting thanks to the shock wave and the boundary layer oscillations. To quantify the buffeting, the aerodynamic loads are analysed. Indeed, the buffeting oscillation frequency is equal to the lift oscillation frequency and the drag frequency is twice the lift frequency, similarly to the analysis based on the wind tunnel model scale.
Figure 20- Instantaneous flow fields colored with Mach number isocontours, at three different instants of the
buffeting period
Buffeting is observed for Mach numbers ranging from 0.78 to 0.81. As illustrated in Figure 21, the normalized buffet frequency is constant, corresponding to a Strouhal number (based on upstream velocity and axial chord) of 0.083, which is still very close to the Strouhal number reported for the wind-tunnel configuration. The amplitude of oscillations grows with the Mach number. The unsteady loads recorded at M=0.805 are now used to study the structure response to such aerodynamic solicitations.
Figure 21 - Lift coefficient and Strouhal number evolution with respect to the Mach number
4. FLUID STRUCTURE INTERACTION:
IMPACT OF BUFFETING ON AILERON Buffeting applies unsteady loads on the aileron. Its interaction with flexibility of composite aileron has to be determined. A solution for efficiently doing airfoil aerodynamics simulations with coupled flexibility effects is presented in the following part.
4.1.
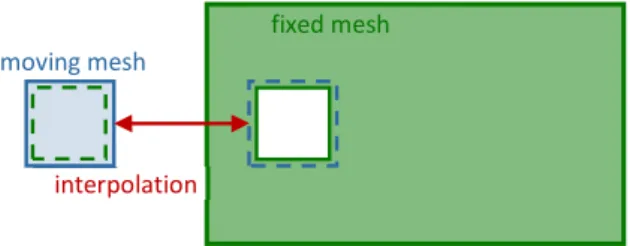
Mathematical solver and methodThe Chimera technic simplify mesh generation with an automated tool for computing the grid assembly during the simulation, Fig. 22. This overset method is largely described in [16]. Here, two grid are used: a non-moving grid and a moving grid. Communication between both
meshes is done through interpolations.The moving mesh consists of a rigid body included in a refined mesh. The six degree of freedom solver (6-DOF) in STAR-CCM+ allows the computational domain (rigid body and the moving mesh) to move in any of the translational or rotational degrees of freedom. When using this model, a solid body is selected that will react to both the natural forces (pressure, viscous and body forces) and to any user defined forces. The whole computational domain is moved to preserve the refined mesh close to the rigid body. With this model, the domain moves with a body-centric local coordinate system while the flow remains moving relatively to the global coordinate system. The 6-DOF solver updates the flow field relative to the global coordinates as the domain moves through them.
Figure 22 - Chimera grid assembly
The transonic flow is difficult to model in itself. It’s why hypothesis are necessary in order to develop tools dedicated to the coupling between a transonic turbulent flow and a composite structure. In this section, a 2D study of a rigid body in an unsteady flow is considered.
4.2.
Aileron modellingThe aileron can be solicited in bending and torsion as shown on Fig. 23. To model a 2D aileron, a cross section is taken. The bending is modeled by the vertical translation in the plane and the torsion is modeled by a rotation in the plane as shown on Fig. 24.
Figure 24 - Two dimensional mechanical system
interpolation
moving mesh
fixed mesh
Figure 23 - Deformation of an aileron in torsion and flexion
The next section explains how the stiffnesses are calculated. At each time step, the aileron (with the “moving mesh”) moves in response to the exterior forces.
4.3.
Stiffness determinationThe aileron is made of a sandwich composite material. The core is an epoxy foam and the skin is a carbon laminate. Both bending and torsion are considered and modeled by the relative stiffnesses respectively defined by equations ( 5
)
and ( 6)
:𝐾 =3𝐸𝐼
𝐿 ( 5 )
𝐾 =𝐺𝐽
𝐿 ( 6 )
E (Pa) is the Young’s modulus also known as the elastic modulus, G (Pa) is the shear modulus, I (m4) and J (m4) are the second moments of area.
The epoxy foam is considered as having no impact on the aileron stiffness. So the aileron can be considered as a beam with a thin web cross section. I and J were then calculated geometrically, for a diamond cross section of diagonals equal to 220mm and 12.5 mm, with a 1 mm thick web corresponding to the laminate skin.
El Et Glt Nult
MPa MPa Mpa
145360 8323 3020 0,332
Table 2 : composite material data
E and G are material properties taking into account the composite material data presented in Table 2 and the composite layout described in Table 3. Both E and G are determined by the Classical Laminate Theory [17]. The stiffness results are presented in Table 4.
ply number layer orientation thickness
1 0° 0,2mm
2 +45° 0,2mm
3 0° 0,2mm
4 -45° 0,2mm
Table 3 : composite layout description 𝐾 𝜔 [𝑟𝑎𝑑/𝑠] 𝑇 [𝑠] 𝑓 [𝐻𝑧] Flexion 1373 N/m 82,86 0,0758 13,2 Torsion 346 Nm 41,6 0,0182 55,1
Table 4 : stiffness results
4.4.
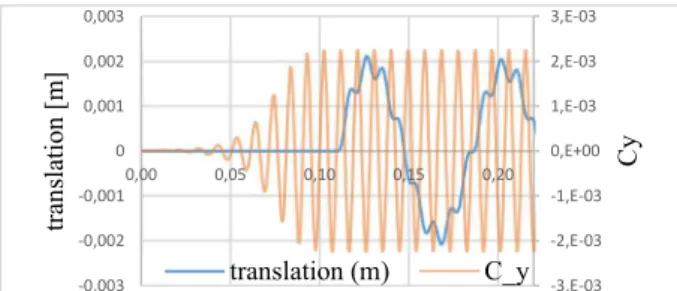
ResultsOnly one degree of freedom is analyzed here, corresponding to the bending case. The aileron translates up and down. The results plotted in Figure 25 show the vertical displacement of the aileron with respect to the time. The low frequency component of the signal corresponds to the bending natural vibration of the
spring-mass system of the modeled aileron. The high frequency component of the signal follows the buffeting frequency. The aerodynamic loads are not impacted by the motion of the aileron compared to the uncoupled case.
Figure 25 – Fluid / structure coupled simulation, showing the displacement of the airfoil (red) due to
aerodynamic forces (blue)
Two reasons explain the low sensitivity of the flow to the aileron displacement: first the displacement is small compared to the characteristic dimensions of the aileron (about 1% of the chord) and then the frequency of the aileron displacement is of one order of magnitude lower than the buffeting frequency.
Figure 26 - Fluid / structure coupled simulation, showing the displacement of the airfoil (red) due to aerodynamic forces (blue), similar to Fig. 25 but for a longer time Furthermore, a damping on the low frequency sinusoidal signal is observed in Fig. 26, that shows the vertical displacement of the airfoil for a longer time. The simulation needs to go further to be sure it is a real damping. It is expected that, at the end, the displacement will only follow the buffeting signal.
5. CONCLUSIONS
Both experimental and numerical investigations have been performed to understand buffeting phenomenon and its impact on structure. This study can be summarized by the following points:
- First, buffeting appears at transonic speed on a diamond aileron. It is verified with both simulation and experimentation,
- Experimental approach allows to guess a three dimensional oscillation which can be due to the wind tunnel wall,
- LES identify an oscillation of the width of the shock foot (λ-width) which has a significant impact on the aerodynamics load, but this phenomenon is not seen with the URANS simulation,
-3,E-03 -2,E-03 -1,E-03 0,E+00 1,E-03 2,E-03 3,E-03 -0,003 -0,002 -0,001 0 0,001 0,002 0,003 0,00 0,05 0,10 0,15 0,20 C y tr an sl at ion [ m ] translation (m) C_y
- Characteristic buffeting frequencies obtained with URANS calculations are in agreement with test results in the wind tunnel.
The results reported in this paper also represent some provisions for future works:
- Indeed, LES provide more information than URANS simulation, especially regarding turbulence statistics. Question still remains of the balance between interest of new information obtained on the aileron behavior and the numerical cost of this investigation,
- The unsteady RANS simulation should be done in three dimensions in order to understand and consolidate the spanwise oscillation of the shock observed experimentally,
- More information from the wind tunnel is needed. The use of unsteady pressure sensors on the aileron will provide a more accurate validation of the numerical simulations.
Fluid structure interaction has been investigated with a 6-dof method between a moving rigid body and an unsteady flow taking into account the bending. Torsion should have more impact on the fluid and then on the body since incidence grows buffeting effects. Further work will consist in using a stiffness dependent of the time. This stiffness degradation will be related to the damage of the aileron caused by the unsteady aerodynamic loads.
6. ACKNOWLEDGMENTS
This work is partially funded by the French Space Agency (CNES), this support is greatly acknowledged. The authors particularly thank Jean Oswald and Florent Puel from DLA (Direction des LAnceurs) at CNES. The experimental campaign was conducted with the technical team of ISAE-Supaero (special thanks to Emmanuel Rivet, Patrick Cheze and Marc Grellet). The simulations performed were achieved using CALMIP computing means, under project p1425.
7. REFERENCES
[1] H. Pearcey, K. Rao, The interaction between local effect at the shock and rear separation – a source of a significant scale effects in wind-tunnel tests on airfoils and wings, Technical report, AGARD, 1968.
[2] J. Tijdeman, Investigations of the transonic flow around oscillating airfoils, Technical report, NLR, Rapport Technique NLR TR 77090 U, 1977
[3] B.H.K. Lee, Self-sustained shock oscillations on airfoils at transonic speeds, Progress in Aerospace Sciences, 37:147-196, 2001
[4] J.B. Mc Devitt and A.F. Okuno, Static and dynamic pressure measurements on a NACA0012 airfoil at AMES high Reynolds number facility, Technical report, NASA, technical paper 2485, 1985
[5] L. Jacquin, P. Molton, S. Deck, B. Maury, and D. Soulevant. Experimental Study of Shock Oscillation over a Transonic Supercritical Profile, AIAA J., 47(9), pp. 1985-1994, 2009
[6] M. Thiery and E. Coustols. Numerical Prediction of Shock Induced Oscillations over a 2D Airfoil: Influence of Turbulence Modelling and Test Section Walls, Int. J. Heat Fluid Flow, 27 (661), 2006
[7] Renaud T., Corre C. and Lerat A., Efficient numerical simulation of buffet for airfoils in transonic regime, IFASD 2001, Madrid, June 2001
[8] Brunet V. and Deck S. Zonal-Detached Eddy Simulation of Transonic Buffet on a Civil Aircraft Type Configuration. In Advances in Hybrid RANS-LES Modelling. Notes on Numerical Fluid Mechanics and Multidisciplinary Design, 97. Springer, Berlin, Heidelberg, 2008
[9] Corre C., Renaud T., Lerat A. Transonic Flow Control Using a Navier-Stokes Solver and a Multi-Objective Genetic Algorithm. In: Sobieczky H. (eds) IUTAM Symposium Transsonicum IV. Fluid Mechanics and its Applications, vol 73. Springer, Dordrecht, 2003
[10] D., Caruana, A. Mignosi and M. Corrège M. Buffet and buffeting control in transonic flow. Aerosp. Sci. Technol. 9(7), 605–616, 2005
[11] C. Gao, W. Zhang, J. Kou, Y. Liu and Z. Ye. Active control of transonic buffet flow, J. of Fluid Mechanics, 824, pp. 312-351, 2017
[12] F. R. Menter, Two-Equation Eddy-Viscosity Turbulence Models for Engineering Applications, AIAA J., vol. 32, no 8. pp. 1598-1605, 1994
[13] Bermejo-Moreno, I., Bodart, J., Larsson, J., Barney, B. M., Nichols, J. W. and Jones, S. Solving the compressible Navier-Stokes equations on up to 1.97 million cores and 4.1 trillion grid points. High-Performance Computing, Networking, Storage and Analysis, 2013
[14] A.W. Vreman, An eddy-viscosity subgrid-scale model for turbulent shear flow: Algebraic theory and applications. Phys. Fl. 16 (10), 3670-81, DV, USA, 2004 [15] Kawai. S. and Larsson, J. Wall modeling in large eddy simulation: length scales, grid resolution and accuracy. Phys. Fluids 24, 15105, 2012
[16] D. Ziviani, A. Suman, J. Gabrielloni, M. Pinelli, M. De Paepe, and M. van den Broek. CFD Approaches Applied to a Single-screw Expander, 23rd International Compressor Engineering Conference at Purdue, 2016 [17] J.-M. Berthelot, Matériaux composites, « comportement mécanique et analyse des structures », Editions TEC & DOC, 5ème édition, 2012
![Figure 1 - Global view of the SERA launcher and details of the aileron shape and dimensions [mm]](https://thumb-eu.123doks.com/thumbv2/123doknet/12575249.346251/3.892.488.779.680.940/figure-global-sera-launcher-details-aileron-shape-dimensions.webp)